I'm an architect, I love the lines. I am passionate about financial trading, foreign exchange, investment projects, and especially studying the nature of the financial markets.
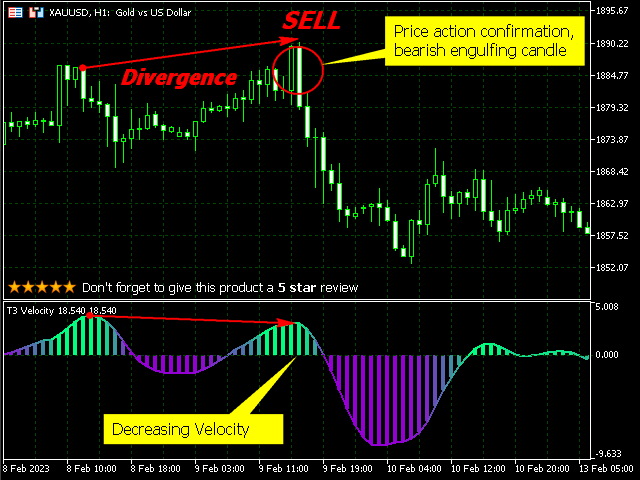
T3 Velocity Smoother - The indicator calculates the T3 velocity for a specified price type (e.g. close, open, high, low, etc.) and plots it as a histogram and a line on a separate window. The T3 velocity is calculated using the T3 moving average with a specified period and hot value. https://www.mql5.com/en/market/product/95655
T3 Velocity Smoother - The indicator calculates the T3 velocity for a specified price type (e.g. close, open, high, low, etc.) and plots it as a histogram and a line on a separate window. The T3 velocity is calculated using the T3 moving average with a specified period and hot value. The indicator also includes color-coding to show the strength of the T3 velocity. The colors change from the specified down color to the specified up color with a specified number of color steps based on the T3
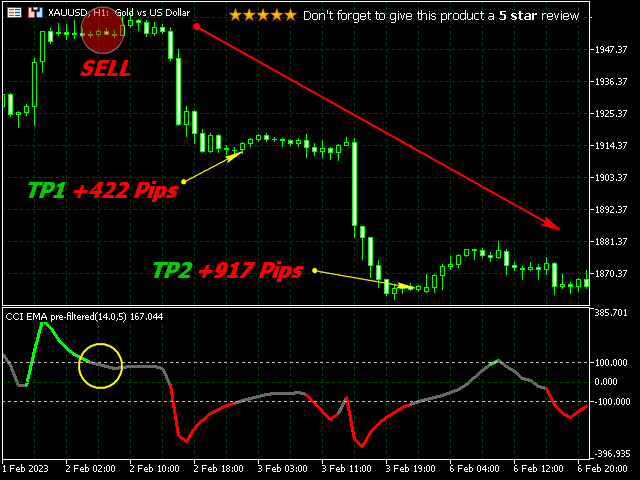
CCI Filtered Earlier for Metatrader 5 (MT5) is a helpful indicator. This indicator has been designed to smooth out the roughness of the CCI traditional indicator. The main point here is is not to smooth the result, but to filter the price first and then to use those prices in CCI calculation. The results of this filtering process are quite good. -------------------------- I'm simply bothered by its "roughness" or "nervousness," which is all. It makes quick, abrupt adjustments and occasionally
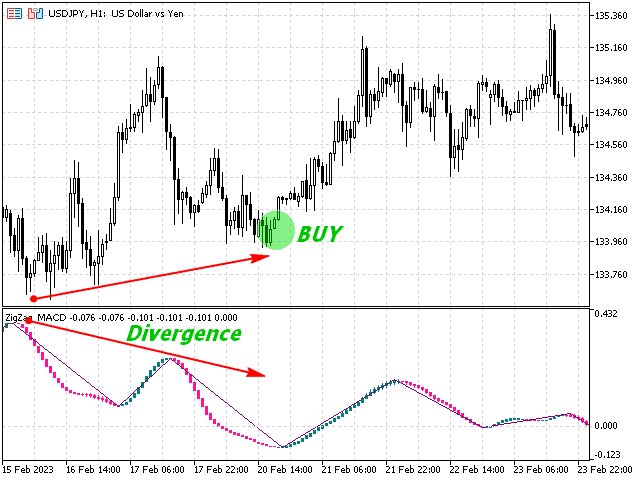
ZigZag MACDCandle – indicator for MetaTrader 5 is a Metatrader 5 (MT5) indicator and the essence of this technical indicator is to transform the accumulated history data. It is provides for an opportunity to detect various peculiarities and patterns in price dynamics which are invisible to the naked eye. https://www.mql5.com/en/market/product/95633
ZigZag MACDCandle – indicator for MetaTrader 5 is a Metatrader 5 (MT5) indicator and the essence of this technical indicator is to transform the accumulated history data. It is provides for an opportunity to detect various peculiarities and patterns in price dynamics which are invisible to the naked eye. Buy entry: Look for a swing low to form on the ZigZag indicator, indicating a potential trend reversal. Wait for the price to break above the high of the swing low and enter a long
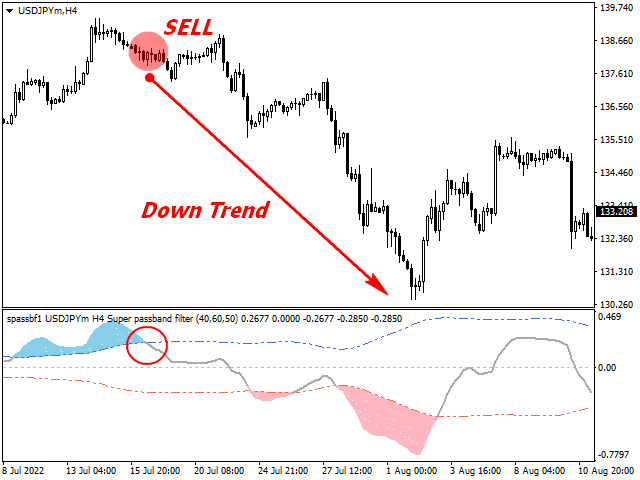
This strategy is a reversal strategy based on the confluence of a mean reversal signal and a short-term trend reversal signal using the Super Passband Filter Indicator and a moving average crossover signal. https://www.mql5.com/en/market/product/95617
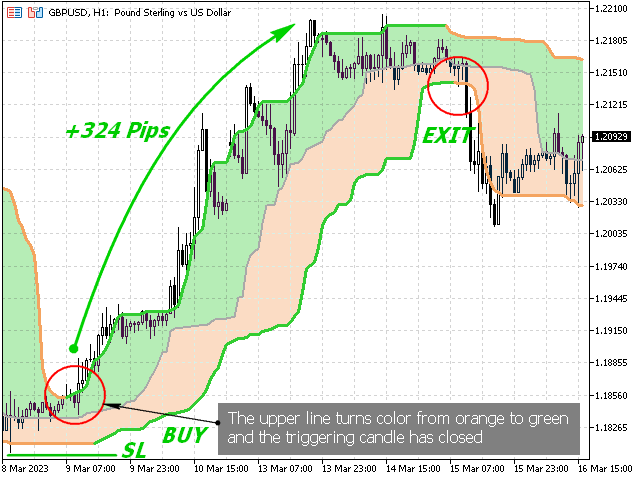
Bands Using 3 Quantile Values - The indicator creates an upper band, a lower band, and a middle value based on the quantile of a chosen price over a given period. The quantiles used for the bands are determined by the input parameters UpperBandPercent and LowerBandPercent, while the median value is determined by the input parameter MedianBandPercent. The indicator also plots two filling areas between the upper and middle values and the middle and lower values, respectively. https://www.mql5.com/en/market/product/95601
Bands Using 3 Quantile Values - The indicator creates an upper band, a lower band, and a middle value based on the quantile of a chosen price over a given period. The quantiles used for the bands are determined by the input parameters UpperBandPercent and LowerBandPercent, while the median value is determined by the input parameter MedianBandPercent. The indicator also plots two filling areas between the upper and middle values and the middle and lower values, respectively. The input parameters
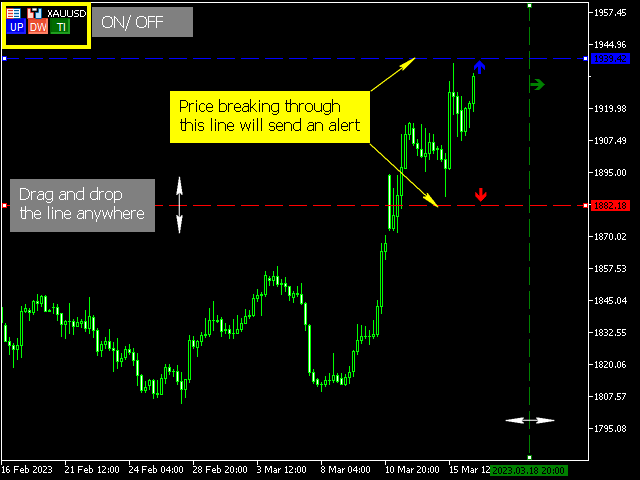
The indicator has been developed as an assistant when you wait for a breakout of an important price level, which can take hours or even days. With this indicator, you do not need to constantly monitor your terminal. The indicator alerts of a level breakdown or of the specified time using the selected method. https://www.mql5.com/en/market/product/95592
The Break Alert Up Down indicator MT5 warns the trader about the price reaching a specified level. The indicator has been developed as an assistant when you wait for a breakout of an important price level, which can take hours or even days. With this indicator, you do not need to constantly monitor your terminal. The indicator alerts of a level breakdown or of the specified time using the selected method. Monitoring charts for a prolonged time causes most traders to have "Blurred eyes". This
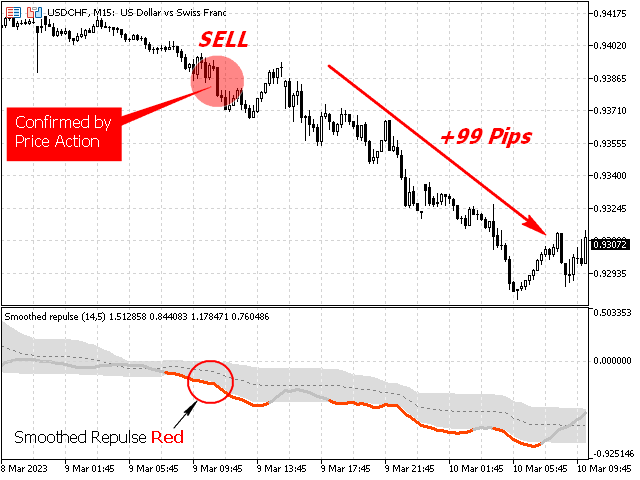
Since the "repulse" indicator is not limited to known bounds, levels are dynamic — the "zero" value too. That makes it more responsive in the times of elevated volatility. Alerts are triggered based on the color change... https://www.mql5.com/en/market/product/95578
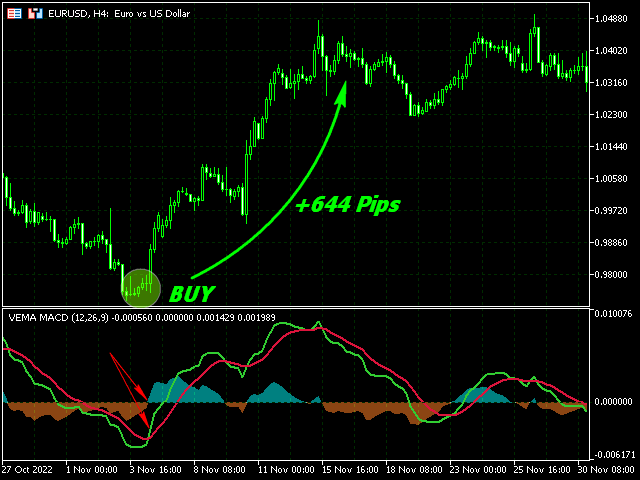
MACD Volume Weighted indicator for MetaTrader 5 (MT5) - The Volume weighted MACD This forex indicator allows users select between a tick volume and real volume (for symbols supporting real volumes at all). The indicator is comprised of a lime green volume weighted MACD line, gold colored volume weighted MACD signal line and Volume Weighted MACD OsMA (misty rose and lavender histograms). Basic Trading Signals Buy Signal: Go long if both the lime green and gold colored lines of the Volume weighted
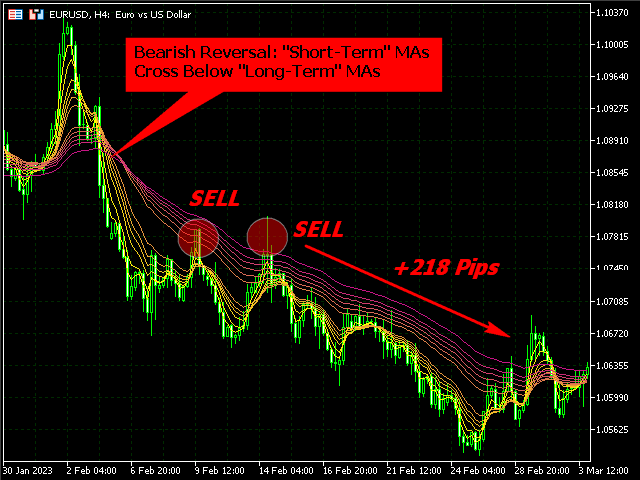
https://www.mql5.com/en/market/product/95539 The Guppy Multiple 12MA indicator for MT5, also known simply known as”Guppy“, is a technical indicator that identifies changes in trends, which means it provides you with an objective method to know when to get in and when to get out of a trade.
The Guppy Multiple 12MA indicator for MT5 , also known simply known as”Guppy“, is a technical indicator that identifies changes in trends, which means it provides you with an objective method to know when to get in and when to get out of a trade. The Guppy is a trend-following technique composed of 12 MAs (or exponential moving averages). The multiple lines of the Guppy help traders see the strength or weakness in a trend better than if only using one (or two) MAs. The 12 EMAs are
Volume Rate of Change (VROC) is an indicator of the direction where the volume trend moves. Its idea lies in the fact that almost all important graphical formations (peaks, bottoms, breaches, etc.) are accompanied by a dramatic increase of trade volume. The indicator is the difference between current bar volume and the volume n periods ago. If the current bar volume is higher than it was n periods ago, the value of the indicator will be positive. If the current volume is lower, VROC will obtain