 MetaTrader 5
 Experts
 지표
 스크립트
 라이브러리
 보관함
당사 팬 페이지에 가입하십시오

Market Structure BOS and CHoCH - swing points HH / HL / LH / LL, no repaint, alerts - MetaTrader 5용 지표

I build and fix trading tools for MetaTrader 4 and MetaTrader 5:
• Expert Advisors (EAs) built from your strategy rules
• Custom indicators, alerts and on-chart panels
- 조회수:
- 212
- 평가:
- 게시됨:
-
 이 코드를 기반으로 한 로봇이나 지표가 필요하신가요? 프리랜스로 주문하세요
프리랜스로 이동

Market structure tells you whether price is making higher highs and higher lows (up trend) or lower highs and lower lows (down trend), and when that changes. This indicator marks it on the chart with clear rules.
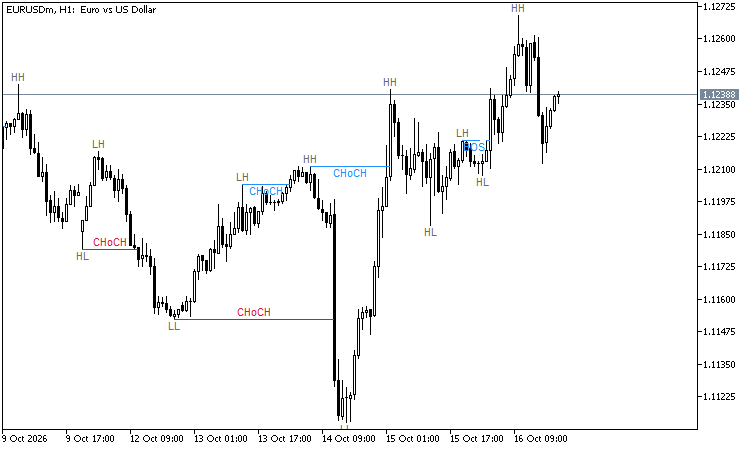
Rules
- Swing high: a high above the highs of the N candles on each side (N = swing strength, default 5). Swing low: the mirror.
- A swing counts only when its N right candles are closed. So the labels appear N candles after the swing, and they never move or disappear (no repaint).
- Each swing gets a label: HH or LH (higher or lower than the last swing high), HL or LL (higher or lower than the last swing low).
- BOS (break of structure): a candle closes beyond the last swing in the direction of the trend - the trend goes on. Drawn as a dashed line.
- CHoCH (change of character): a candle closes beyond the last swing against the trend - the trend turns. Drawn as a solid line.
- The break can be counted by the close (default) or by the wick.
Inputs
- Swing strength (candles on each side)
- Break by close or by wick
- Bars to scan (default 3000)
- BOS / CHoCH shown, swing labels on/off and how many
- Colours and font size
- Alerts on BOS and CHoCH: popup, push notification, e-mail
Buffers for Expert Advisors (iCustom, not drawn)
- 0: trend (+1 up, -1 down, 0 none yet)
- 1: last swing high, 2: last swing low (EMPTY_VALUE when none)
Example: double trend[]; CopyBuffer(handle, 0, 1, 1, trend); gives the trend on the last closed candle.
Good to know
- It works on any symbol and time frame. A bigger swing strength shows the larger structure, a smaller one the short-term structure.
- The indicator only draws and calculates; it never trades.
Fair Value Gaps (FVG) - unfilled imbalance zones with fill tracking and alerts
Draws the fair value gaps (three-candle imbalances) that price has not filled yet, follows how much of each gap is filled and ends the box when it is. Closed candles only, no repaint. Alerts and buffers for EAs.
GDS Renko Liquidity Sweep Lab
GDS Renko Liquidity Sweep Lab is a free educational indicator for studying what happens after price crosses a confirmed Renko swing level.
Accelerator Oscillator (AC)
The Acceleration/Deceleration Indicator (AC) measures acceleration and deceleration of the current driving force.
MACD Signals
Indicator edition for new platform.