 MetaTrader 5
 Experts
 지표
 스크립트
 라이브러리
 보관함
당사 팬 페이지에 가입하십시오

Fair Value Gaps (FVG) - unfilled imbalance zones with fill tracking and alerts - MetaTrader 5용 지표

I build and fix trading tools for MetaTrader 4 and MetaTrader 5:
• Expert Advisors (EAs) built from your strategy rules
• Custom indicators, alerts and on-chart panels
- 조회수:
- 144
- 평가:
- 게시됨:
-
 이 코드를 기반으로 한 로봇이나 지표가 필요하신가요? 프리랜스로 주문하세요
프리랜스로 이동

A fair value gap (FVG, also called an imbalance) is a three-candle pattern where price moved so fast that the wicks of candle 1 and candle 3 do not overlap:
- Bullish FVG: the low of candle 3 is above the high of candle 1.
- Bearish FVG: the high of candle 3 is below the low of candle 1.
Price often comes back to such a gap later. This indicator shows the gaps that are still open, so you can see at a glance where those zones are.
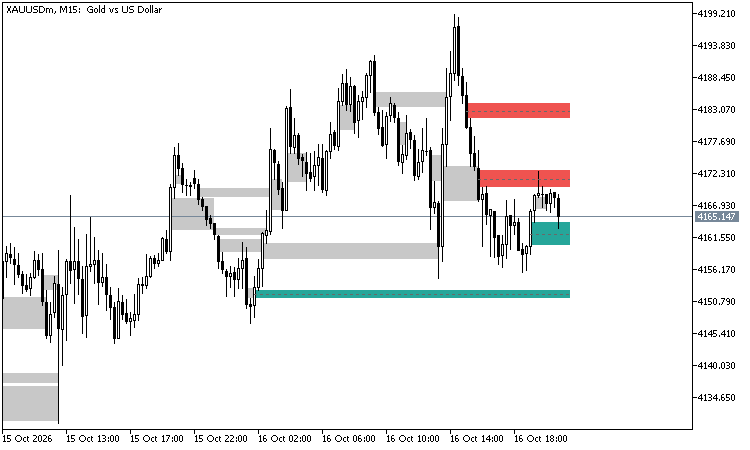
What it shows
- Every open gap as a box from candle 2 to the right, green for bullish, red for bearish.
- The 50 % line of each gap (often called consequent encroachment).
- How much of a gap price has filled since it formed. When the gap is filled (100 % by default, or the percent you set, for example 50 %), its box ends at the candle that filled it.
- Optionally the filled gaps as grey boxes, so you can see how price reacted to them.
How it works
- Gaps are found on closed candles only, so a gap never appears or disappears afterwards (no repaint).
- Small gaps can be skipped: minimum size as a part of ATR(14) (default 0.25 x ATR) or in points.
- To keep the chart clean only the newest open gaps are drawn (default 10 per direction).
- The calculation is incremental: after the first run only the new candle is processed.
Inputs
- Bars to scan (default 1500)
- Minimum gap size, x ATR(14) / in points
- A gap counts as filled at this percent (default 100)
- Unfilled gaps shown per direction; keep filled gaps as boxes; filled gaps shown
- Draw the 50 % line; colours
- Alerts: on a new gap, when price comes back into a gap; push notification and e-mail
Buffers for Expert Advisors (iCustom, not drawn)
- 0 / 1: top / bottom of the newest unfilled bullish gap
- 2 / 3: top / bottom of the newest unfilled bearish gap
- EMPTY_VALUE when there is none
Example: double top[]; CopyBuffer(handle, 0, 1, 1, top); gives the top of the newest open bullish gap on the last closed candle.
Good to know
- It works on any symbol and time frame.
- The indicator only draws and calculates; it never trades.
GDS Renko Liquidity Sweep Lab
GDS Renko Liquidity Sweep Lab is a free educational indicator for studying what happens after price crosses a confirmed Renko swing level.
Enhanced Spread Monitor
Spread Monitor is a simple information indicator for MetaTrader 5. It displays the current spread in pips in the form of a compact graphical panel with colour-coded indicators and a level bar.
Market Structure BOS and CHoCH - swing points HH / HL / LH / LL, no repaint, alerts
Market structure in the way of Smart Money Concepts: swing highs and lows with HH / HL / LH / LL labels, BOS (break of structure) and CHoCH (change of character) lines. Swings count only after their right candles close, so nothing repaints. Alerts and a trend buffer for EAs.
MACD Signals
Indicator edition for new platform.