 MetaTrader 5
 Experts
 지표
지표
 스크립트
스크립트
 라이브러리
라이브러리
 보관함
보관함
당사 팬 페이지에 가입하십시오

Rainbow Ranga - AKM - MetaTrader 5용 지표

- 조회수:
- 37
- 평가:
- 게시됨:
- 업데이트됨:
-
 이 코드를 기반으로 한 로봇이나 지표가 필요하신가요? 프리랜스로 주문하세요
프리랜스로 이동
이 코드를 기반으로 한 로봇이나 지표가 필요하신가요? 프리랜스로 주문하세요
프리랜스로 이동

이 도구가 어떻게 작동하는지, 어떤 기능을 탑재했는지, 그리고 이를 전통적인 거래에 어떻게 활용할 수 있는지에 대한 일반인도 쉽게 이해할 수 있는 설명입니다.
핵심 개념 이해하기
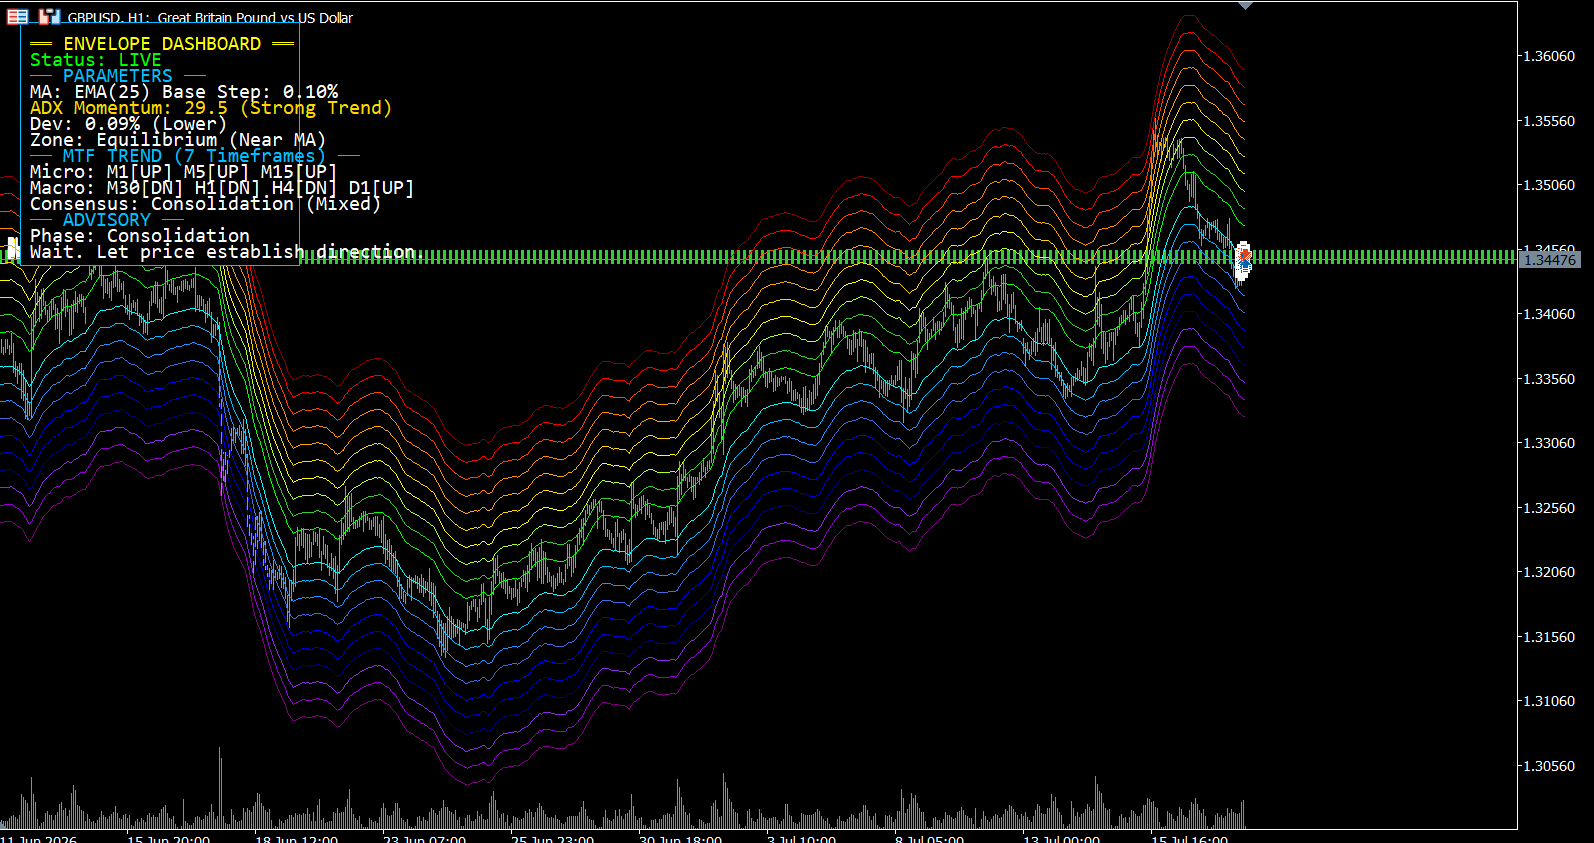
1. 레인보우 (고무줄 효과) 숨겨진 중심선(25일 EMA)을 시장의 ‘본거지’ 또는 공정 가치로 생각하십시오. 색깔이 있는 밴드(엔벨로프)는 고무줄처럼 작용합니다.
-
가격이 중앙 근처에 있을 때는 장력이 없습니다.
-
가격이 빨간색/주황색 구역으로 밀려 올라가면 고무줄이 위쪽으로 팽팽하게 당겨집니다. 이때 자산은 “비싸다”거나 과매수 상태로 간주됩니다.
-
가격이 파란색/보라색 구역으로 떨어지면 고무줄이 아래쪽으로 팽팽하게 당겨집니다. 이때 자산은 “저평가”되었거나 과매도 상태입니다.
-
고전적인 규칙: 고무줄은 항상 원래의 안정 상태로 되돌아가려고 합니다.
2. 7가지 시간대 분석 (일기 예보) 5분 차트를 보는 것은 창밖을 내다보며 돌풍을 보는 것과 같지만, 일일 차트를 보면 실제 계절이 어떤지 알 수 있습니다. 저희 대시보드는 7가지 시간대(1분부터 일일까지)를 한 번에 보여줍니다.
-
상위 시간대(매크로)가 강세라면, 전반적인 “계절”은 상승세입니다.
-
낮은 시간대(마이크로)가 갑자기 하락하더라도, 이는 주된 추세에 맞서는 일시적인 산들바람에 불과합니다.
3. ADX (기차의 속도계) ADX는 모멘텀을 측정합니다. ADX가 약하면 시장은 그저 횡보하고 있는 것입니다. ADX가 강하면 거대한 기차가 달리고 있는 것입니다. 단순히 가격이 빨간색이나 보라색 선에 닿았다는 이유만으로 반전을 예상하며, 질주하는 기차 앞에 서서는 안 됩니다.
이를 활용한 거래 방법 (전통적인 전략)
대시보드의 조언을 바탕으로, 이러한 상황에서 거래할 수 있는 세 가지 고전적인 방법은 다음과 같습니다:
전략 1: “하락 시 매수”(추세 지속)
이것은 가장 안전하고 신뢰할 수 있는 고전적인 전략입니다. 단기적인 조정을 장기적인 추세와 일치시키는 것을 목표로 합니다.
-
확인 사항: 대시보드에 따르면 MTF 컨센서스가 ‘매우 강세’로 나타납니다.
-
트리거: 가격이 하단 밴드(파란색/보라색)까지 떨어질 때까지 인내심을 가지고 기다립니다.
-
조치: 거시적 추세가 상승세이므로, 이번 하락은 폭락이 아니라 할인된 가격입니다. 대시보드는 이를 “조정성 하락(매수 구역)” 으로 표시할 것입니다. 보라색 밴드에서 반등하여 상승세를 재개할 것으로 예상하며 해당 자산을 매수합니다.
전략 2: “고무줄 튕김”(평균 회귀)
이 전략은 시장이 횡보 구간에 갇혀 있고 명확한 장기 추세가 없을 때 사용합니다.
-
확인 사항: 대시보드에 MTF 컨센서스가 ‘혼합/횡보’이고 ADX가 ‘약세’로 표시되어야 합니다.
-
트리거: 가격이 ‘극단적 빨강’ 또는 ‘극단적 보라’ 구역(0.8% 이상 편차)으로 급격히 치솟을때.
-
거래 전략: 가격을 더 밀어붙일 강력한 추세가 없기 때문에 ‘고무줄’이 한계에 도달한 상태입니다. 가격이 중간 이동평균선으로 되돌아올 것으로 예상하며, 급등/급락 방향과 반대 방향으로 거래합니다(빨간색 구간에서는 매도, 보라색 구간에서는 매수).
전략 3: 이익 실현 (임펄스 소진)
때로는 아무것도 하지 않거나, 단순히 수익을 실현하는 것이 최선의 거래가 될 수 있습니다.
-
확인해야 할 사항: 이미 매수 포지션을 보유하고 있습니다. MTF 추세가 매우 강세이며, 가격이 ‘극단적 적색 구역’까지 급격히 상승합니다.
-
조치: 대시보드에 “임펄스 소진 (기다리기/부분 청산)”이 표시됩니다. 시스템은 상승 추세임을 파악하고 있으므로, 숏 포지션 진입이나 매도를 하지 말라고 알려줍니다. 하지만 동시에 ‘고무줄’이 한계까지 늘어난 상태임을 인지하고 있어, 일시적인 하락이 임박했음을 의미합니다. 이때가 바로 기존 매수 포지션을 청산하고 이익을 실현해야 할 신호입니다.
구현한 기능 요약
-
동적 시각적 히트맵: 시장의 변동성에 따라 유동적으로 변화하며, 0.1% 단위로 정밀하게 배치된 20개의 아름다운 색상 코드 지지선 및 저항선.
-
7가지 시간대 심리지수 엔진: 1M, 5M, 15M, 30M, 1H, 4H 및 일별 차트를 동시에 확인하여 진정한 시장 모멘텀이 강세인지 약세인지 판단하는 자동 스캐너입니다.
-
스마트 단계 감지: 추세 정렬을 기반으로 위험한 시장 폭락과 안전한 “저점 매수” 기회를 구분하는 로직.
-
실시간 자문 UI: 세련되고 완전히 사용자 정의가 가능한 플로팅 대시보드로, 복잡한 수학적 계산을 단순한 영어 지침(예: “조치: 매수 확률 높음”)으로 지속적으로 변환해 줍니다.
MetaQuotes Ltd에서 영어로 번역함.
원본 코드: https://www.mql5.com/en/code/75088
 Trading Performance journal
MetaTrader 5 내에서 완전히 실행되도록 설계된 기관급 거래 일지 및 행동 분석 제품군입니다. 이 애플리케이션은 단일 파일로 구성된, 외부 의존성이 전혀 없는 대시보드 형태로, 표준 터미널 객체를 고성능 더블 버퍼 벡터 그래픽 파이프라인(CCanvas)으로 대체합니다. 이 애플리케이션은 실시간 정량 분석, 행동 기반 리스크 감사, 세로 방향으로 스크롤 가능한 월별 캘린더, 차트에서 직접 인라인 메모 편집이 가능한 대화형 로그 카드를 제공합니다.
ADX Wilder with Bollinger Bands
이 사용자 정의 지표는 ADX 와일더, +DI, -DI 선과 ADX 주선을 기준으로 계산된 볼린저 밴드를 별도의 창에 함께 표시합니다. 이를 통해 트레이더는 ADX 값의 추세 강도와 변동성 범위를 모두 평가할 수 있습니다. 중간 밴드, 상단 밴드, 하단 밴드를 활용하면 ADX의 확장, 수축 및 잠재적인 강세 돌파를 식별할 수 있습니다. 이 지표는 추세 상황을 확인하고, 모멘텀 증가를 파악하며, ADX가 정상 범위를 벗어날 때 이를 감지하는 데 유용합니다. 입력 매개변수를 통해 ADX 기간, 볼린저 밴드 기간, 편차 및 적용 가격 설정을 조정할 수 있습니다.
Volume-Weighted Delta Divergence Oscillator
A normalized order-flow oscillator that estimates buy/sell volume pressure per bar, accumulates it into a rolling delta, and automatically flags regular bullish and bearish divergence against price swings.
Candle Body-to-Wick Pressure Oscillator
Converts the body-to-wick makeup of every candle into a bounded conviction reading, then smooths it into an oscillator that flags buyer/seller pressure and automatically marks divergence against price.