Evgeniy Scherbina / Profilo
- Informazioni
|
12+ anni
esperienza
|
35
prodotti
|
579
versioni demo
|
|
0
lavori
|
0
segnali
|
0
iscritti
|
Amici
1135
Richieste
In uscita
Evgeniy Scherbina
Hi, everyone.
I have finally found my way to the ML library of TensorFlow and mastered the fancy Sparse Categorical Cross Entropy. So now I have a neural network of 64x64x3, which has proved to be a much better performing solution.
I still cannot figure out a way to create a custom function for calculating profits and losses as indicators in the training process. Primarily because those Google geeks are too focused on recognizing images and evaluating the survival rate of the Titanic passengers. So this will be the objective for me to crush in the coming weeks.
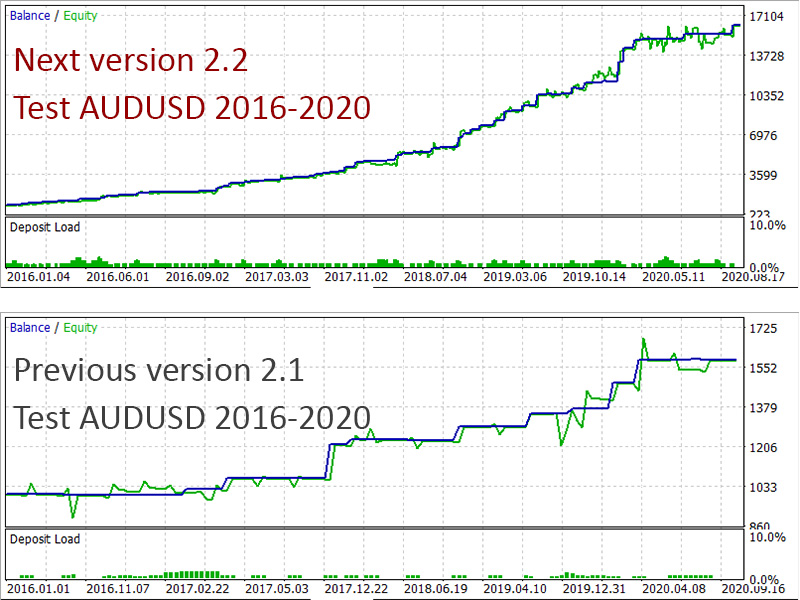
Right now I want to share with you a picture of the AUDUSD test in 2016-2020 with previous version 2.1 and this next version 2.2. As you can see, it is a 10-times difference. And it is only for one symbol. This is the game-changer!!
Oh yes, I forgot to mention. The little disadvantage of this new version 2.2 is that it takes 1 month to train. After 1 week of collecting all data.
So I think I should split the training into 3 parts. I am going to publish this next version 2.2 with only 5 symbols no later than next Monday. Then, a new version will have all 15 symbols. And finally, I will publish another new version with a new indicator ADX by the end of December. So we can all start a new year with totally incredible profits!!
Evgeniy Scherbina
Hi, everyone! I have great news.
The NewsCatcher Visual can be downloaded for FREE until the end of 2020!
Just to remind you that NewsCatcher Visual allows to trade on economic data using an automatic or manual strategy.
Besides, if you download it now, it will be FREE for you forever, including all the future updates.
You may also check out the NewsCatcher Pro which refreshes data 2 times a second, allows to trade on related events, set up individual strategy settings and so much more!
Check them out now in my seller profile!
Evgeniy Scherbina
Hi, everyone. I have finally started publishing the advisors of my brand new strategy for trading on economic events.
The biggest advantage of this new strategy is speed! The advisor can now refresh data 2 times a second and open a trade on the 1st second after data has been released.
I am so excited with this cheap and fast solution that I started a new signal to see how it works for me. I hope I will be able to make it public within a few weeks.
Evgeniy Scherbina
Hi, everyone.
I did more tests.
After 2 months of live trading and humble results, I decided:
1) to add 2 more symbols
2) to remove the RSI indicator.
3) and to add an indicator of my invention. The new indicator measures the ongoing move and puts it against the max move found in the last 6 months. Much better than the RSI.
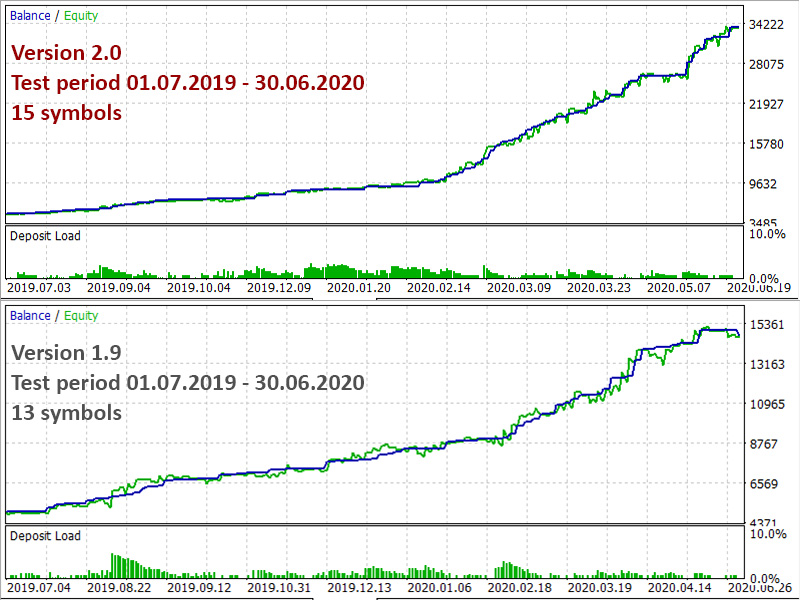
Below are the 2 charts showing a substantial difference. It also showed a better result in the super-test period, the one that starts on July, 1st 2020 and is not part of the training cycle. The version 2.0 should be available next week.
Evgeniy Scherbina
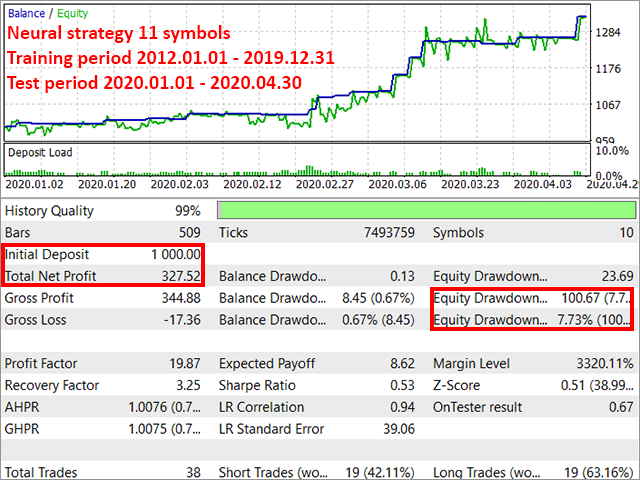
Hi, everyone. Yet another month of testing for the new advisor "Ain't No Trend", and I have found a way to do an 8-year training for 11 symbols! Below is the picture which shows a very accurate trading in the very difficult period of January-April this year. The training period was prior to the test period, that is 2012 through 2019. It has yielded a profit of 32% with the MT5 drawdown of 7.7%. Now, a more accurate drawdown is 6.7%, because we know that the MT5 way to calculate an equity drawdown is incorrect: it shows a "drawdown" from the highest equity reached to the lowest one, while it should be from the highest balance reached to the lowest equity. I will now do another test for September-December 2019, which was a relatively easy trading period. I am very excited with this new very exciting result of my neural strategy!
Evgeniy Scherbina
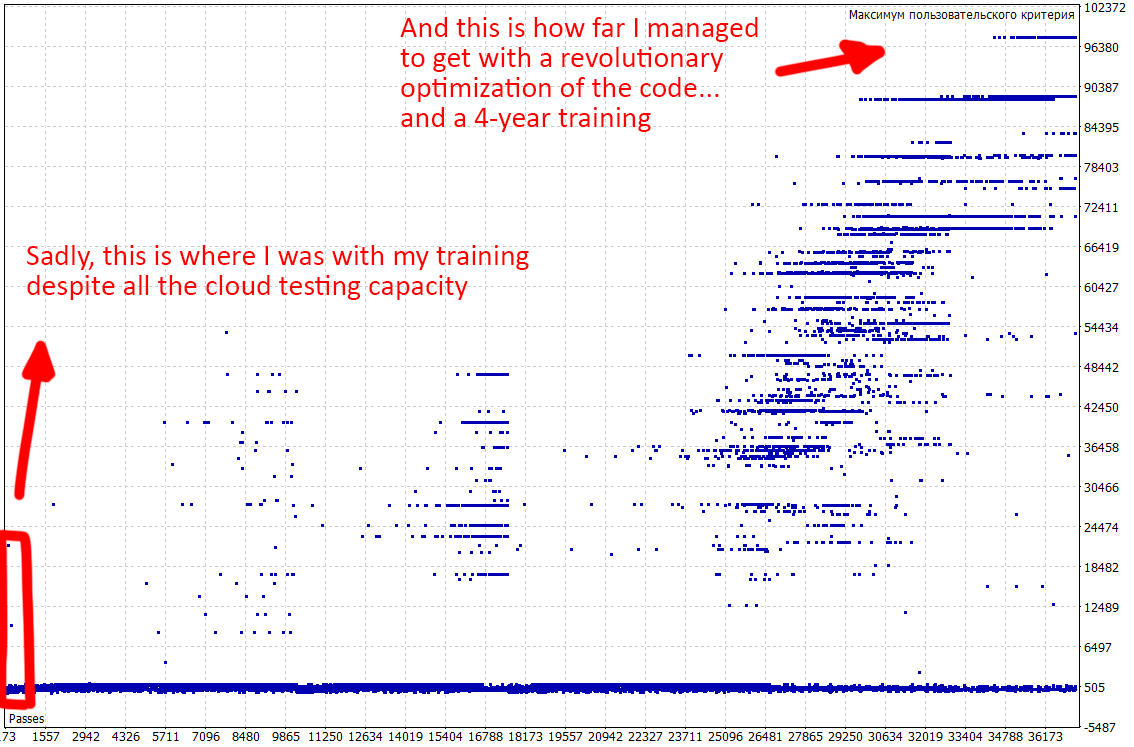
Hi, everyone. This is crazy but I think I have finally found a way to bypass the cloud testing which was inevitable considering the complexity of any neural training.
After which, it became easily possible to do a 4-year training. Below is a picture of 4-year training results. Previously, I was stuck with about 500-1000 test results in the cloud platform. Because it was costly, because it was so long... And then it turned out it didn't have to be so long and I could even avoid cloud testing and do it all on my new powerful PC.
It does not guarantee a profit. Nothing guarantees a profit. But I did tests this way. A 4-year training and then a test of 4 months after the training period. I had 25-40% of profit with a dd 5-6%. I shall now test this kind of training in May-June.
Oh dear, why should I not try a 6-year or even an 8-year training anyway?!
Evgeniy Scherbina
I guess I should tell you about my recent discovery of a serious drawback in the MT5 (MT4) terminal. The historical test report has 2 important sections defining balance and equity fluctuations. It turns out that the equity drawdown is incorrect because it mixes lost profit and a real drawdown. If a lost profit was higher than an equity drawdown for any one trade, you get a percentage of a lost profit and you cannot see the drawdown! Remember: a lost profit is not a loss. A lost profit is when you could get a bigger profit but you did not because the market rolled back in the end. In my tests, I saw big differences. Sometimes, it was 15% of lost profit + drawdown with a real drawdown of less than 6%.
The good news is that you can now get your real drawdown when you do a visual test with my advisors. Like the following picture for the training period of January 2019 - January 2020. Check it in the history log of the tester subterminal for a visual test of the advisor with defaults.
: