MQL5 Wizard para "Dummies" A principios de 2011 lanzamos la primera versión del MQL5 Wizard. Esta nueva aplicación facilita a los traders una herramienta simple y conveniente para generar
Alibaba Will Pay $692M For 35% Stake In Retail Operator Intime Alibaba and Intime said in a press statement that they will develop online-to-offline (O2O) initiatives in order to “provide a more
- В чём заключается основной принцип буддизма? - Подожди, - сказал Суйби. - Когда мы останемся одни, я тебе скажу. Через некоторое время Сэйкэй снова обратился к нему: - Ну вот теперь мы одни, умоляю тебя, объясни. Суйби встал и повёл сгорающего от нетерпения Сэйкея в бамбуковую рощу, но так ничего и не сказал, а когда последний настоятельно потребовал ответа, он шёпотом промолвил: - Какие высокие эти деревья, и какие маленькие те, вон там.
Не ждите совершенства, и не просите и не требуйте его. Любите обычных людей. Нет ничего плохого в обычных людях. Обычные люди — необычны. Каждый человек так уникален. Уважайте эту уникальность.
Kaori Kobayashi Live at Java Jazz Festival 2013 1 England Funk 2 One 3 Little Tune Medley 4 Lovin' U 5 Nothing's Nothing Gonna Change My Love For You 6 Great India 7 City Lights
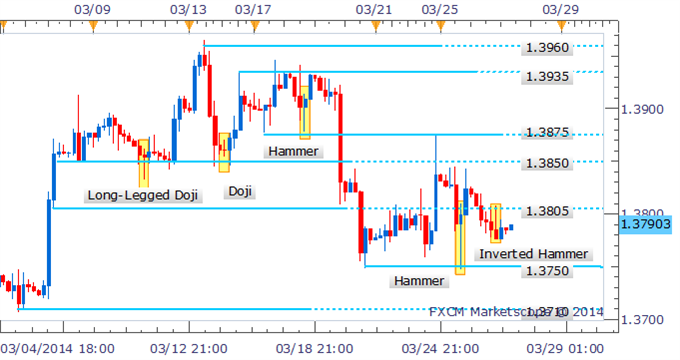
Drilling down to the four hour chart:- an Inverted Hammer formation has warned of an intraday bounce for EUR/USD. However follow-through has been limited, which suggests the signal may have been overlooked by traders given noteworthy resistance at 1.3805 is hanging nearby
Bitcoin Tumbles on Rumors of PBOC’s Order for Accounts Shutdown (based on forexminute article ) Bitcoin prices plummeted nearly 10 percent on Thursday as news filtered in that China’s central bank had
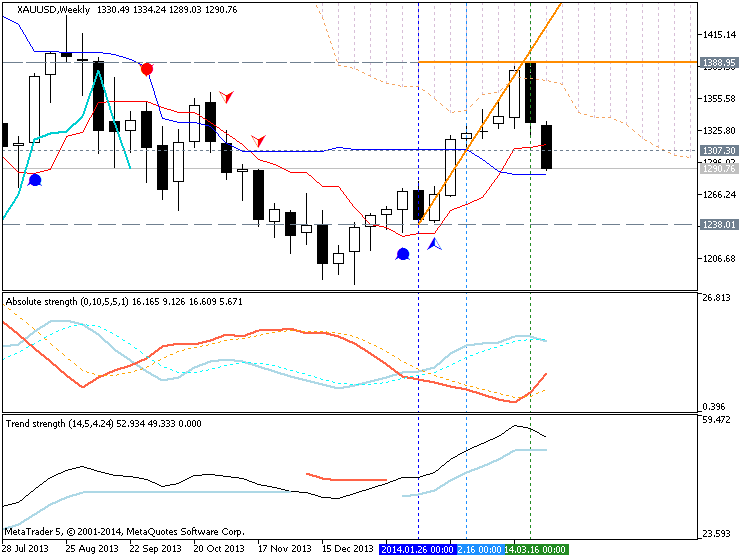
Gold Down Again; Lack of Bullish Fundamental News Keeps Bearish Technicals in Focus Gold prices ended the U.S. day session moderately lower and hit another six-week low Thursday. Prices also fell
Песня на ночь :) ========= 4Minute - южнокорейская группа из пяти участниц, дебютировавшая в 2009 году под лэйблом Cube Entertainment. Участницы: Нам Джихён, Хо Гаюн, Чон Джиюн, Ким Хёна, Квон Сохён
China’s Equities Plummet on Slow Industrial Profit Growth (based on Forexminute article)
Chinese equities plunged, causing the benchmark index to post its biggest loss in 7 days, after benchmark money-market rates surged and industries recorded slower profit growth.
The Shanghai Composite Index fell 0.8 percent to close at 2,046.59. Industrial profits grew at 9.4 percent in January and February, down from 12.2 percent in December. The measure has declined 3.3 percent since January over fears that the economic slowdown will hurt profits and that the resumption of new initial public offerings will siphon away monies.
“We are back to market fundamentals with investors concerned about new IPOs, which might not have been fully priced in already, and soft economic data,” Gerry Alfonso,*a Shanghai-based dealer at Shenyin & Wanguo Securities Co. told Bloomberg. “There is no obvious short-term catalyst for the equity market. The Hang Seng China Enterprises Index grew 0.3 percent, while the CSI 300 Index plunged 0.7 percent to 2,155.71 on Thursday. The ChiNext index also plummeted 3.5 percent.
9 out 10 industry categories in the CSI 300 fell today, with the sub-category of industrial shares tumbling 1.2 percent. Power equipment maker Dongfeng Electric slid 2.6 percent to 12.54 yuan, while wind turbine maker Xinjiang Goldwind fell 3 percent to 9.91 yuan.
However, Shanghai’s trading volumes rose 0.6 percent above the 30-day average on Thursday, valuing it at 7.5 times projected 12-month earnings, which is close the a record trough touched last week. The National Bureau of Statistics revealed the industrial profits were 779.3 billion yuan ($125.4 billion) in the first two months of the year, down from a 17.2 growth recorded in the same period a year earlier. The index of technology stocks fell 2.5 percent, the biggest among the 10 industry categories. Touch screen maker Shenzhen O-film fell 9.8 percent to 43.39 yuan, while Communist Party’s People.cn.CO tumbled 6.6 percent to 71.31 yuan.
ChiNext index touched its lowest point since the start of the year as Huayi Brothers fell 5.3 percent to 24.73 yuan.
MQL5 Cookbook: Monitoring Multiple Time Frames in a Single Window When choosing the direction for opening a position, a price chart with multiple time frames displayed at the same time may be quite
Guia prático do MQL5: Monitoramento de múltiplos períodos de tempo em uma única janela Ao escolher a direção para abertura de uma posição, um gráfico de preço com vários períodos de tempo exibidos no