Trading and training video (from youtube for example) about forex and financial market in general. thread for April - look at this thread , thread for May - look at here , for June is here . July thread is here August thread is this one September
Forbes : As we approach another financial crisis in Washington, a scene that may be repeated next month, many are wondering whether or not they should be invested in stocks.
Dow Industrials
The SPDR Dow Industrials (DIA) opened below the prior week’s lows, which is not a good sign. It is still the weakest of the major averages. It closed the week on next month’s pivot at $152.28, with further support in the $150-$151 area, which includes the 20-week EMA. The weekly starc- band is considerably lower at $144.73.
The Dow Industrials A/D line has declined steadily over the past seven days and has closed well below its flat WMA. The daily OBV has dropped below its WMA, while the weekly is still above its WMA. Therefore, the multiple time frame OBV analysis is now mixed and neither confirmed the new price highs.
There is initial resistance now at $153.50-$154 with the daily starc+ band above $155.
Forbes : As we approach another financial crisis in Washington, a scene that may be repeated next month, many are wondering whether or not they should be invested in stocks.
S&P 500
The 20-week EMA, which was tested in August, is now at $165.34, with the weekly starc- band now at $160.23.
The daily on-balance volume (OBV) dropped below its WMA last week and the WMA has now flattened out. It will be important that the OBV moves strongly above its WMA on any rally this week, since it did confirm the recent highs. The OBV has stronger support at line g. The weekly OBV (not shown) is still above its WMA and did confirm the highs.
The daily S&P 500 A/D line closed the week below its WMA after also confirming the post FOMC price highs. It is still above the support from April and June at line h.
The preliminary monthly pivot for October is at $169.02 with daily resistance now at $170.17. A close above this week’s high at $170.65 would be a short-term positive.
Gold Prices Surge amidst the Federal Government Facing a Shutdown Next Week (source - forexminute.com)
Gold Prices Surge amidst the Federal Government Facing a Shutdown Next Week Gold prices surged and ended up about 1.0 percent on Friday trading. According to investors the surge was due to a possible shutdown of the U.S. government operations next week and the threat of a debt default in mid-October. Spot gold stood 1.14 percent higher at $1,338.95 an ounce by late in the New York session.
The price of $1,338.95 an ounce is just off the one week high set earlier at $1,343.80 an ounce. An increase has also been seen in futures as U.S. gold futures for December delivery were up $14.70 an ounce which is an increase of 1.11 percent, at $1,338.80 an ounce. Silver was also up 0.18 percent at $21.71 an ounce with gold.
Demand of Gold from China
According to the China Gold Association, the country’s gold output was 232.189 tonnes in the first seven months of this year which is an increase of 11.5 percent from the same period of 2012. The association also informed that output in the month of July alone stood at 39.367 tonnes.
U.S. stocks drop as fiscal impasse frays nerves; Dow down 0.46% U.S. stocks fell on Friday as a congressional deadline to pass a spending package and avoid a government shutdown grew closer with
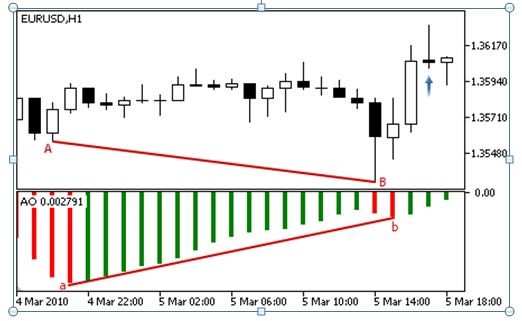
hi; Divergence line on Awesome Oscillator is acceptable: were going through histogramm body OR not?, must have Opposite slope versus Price trend line OR must have Increase/Decrease in slope versus Price trend line ? i work on an
Chinkou Span line is crossing historical price on open bar for D1 timeframe but the price is still above Ichimoku cloud which is indicating possible secondary correction within primary bullish market condition. If the price will break 97.76 support
The Forex week begins Monday morning at 8:00 am in Sydney Australia ( 5:00 PM Sunday eastern standard time; 9:00 PM Greenwich mean time). Think of Sydney as being the start of the Forex day. The Tokyo session opens three hours later. The London session opens 7 hours after that and finally the New York session opens 5 hours later. Each session runs nine hours. So:
Sydney runs from 9:00 PM till 6:00 AM GMT Tokyo runs from 12:00 AM till 9:00 AM GMT London runs from 7:00 AM till 4:00 PM GMT New York runs from 12:00 PM till 9:00 PM GMT NYC is in the Eastern Standard Zone see below
Interview With Al Brooks, Price Action Day Trader Here is a summary of some of the key points: 1. Brooks is a price action trader with 27+ years of experience. 2. He is an active day trader, trading
Stong & Weak: Australian Dollar Weakness in Focus Talking Points : AUDUSD gets rejected at .95 horizontal resistance hinting at future Aussie weakness, US Government spending debate and RBA rate
Forbes : Treasury To Sell More GM Stock, Exit Draws Closer
The U.S. Department of the Treasury will continue to sell shares of General Motors GM -0.62% by launching a third pre-defined written trading plan, the Treasury announced on Thursday morning. At the end of the second defined trading plan, taxpayers held 101.3 million shares of GM stock.
Tim Massad, Treasury Assistant Secretary for Financial Stability, said in a statement that taxpayer investment in GM was a critical part of the government’s response to the financial crisis and that it helped to prevent the collapse of the auto industry, but that the Treasury intends to continue winding down this taxpayer investment. read more here http://www.forbes.com/sites/maggiemcgrath/2013/09/26/treasury-to-sell-more-general-motors-stock/
There are many different ways you can trade stocks online with an online broker. Investment strategies come in all different shapes and forms and can integrate both technical and fundamental analysis together, while some strategies just involve one or the other.
Stock Trading Strategies are in no particular order:
Day Trading Momentum Trading Swing Trading CANSLIM Trading Buy and Hold Penny Stocks Biotechs
7 Strategies for Online Stock Trading There are many different ways you can trade stocks online with an online broker. Investment strategies come in all different shapes and forms and can integrate
Scalpers’ main objective is to extract small quantities of pips (25 to 50) as many times as they can throughout the busiest times of the day. These guys and gals must be in front of a screen all the time, thus they are often called screen junkies. Theylove the excitement of rapid candle reactions. Day traders
Day traders act on their belief of a daily bias to the market derived from pivots, Fibonacci lines or other indicators that retail speculators use to give them peace about a decision. They execute an entry and then close their trade during a single session, finishing the day with either a profit or a loss. These kinds of traders do not hold their trades overnight, as they have often been taught never to do so. Swing traders
Swing traders hold onto trades for several days at a time. These traders refuse to be held captive to a screen, monitoring their charts only momentarily throughout the day. They dedicate their time “in the market” to hours outside the market, performing an analysis every day prior to their trading session decisions. Position traders
Position traders make trades that last for weeks, months, or even years. These traders execute based on trend and manage their trades by adding more positions as the trade blossoms. These men and women analyze the markets and charts based on high time frame charts, making entries based on many factors that for the sake of this article will be defined as numerous, varied, and complex.