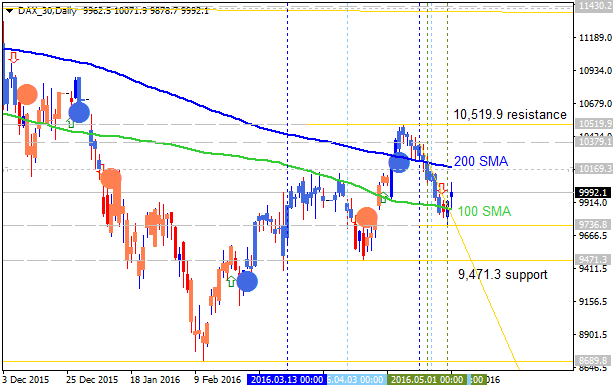
DAX Index Technical Analysis for a week: waiting to break the levels Daily price is located between SMA with period 100 (100 SMA) and SMA with the period 200 (200 SMA) for the ranging market condition
Patterns: inside bar Forum on trading, automated trading systems and testing trading strategies Press review Sergey Golubev , 2018.03.13 06:37 How to Trade Profitably with Inside Bars (based on the
AUD/USD Technical Analysis: 50.0% Fibo level to be crossed to below for the daily bearish reversal to be started (adapted from the article ) Bearish Evening Star candlestick pattern, 50.0% Fibo
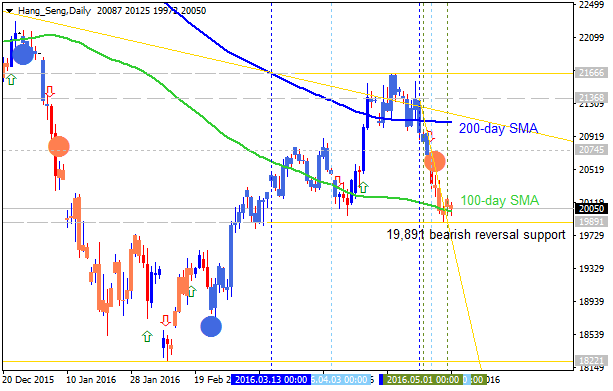
Hang Seng Index Technical Analysis: key support level at 19,891 to be broken for the bearish reversal Daily price is located below 200-day SMA for the 100-day SMA crossing to below with the 19,891
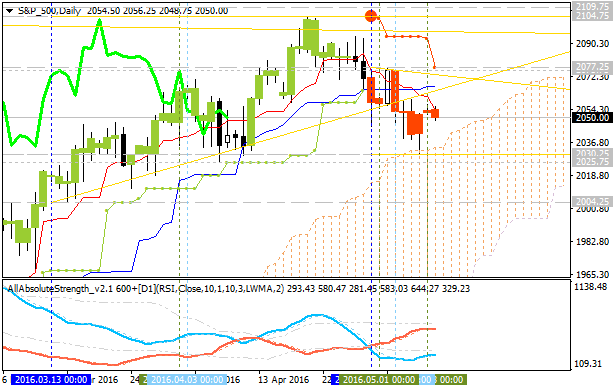
S&P 500 Technical Analysis: bullish ranging breakdown Daily price is on bullish ranging breakdown: the price is on secondary correction by breaking key support levels with the Chinkou Span line which
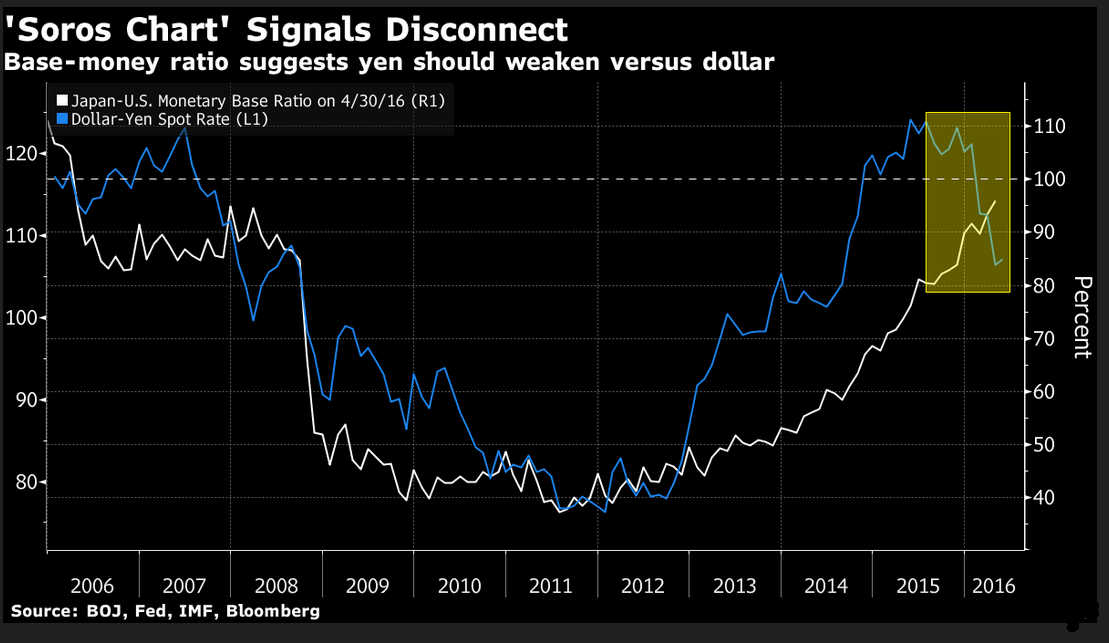
Soros Chart Signals BOJ Bond Buying Already Enough to Weaken Yen (based on the article ) "The Bank of Japan’s bond buying has nearly trebled the monetary base in just over three years to more than 386
Forum on trading, automated trading systems and testing trading strategies Press review Sergey Golubev , 2016.05.07 09:45 Forex Weekly Outlook May 9-13 (based on the article ) Graeme Wheeler’s
China’s forex reserves rise for second month in a row in April to US$3.22 trillion (based on the article ) " The central bank has started to publish forex reserve data measured by Special Drawing
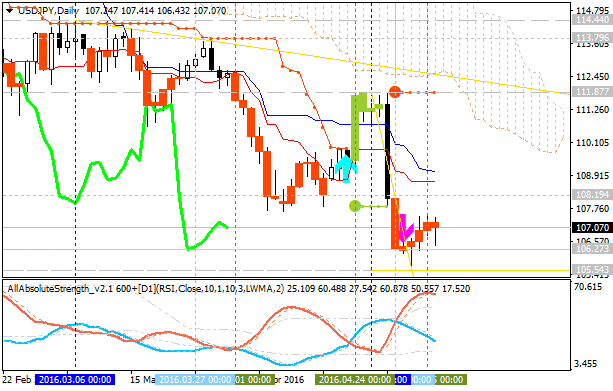
USD/JPY Technical Analysis 2016, 08.05 - 15.05: daily bearish within narrow levels; weekly bearish breakdown; monthly correction; 106.27 is the key The Short-Term situation . Daily price was on the
Week Ahead: Dollar Index Technical Analysis - daily ranging bearish, weekly ranging near reversal; what's next? (based on the article ) " The USD is stuck at the bottom of the so-called ‘dollar
EUR: Gentle Downtrend; AUD: New Targets - Credit Agricole (based on the article ) EUR: " Once again we revise our forecasts for EUR to the upside to account for the recent very disappointing US data
Trading the News: U.S. Non-Farm Payrolls (based on the article ) What’s Expected: Why Is This Event Important: With the U.S. economy approaching ‘full-employment,’ a further improvement in the labor
Crude Oil Forecast: daily bullish reversal, weekly bear market rally (based on the article ) " The Support Zone in focus after Thursday’s blast-off is the Wednesday low at $43.20. Wednesday's low is
Stochastic trading - expert for MetaTrader 4 This is very interesting EA which I found in CodeBase: " The idea of the EA was taken from the different versions of the Dealers_Trader (for which many
What is a Japanese Candlestick in Forex Trading Candlestick charts are the most common chart types used by retail traders and investors. There are other types of charts such as line charts, bar charts
AUD/USD Intra-Day Fundamentals: Australian Trade Balance and 19 pips price movement 2016-05-05 01:30 GMT | [AUD - Trade Balance ] past data is -3.04B, forecast data is -2.90B, actual data is -2.16B
Crude Oil Intra-Day Price Action Analysis - breakdown with the bearish reversal in the near future 2016-05-04 14:30 GMT | [USD - Crude Oil Inventories] past data is 2.0M, forecast data is 0.6M, actual