Glaudes Laurislei Moreira / Profil

- Informations
|
1 année
expérience
|
3
produits
|
57
versions de démo
|
|
0
offres d’emploi
|
0
signaux
|
0
les abonnés
|

Chega de teoria! Vamos falar de prática e de RESULTADOS REAIS E AUDITADOS!
💪 A imagem que vocês veem é o backtest da nossa poderosa combinação: o indicador Tabajara VWAP 📉📈 + os nossos Histogramas Sintéticos!
Olhem o que essa dupla é capaz de fazer no Ouro (XAU/USD)!Prepare-se, porque esses números são de cair o queixo! 😱👇
🏆 Fator de Lucro de 25.50: Isso mesmo, para cada dólar arriscado, o retorno foi mais de 25 vezes maior! Uma performance de elite!
🎯 Taxa de Acerto de 88.89%: De 45 operações realizadas, 40 foram vitoriosas! A precisão dos nossos indicadores é cirúrgica!
🛡️ Rebaixamento (Drawdown) Máximo de apenas 3.25%: O risco foi mínimo! A curva de capital, essa linha azul bonita subindo de forma consistente, é a prova de um crescimento sólido e seguro, sem sustos.
📈 Lucro Líquido de 1020.11: Um resultado espetacular que demonstra a altíssima lucratividade da estratégia em um curto período.
✅ Consistência Absoluta: Tivemos uma média de 7 vitórias consecutivas contra apenas 1 derrota por vez. Ganhamos mais e perdemos muito pouco!
💰 Lucro Bruto vs. Perda Bruta: Geramos 1061.75 de lucro e tivemos uma perda de apenas 41.64. A matemática não mente!
Esses números são a prova viva de que a nossa estratégia funciona! A clareza do Tabajara VWAP para mostrar a tendência, combinada com a precisão dos nossos histogramas para o momento exato da entrada, cria uma verdadeira máquina de resultados! 🤩

Resultados Excepcionais no Ouro (XAU/USD) Demonstram a Eficácia de um Setup Inovador de Três Indicadores, Acessível a Todos os Traders na Plataforma MT5. 📈
Operar em timeframes curtos no mercado de Ouro (XAU/USD) é um desafio que exige precisão, rapidez e uma estratégia robusta. 🎯 Para os traders que buscam uma vantagem competitiva, apresentamos uma abordagem de trading de alta performance, baseada em um conjunto de três indicadores que, quando combinados, oferecem sinais de entrada e saída com notável clareza. Os resultados falam por si: um lucro líquido expressivo, um fator de lucro incrível e uma taxa de acerto impressionante. ✔️
Este artigo detalha a metodologia por trás desses números expressivos, um setup que pode ser implementado por qualquer trader no MetaTrader, utilizando um indicador principal gratuito e amplamente reconhecido, em conjunto com dois osciladores de histograma que refinam o timing das operações.
A Base da Estratégia: O Indicador "Tabajara VWAP Ogro RSJ" 💡
O pilar da nossa estratégia é o renomado indicador "Tabajara VWAP Ogro RSJ", uma criação do trader brasileiro André Machado, conhecido como "O Ogro de Wall Street". Este indicador, disponível gratuitamente na comunidade MQL, é projetado para identificar a tendência predominante do preço de forma visual e intuitiva. Ele utiliza a VWAP (Média de Preço Ponderada pelo Volume) e uma média móvel para colorir os candles, sinalizando a direção da força do mercado.
As cores dos candles, segundo a lógica do Tabajara, guiam o trader sobre qual tipo de operação procurar:
Verde: Preço subindo em tendência de alta (procurar por compras). 🟢
Vermelho: Preço caindo em tendência de baixa (procurar por vendas). 🔴
Preto e Branco: Correções dentro das tendências, indicando possíveis pontos de entrada a favor da tendência principal. ⚫⚪
No gráfico de operações, a linha azul mais espessa representa a VWAP ou uma média móvel de longo prazo, servindo como uma referência dinâmica de suporte ou resistência, um verdadeiro "divisor de águas" para o preço.
O Momento Certo: A Confirmação com Histogramas Sintéticos 🎯
Para refinar os sinais e identificar o momento exato de entrada, a estratégia incorpora dois indicadores de histograma. Esses osciladores medem o momentum e a força do mercado. A lógica é simples e eficaz:
Sinal de Compra: O histograma cruza para o campo positivo (acima da linha zero), geralmente exibindo barras verdes, indicando que a força compradora está no controle. A entrada é confirmada quando este sinal está alinhado com a tendência de alta apontada pelo "Tabajara VWAP Ogro RSJ". ✅
Sinal de Venda: O histograma cruza para o campo negativo (abaixo da linha zero), com barras vermelhas, sinalizando o domínio da força vendedora. A venda é executada quando a tendência de baixa é confirmada pelo indicador principal. ✅
A beleza deste sistema está na confluência dos sinais. O "Tabajara VWAP" estabelece o contexto da tendência, enquanto os histogramas atuam como o gatilho, indicando o timing preciso para entrar na operação, minimizando entradas falsas e maximizando o potencial de lucro. 💰
Análise dos Resultados: A Prova da Eficácia 🏆
O relatório de performance apresentado demonstra a robustez da estratégia em um ambiente real de mercado. Com um capital inicial, o sistema gerou um lucro expressivo, mais do que triplicando o saldo inicial.
Destaques da Performance:
Fator de Lucro Excepcional: Um indicador incrível que mostra que o lucro bruto foi muito maior que a perda bruta. 💪
Taxa de Acerto Elevada: Com uma porcentagem altíssima de trades lucrativos tanto em operações de venda quanto de compra. 🎯
Drawdown Mínimo: O rebaixamento máximo da conta foi extremamente baixo, indicando um controle de risco eficiente e uma curva de capital suave e ascendente, como pode ser visto no gráfico de balanço. 📉➡️📈
Consistência: A média de ganhos consecutivos foi notável, com um ganho máximo consecutivo expressivo, enquanto a perda média foi significativamente menor. ⚖️
Conclusão: Uma Estratégia Acessível e Lucrativa ✨
A combinação do indicador de tendência "Tabajara VWAP Ogro RSJ" com a precisão dos osciladores de histograma sintético prova ser uma metodologia poderosa para operar Ouro em timeframes curtos. Os resultados expressivos, com alta lucratividade e baixo risco, validam esta abordagem como uma ferramenta valiosa para traders que buscam consistência.
Convidamos toda a comunidade MQL5 a explorar este setup! 🚀 O indicador principal você já pode baixar gratuitamente. E agora, a grande novidade: os indicadores de histograma sintético, o segredo por trás dos gatilhos precisos, estão em fase final de testes para garantir a máxima performance! 🧪
Fiquem ligados, pois em breve eles serão lançados com exclusividade aqui no nosso perfil! Acompanhe e fique de olho no lançamento! 👀📣
Enquanto isso, teste a base da estratégia em sua conta demo, ajuste os parâmetros ao seu estilo operacional e prepare-se para surfar as ondas do mercado de Ouro com total confiança e eficácia! 🌊🏄♂️
One of the most effective ways to use EasyTrend to set your stop loss is by utilizing the "steps" that the indicator line itself forms. As you can see in the example image I sent, the strategy is quite visual and intuitive: 👁️🗨️
In an uptrend (blue line): 📈 The ideal approach is to place the stop loss slightly below the beginning of each new horizontal "step" that the blue line forms. When the price moves up and the indicator creates a new, higher plateau, you can move your stop loss up to this new level. This technique is known as a manual "trailing stop" and helps protect the profits you've already made 💰 while giving the price room to continue its upward move. 🚀
In a downtrend (red line): 📉 The process is the same but in reverse. You would place the stop loss slightly above the most recent step of the red line.
This approach helps prevent you from being stopped out by minor price corrections (market noise) 🔇, keeping you in the main trend for longer.
✅ Oscillator Recommendation for Confirmation
To confirm the trend signals from EasyTrend, using an oscillator is great practice. Oscillators help measure the "momentum" (strength 💪) of the price movement and identify potential points of market exhaustion.
Two of the most popular and effective options are: 👇
💡 Relative Strength Index (RSI): This is one of the most well-known oscillators. It can be used to confirm the strength of the trend. For example, in an uptrend indicated by EasyTrend's blue line, you would look for the RSI to remain, preferably, above the 50 level, confirming bullish strength. Overbought (above 70) or oversold (below 30) signals can also alert you to possible corrections or reversals.
⚙️ Stochastic Oscillator: This indicator is excellent for identifying entry and exit points. It compares the current closing price to its price range over a period. In an uptrend, for instance, a crossover of the Stochastic lines in the oversold zone (below 20) can be a good signal to confirm a buy entry aligned with EasyTrend.
❗️ Important: The choice of oscillator and its settings may vary according to your trading style and the timeframe you use. I recommend testing both on a demo account 💻 to see which one best fits your strategy.
I hope this explanation helps further enhance your use of the EasyTrend Gold indicator.
🚀 Take Your Gold Scalping to the Next Level!
If you enjoy the clarity of EasyTrend and are looking to specialize in high-frequency Gold scalping ⚡ on the M1 chart, I'd like to introduce you to my advanced tool: Multisignal Divergence Gold M1 Scalper Pro 🏆.
📝 Quick Summary:
The Multisignal Divergence Gold M1 Scalper Pro is an advanced trading engine 🤖 specifically designed for the volatile M1 Gold (XAUUSD) market 🪙. It addresses the core challenges of scalping—speed, precision, and filtering out false signals. The indicator combines multiple layers of analysis to generate high-probability entry signals. Its core features include a multi-oscillator divergence engine (using RSI, MACD, Stochastic, etc.) to spot powerful reversals 🔄, an ADX trend filter 🚦 to ensure you trade with momentum, and CCI logic 🎯 to identify overbought/oversold extremes. All this information is presented in a clear on-screen panel 📊, with precise Buy/Sell arrows 🔼🔽 and "Attention" alerts 🔔, ensuring you never miss a critical setup.
This tool is designed for traders who need a robust, multi-confirmation system to trade with confidence 😎 in the fast-paced M1 environment.
You can learn more about it here: 👉 https://www.mql5.com/en/market/product/141856
Happy trading and much success! ✨

While Buy (🔵) and Sell (🔴) signals are crucial for entering confirmed moves, true scalping mastery often lies in how we interpret the market's moments of indecision. This is precisely where the Attention Alert Signal (Yellow Arrow ⚠️), one of the most distinctive features of the Multisignal Divergence Gold M1 Scalper Pro, becomes an indispensable tool.Let's take a deep dive into how this signal can transform your approach and refine your trading decisions.
Decoding the Yellow Arrow: What Does It Really Mean? 🕵️♂️The Yellow Arrow is not a direct entry signal, but rather a market intelligence alert. It appears under a very specific and powerful condition:The CCI oscillator reaches an extreme level (overbought or oversold), indicating that the price has stretched significantly.BUT, the ADX is low, signaling that there is no strong trend in place. The market is either sideways or the momentum of the previous trend is fading.
This combination is a critical alert that the current market situation is fragile and may be about to change.
Why is the Yellow Arrow So Important? 🧠
Early Warning of Potential Reversals 🔄
In consolidating or ranging markets, a Yellow Arrow at the top (overbought) or bottom (oversold) of a price range is often the first warning that the price is about to revert to the mean or to the other side of the consolidation. It prepares you for a potential reversal trade before the crowd notices.
Identification of Trend Exhaustion 📉Imagine the price is in a slight uptrend, and a Yellow Arrow appears. This doesn't necessarily mean "sell now," but rather "be careful, the buying pressure is weakening." The momentum that was driving the price up is fading. This gives you the chance to tighten your stops, take partial profits, or prepare for a potential break of the trendline.
Context for Future Trend Signals 📊An Attention Alert Yellow Arrow can be the precursor to a major move. For example: if an oversold Yellow Arrow appears, indicating selling weakness, and soon after, the price breaks a resistance level with the ADX starting to rise, a subsequent Buy Signal (Blue Arrow 🔵) becomes much stronger and more reliable. The Yellow Arrow provided the initial context.How to Use the Yellow Arrow to Your Advantage: Practical Strategies
✅ Strategy 1: Scalping in ConsolidationWhen the indicator's panel shows a "RANGING" market, look for Yellow Arrows near known support and resistance levels. A Yellow Arrow at support can be an excellent trigger for a quick buy, targeting the middle or the top of the range.
🛑 Strategy 2: The "Do Not Trade the Trend" WarningIf you are a trend-following trader, the Yellow Arrow is your signal to stay out or proceed with extreme caution. It informs you that the conditions for a trend trade are not ideal. Ignoring this warning is like trying to sail a boat with no wind.
⚡ Strategy 3: Preparing for BreakoutsAfter a Yellow Arrow appears, pay close attention to the price action. If the price was in a range and an overbought Yellow Arrow appeared at the top, watch carefully. If the price, instead of reversing, breaks through that resistance with force, it could be the ignition of a powerful new uptrend. The Yellow Arrow put you on high alert to watch for the decisive moment.
ConclusionThe Yellow Arrow transforms the Multisignal Divergence Gold M1 Scalper Pro from a simple signal indicator into a sophisticated market-reading system. It offers a layer of analysis that keeps you one step ahead by warning of weakness, preparing you for reversals, and validating the strength of future moves. Mastering the interpretation of this signal is to master the context, and in scalping, context is everything.
Have Questions or Need Support? 🤔For any clarifications on parameters, features, or the best way to use the Multisignal Divergence Gold M1 Scalper Pro, please contact us directly through the MQL5 chat. We are here to help!Contact Us: https://www.mql5.com/en/users/algocoderfx/messages 📬
🏷️ https://www.mql5.com/pt/market/product/141856

Decodificando a Seta Amarela: O Que Ela Realmente Significa?A Seta Amarela não é um sinal de entrada direto, mas sim um alerta de inteligência de mercado. Ela aparece sob uma condição muito específica e poderosa:O oscilador CCI atinge um nível extremo (sobrecompra ou sobrevenda), indicando que o preço se esticou significativamente.
MAS, o ADX está baixo, sinalizando que não há uma tendência forte em vigor. O mercado está lateralizado ou o momentum da tendência anterior está se esgotando.Esta combinação é um alerta crítico de que a situação atual do mercado é frágil e pode estar prestes a mudar.
Por Que a Seta Amarela é Tão Importante? 🧠Alerta Antecipado de Reversão Potencial 🔄Em mercados consolidados ou em range, uma Seta Amarela no topo (sobrecompra) ou no fundo (sobrevenda) de uma faixa de preço é frequentemente o primeiro aviso de que o preço está prestes a reverter em direção à média ou ao outro lado da consolidação. Ela te prepara para uma possível operação de reversão antes que a multidão perceba.
Identificação de Exaustão de Tendência 📉Imagine que o preço está em uma leve tendência de alta. Uma Seta Amarela aparece. Isso não significa necessariamente "venda agora", mas sim "cuidado, a força compradora está diminuindo". A pressão que impulsionava o preço está enfraquecendo. Isso lhe dá a chance de apertar seus stops, realizar lucros parciais ou se preparar para uma possível quebra da linha de tendência.
Contexto para Futuros Sinais de Tendência 📊Um Sinal de Alerta Amarelo pode ser o precursor de um grande movimento. Por exemplo: se uma Seta Amarela de sobrevenda aparece, indicando fraqueza vendedora, e logo depois o preço rompe uma resistência com o ADX começando a subir, um Sinal de Compra (Seta Azul 🔵) subsequente se torna muito mais forte e confiável. A Seta Amarela forneceu o contexto inicial.
Como Usar a Seta Amarela a Seu Favor: Estratégias Práticas✅ Estratégia 1: Scalping em ConsolidaçãoQuando o painel do indicador mostrar um mercado "LATERAL" (RANGING), procure por Setas Amarelas perto de níveis de suporte e resistência conhecidos. Uma Seta Amarela em um suporte pode ser um ótimo gatilho para uma compra rápida, visando o meio ou o topo do range.
🛑 Estratégia 2: O Aviso de "Não Opere a Tendência"Se você é um trader que busca seguir tendências, a Seta Amarela é seu sinal para ficar de fora ou ter máxima cautela. Ela informa que as condições para uma operação de tendência não são ideais. Ignorar este aviso é como tentar navegar um barco a vela sem vento.
⚡ Estratégia 3: Preparação para Breakouts (Rompimentos)Após o aparecimento de uma Seta Amarela, fique atento à ação do preço. Se o preço estava em um range e uma Seta Amarela de sobrecompra apareceu no topo, observe. Se o preço, em vez de reverter, romper essa resistência com força, pode ser o sinal de ignição de uma nova e poderosa tendência de alta. A Seta Amarela te colocou em estado de alerta para observar o momento decisivo.
ConclusãoA Seta Amarela transforma o Multisignal Divergence Gold M1 Scalper Pro de um simples indicador de sinais em um sofisticado sistema de leitura de mercado. Ela oferece uma camada de análise que o mantém um passo à frente, alertando sobre a fraqueza, preparando para reversões e validando a força de futuros movimentos. Dominar a interpretação deste sinal é dominar o contexto, e no scalping, contexto é tudo.Tem Dúvidas ou Precisa de Suporte? 🤔
Para qualquer esclarecimento sobre os parâmetros, funcionalidades ou a melhor forma de utilizar o Multisignal Divergence Gold M1 Scalper Pro, entre em contato diretamente conosco através do chat do MQL5. Estamos à disposição para ajudar!Fale Conosco: https://www.mql5.com/pt/users/algocoderfx/messages 📬
🏷️ https://www.mql5.com/pt/market/product/141856

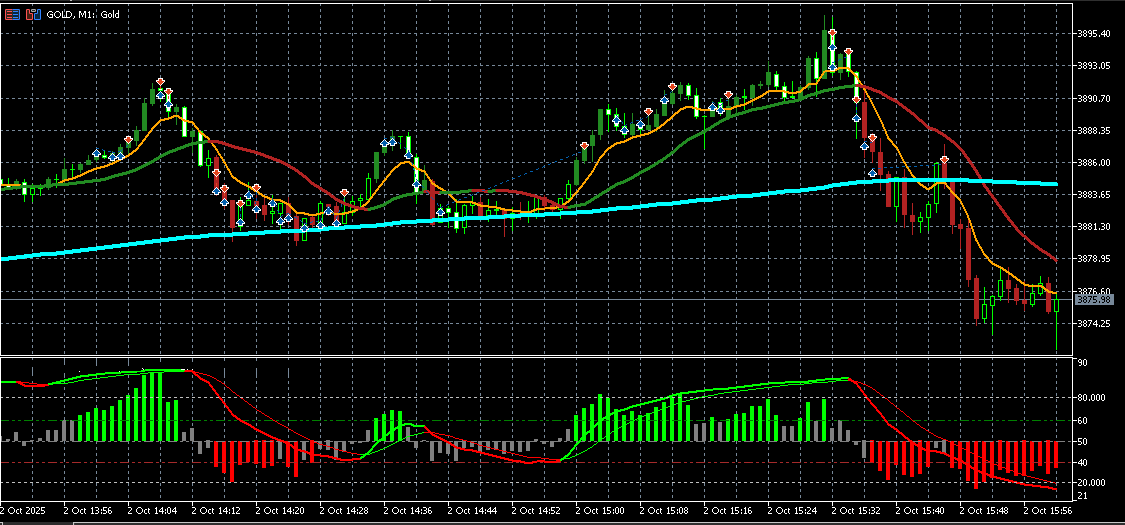
Trade Context: Volatility Meets Precision 🎯The attached chart captures the essence of the Gold scalping challenge: dizzying moves that demand swift entries and exits. The analyzed session resulted in an impressive profit of $1,242.50 💰, validating the effectiveness of this approach.Let's break down the sequence of events and how the indicator interpreted the price action:
1. Identifying and Entering the Downtrend (Sell Signals - Red Arrow 🔴)The Scene: At the very beginning of the period, the market showed strong bearish momentum. For many traders, entering such a fast-moving market can be intimidating due to the risk of a sudden reversal.Indicator's Action: The Multisignal Divergence Pro was crucial at this moment. As the price accelerated downwards, the indicator generated multiple Sell Signals (Red Arrows 🔴). These signals were not random; they represented a confluence of factors:
The ADX trend filter likely confirmed that the move's strength was genuine, validating a trade in the direction of the trend.The internal oscillator engine, including the CCI, signaled overbought conditions or bearish crossovers, providing the entry trigger.The Result: By following the red arrows, a series of sell trades were executed, perfectly positioning the trader to profit from the steep decline, as can be verified in the trade history.
2. The Turning Point: Detecting Bullish Divergence (MACD Bullish 📈)The Scene: After the strong fall, the price began showing signs of exhaustion. It formed a new low, but the momentum was no longer keeping pace. This is a critical point where many traders get stopped out or lose their accumulated profits.Indicator's Action: Here lies one of the indicator's greatest strengths. The information panel and the lines on the chart clearly identified a "MACD BULLISH DIVERGENCE". This means that while the price was making a lower low, the MACD oscillator was making a higher low.Strategic Importance: This is one of the most reliable signs that selling pressure is waning and a reversal or, at the very least, a consolidation is imminent. The indicator provided an early warning, allowing the trader to:
Secure profits from the sell trades. ✅Prepare for a potential buying opportunity. 💡
3. The Reversal Confirmation and Buy Entry (Buy Signal - Blue Arrow 🔵)The Scene: With the bullish divergence signaling a potential change in direction, the strategy shifted from selling to looking for a buy entry point.Indicator's Action: Following the divergence signal, the indicator generated a Buy Signal (Blue Arrow 🔵). This signal confirmed that the conditions for a buy entry were aligned, likely with the CCI moving out of an oversold zone and other confirming factors.The Result: A buy trade was executed, capitalizing on the beginning of the price recovery that followed the exhaustion of the downtrend.
Analysis Conclusion 🏆This trading session is a clear demonstration of the robust capabilities of the Multisignal Divergence Gold M1 Scalper Pro. It is not just an arrow generator, but a complete analysis system that:Confirms the Trend: Enters strong moves with a high probability of success using the ADX filter.Anticipates Reversals: Identifies market exhaustion through its powerful multi-oscillator divergence engine.Provides Precise Triggers: Generates clear buy and sell signals based on a confluence of technical factors.Keeps the Trader Informed: The dynamic panel offers an instant snapshot of the market state (Trend, CCI, ADX, ATR).
The strategy of trading the opening, combined with the precision of the signals, proved to be highly effective. The indicator filtered the noise, identified the primary selling opportunity, warned of its end, and signaled the reversal point, enabling a profitable performance in a challenging environment.The Multisignal Divergence Gold M1 Scalper Pro is designed to be your strategic partner, bringing clarity and confidence to your Gold scalping operations.
Have Questions or Need Support? 🤔For any clarifications on parameters, features, or the best way to use the Multisignal Divergence Gold M1 Scalper Pro, please contact us directly through the MQL5 chat. We are here to help!Contact Us: https://www.mql5.com/en/users/algocoderfx/messages 📬
🏷️ https://www.mql5.com/pt/market/product/141856

🏷️ https://www.mql5.com/pt/market/product/141856

Tired of confusing indicators, especially when trading the volatile Gold market? EasyTrend Gold MT5 is designed to tame Gold's volatility on any timeframe . It harnesses the power of ATR to translate Gold's sharp movements into a single, clear, and dynamic trend line that cuts through the noise. Whether you are scalping on M1 or swing trading on H4, you can visualize the trend's direction and strength, easily identify consolidation periods, and gain an intuitive insight into when
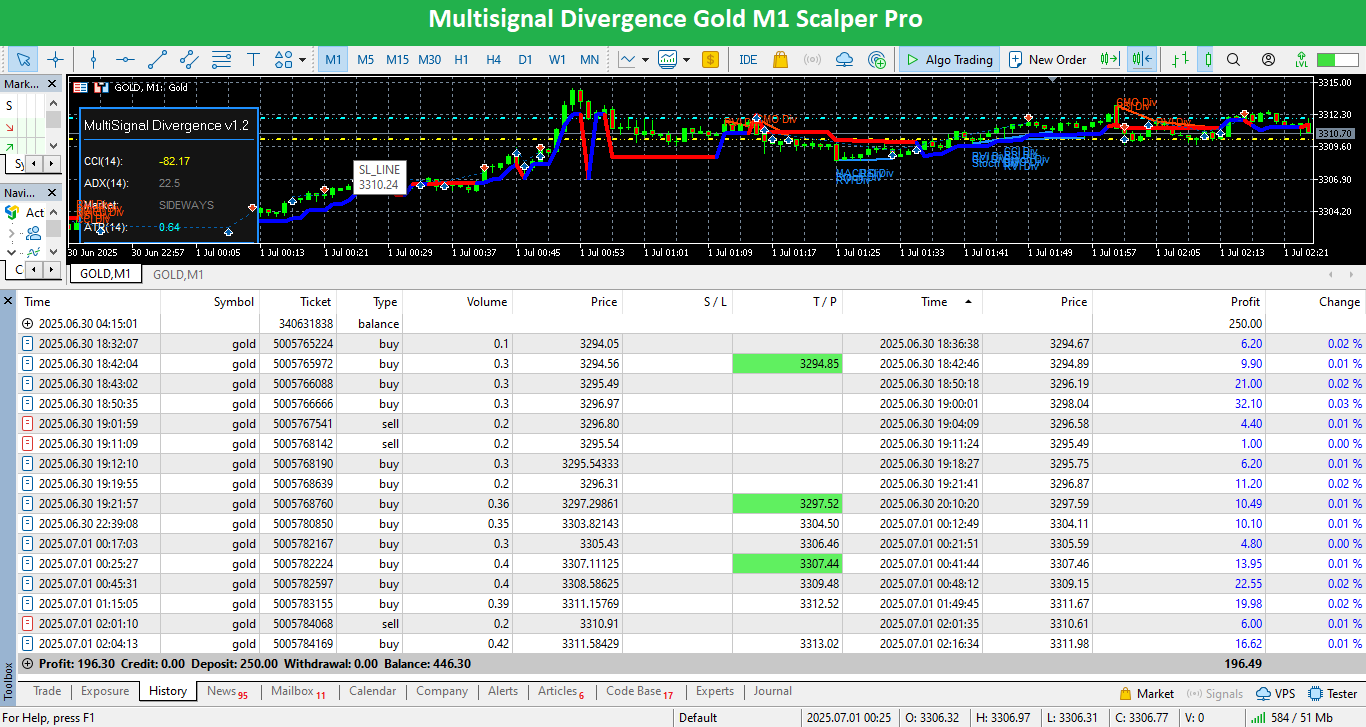
Achieving consistency in the volatile Gold M1 market is the ultimate challenge for any scalper.
Today, I'm not just sharing a theory, but a practical, auditable result: we turned a 250 account∗∗into∗∗ 446.30, generating a $196.30 net profit with a 100% win rate ✅ across all manual trades.
How was this possible?
The answer lies in discipline and the use of an advanced trading tool: the Multisignal Divergence Gold M1 Scalper Pro indicator, in confluence with Easytrend.
This isn't just another arrow indicator. It's a trading engine designed to filter out the M1 noise and deliver high-probability signals based on multiple layers of confirmation.
🎯 The Logic Behind the Surgical Precision
Every signal on the chart was the result of a robust, automated analysis:
Divergence Engine: The indicator uses a suite of oscillators (RSI, MACD, Stoch, etc.) to identify hidden and classic divergences—the backbone of any high-quality reversal.
ADX Trend Filter: The main Buy (Blue Arrow) and Sell (Red Arrow) signals are only confirmed if the ADX indicates sufficient trend strength, eliminating entries in weak or indecisive markets.
CCI Primary Trigger: The Commodity Channel Index (CCI) acts as the primary trigger, identifying the overbought and oversold extremes that initiate the analysis.
💡 Strategic Advantage: The Alert Signal (Yellow Arrow) 🚨
One of the most powerful features is the Alert Signal (Yellow Arrow). It appears when the CCI reaches an extreme, but the ADX shows that the market is sideways or losing steam. In our trading session, we used this signal to:
➡️ Anticipate reversals in consolidations, allowing for high-precision scalping entries.
➡️ Identify exhaustion points, warning us not to enter a trend that is dying out.
➡️ Prepare for breakouts, waiting for confirmation after the alert.
It was by following this logic—waiting for the Blue Arrow to buy, the Red Arrow to sell, and paying crucial attention to the Yellow Arrow—that we achieved these impeccable results.
The Multisignal Divergence Gold M1 Scalper Pro was the core tool behind this performance.
It is now available on the MQL5 Market for testing and purchase:
https://www.mql5.com/en/market/product/141856
Stay tuned! The Easytrend indicator, used for visual trend confirmation, will be launched soon and made available for FREE! 🎁
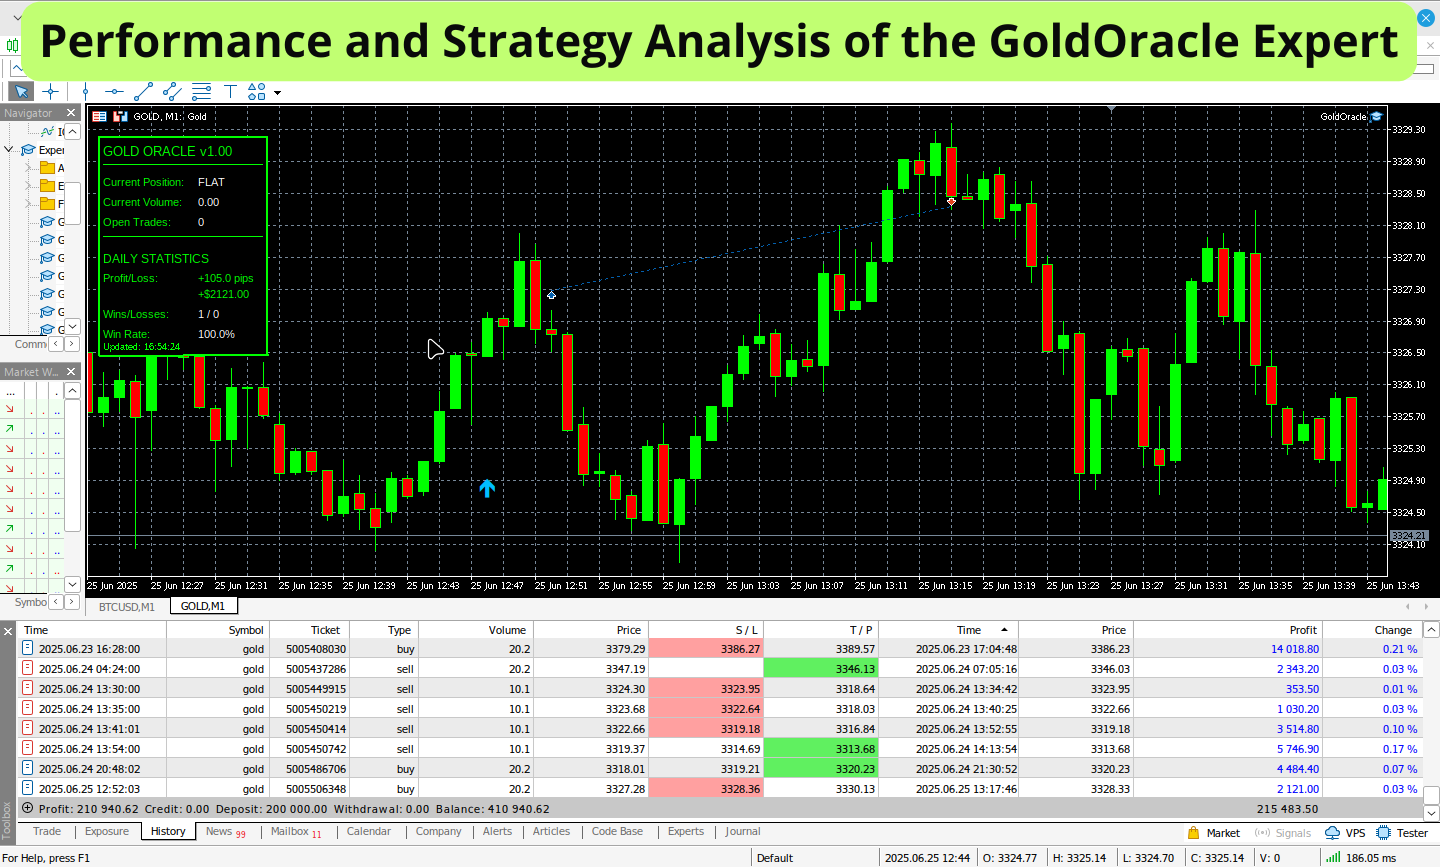
The GoldOracle Expert Advisor for MetaTrader 5 represents a sophisticated automated trading solution, meticulously developed and optimized for the GOLD (XAUUSD) asset on the M1 timeframe.
The observed performance, with a profit of $210,940.62 USD on an initial deposit of 200,000.00USD(totalbalanceof∗∗ 410,940.62 USD**) since 05/29/2025, highlights the strategy's power and, fundamentally, the effectiveness of its adaptive risk management system. 💡
Core Strategy and Differentiators:
The GoldOracle is not based on a simplistic approach. Its architecture is built on robust pillars:
🎯 High-Probability Entries: It utilizes a confluence of multiple indicators to identify trading opportunities, seeking favorable buy or sell setups. The option to align with the long-term trend adds a layer of directional filtering.
🛡️ Adaptive Structural Stop Loss: This is a crucial differentiator. Instead of a fixed Stop Loss, the EA calculates the SL based on recent market structure (significant tops/bottoms). This allows the robot to dynamically adjust to volatility, protecting capital more intelligently against adverse movements.
⏳ Proprietary Time Filter (Session Management): A result of extensive analysis (backtests from 2013-2025), this filter prevents the opening of new positions during specific time windows (UTC) historically identified as having higher risk or unfavorable volatility for the strategy on Gold. It focuses operations on periods with a better historical risk/return ratio, contributing to a smoother equity curve.
⚖️ Adaptive Dynamic Lot (Risk Management per Period): An additional layer of protection and optimization. The EA can be configured to automatically use a reduced lot size during specific sub-periods within the allowed operational windows that might still carry higher residual risk. In moments of lower historical risk, it reverts to the standard lot. This feature is vital for drawdown reduction.
⚙️ Extensive Configurability and Optimization: The EA offers a vast array of customizable parameters, from general account settings, risk management (maximum SL, structural, ATR), profit targets (dynamic TP), multiple entry trigger systems (MACD, MA Crossover, CCI, ADX), filters (Volume, MA Direction, M1 RSI), a scoring system for signals, to advanced operational controls and an overbought/oversold (OBS) closing system. The new "Trailing Stop Safety Margin" functionality demonstrates an ongoing commitment to robust execution.
Relevance of Recent Updates:
📝 It is important to highlight the recent code adjustments in the EA to comply with MQL5 platform guidelines. Although the essence of the adaptive strategy and core logic remain unchanged, the provision of a new, optimized .set file is fundamental to ensure users can perform consistent backtests and obtain results aligned with the current version of the robot.
Professional Conclusion:
The GoldOracle transcends the definition of a simple trading robot. It positions itself as an advanced tool that combines a discerning entry strategy with a multifaceted and profoundly adaptive risk management system. Features like the Adaptive Structural Stop Loss, Proprietary Time Filter, and Adaptive Dynamic Lot are a testament to a design that prioritizes not only profitability but also consistency and long-term capital preservation. 🌟
The impressive financial results observed are a direct reflection of this sophisticated approach. The ability to adapt to different market conditions and the focus on risk mitigation are, without doubt, the pillars supporting GoldOracle's success. Its continuous evolution, such as the MQL5 adjustments and new functionalities, reinforces its potential as a cutting-edge solution for automated Gold trading.
🏷️ Check it out via the link:https://www.mql5.com/pt/market/product/140615
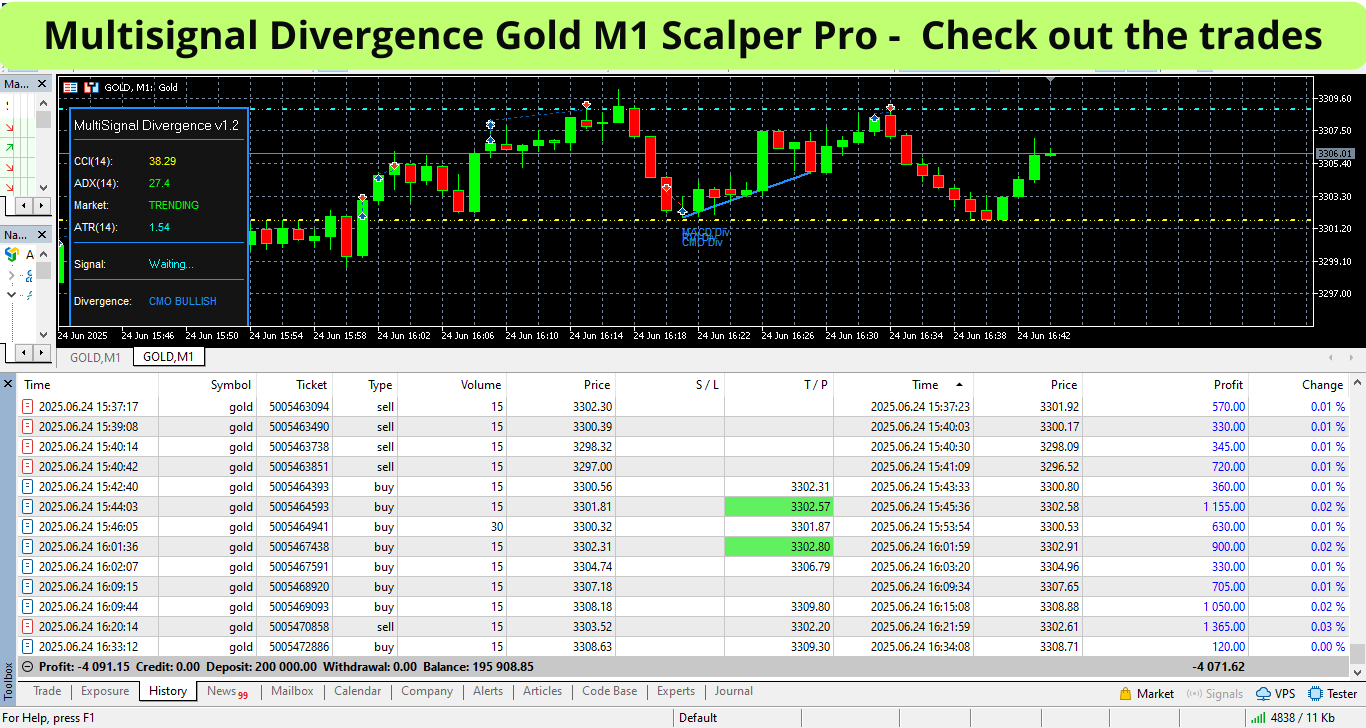
In this video, we dive deep into a LIVE scalping session on the XAUUSD (Gold) pair on the M1 timeframe, using the powerful Multisignal Divergence Gold M1 Scalper Pro indicator.
Get ready to see how this advanced tool identifies high-precision entries, filtering out market noise and focusing on robust confluences to maximize your scalping profits!
Check out the indicator in action with today's operations:
▶️ https://www.youtube.com/watch?v=bM1MMm5uBKc
📊 IN THIS VIDEO YOU WILL SEE:
- A DETAILED analysis of a sequence of REAL trades on Gold M1.
- How the indicator identified multiple winning entries, resulting in a spectacular profit of $7,580 DOLLARS!
- The incredible 100% WIN RATE in this specific session with 13 trades closed in profit.
- The explanation of Buy signals (Blue Arrow 🔵), Sell (Red Arrow 🔴), and the crucial "Attention Alert" (Yellow Arrow 🟡) in action.
- How the information panel with CCI, ADX, ATR, and divergence status helps in QUICK and EFFECTIVE decision-making.
- A tour of the indicator's official sales page on MQL5, showing how you can get yours and test the FREE DEMO version.
✨ WHY IS THE MULTISIGNAL DIVERGENCE GOLD M1 SCALPER PRO DIFFERENT?
This isn't just another indicator. It's an advanced trading engine, meticulously designed for the challenges of Gold M1 scalping:
- Multi-Oscillator Divergence Engine: Uses RSI, MACD, Stochastic, RVI, CCI, and the integrated CMO to identify high-probability divergences – the backbone of reversal signals. In the video, you'll see "MACD DIV" and "CMO DIV" driving profits!
- ADX Trend Filter: Ensures signals occur in line with an established trend strength, drastically increasing the hit rate.
- CCI Overbought/Oversold Logic: CCI is crucial for identifying market extremes, acting as a primary trigger.
- Dynamic Information Panel: Clear view of CCI (we saw 38.29), ADX (at 27.4, indicating "TRENDING"), ATR, and the last divergence ("CMO BULLISH").
ATTENTION ALERT Signal (Yellow Arrow 🟡): A distinctive feature! Warns about CCI extremes in markets without a strong trend, alerting to potential reversals in consolidations or exhaustion of weak trends.
Fully Configurable: Adjust all parameters to suit your style.
💡 LEARN HOW TO USE THE SIGNALS TO YOUR ADVANTAGE:
- Buy Signals (Blue Arrow 🔵): ADX confirming uptrend + oscillators in oversold/bullish divergence.
- Sell Signals (Red Arrow 🔴): ADX confirming downtrend + oscillators in overbought/bearish divergence.
- Attention Signals (Yellow Arrow 🟡): Monitor for reversals in sideways markets or exhaustion in weak trends.
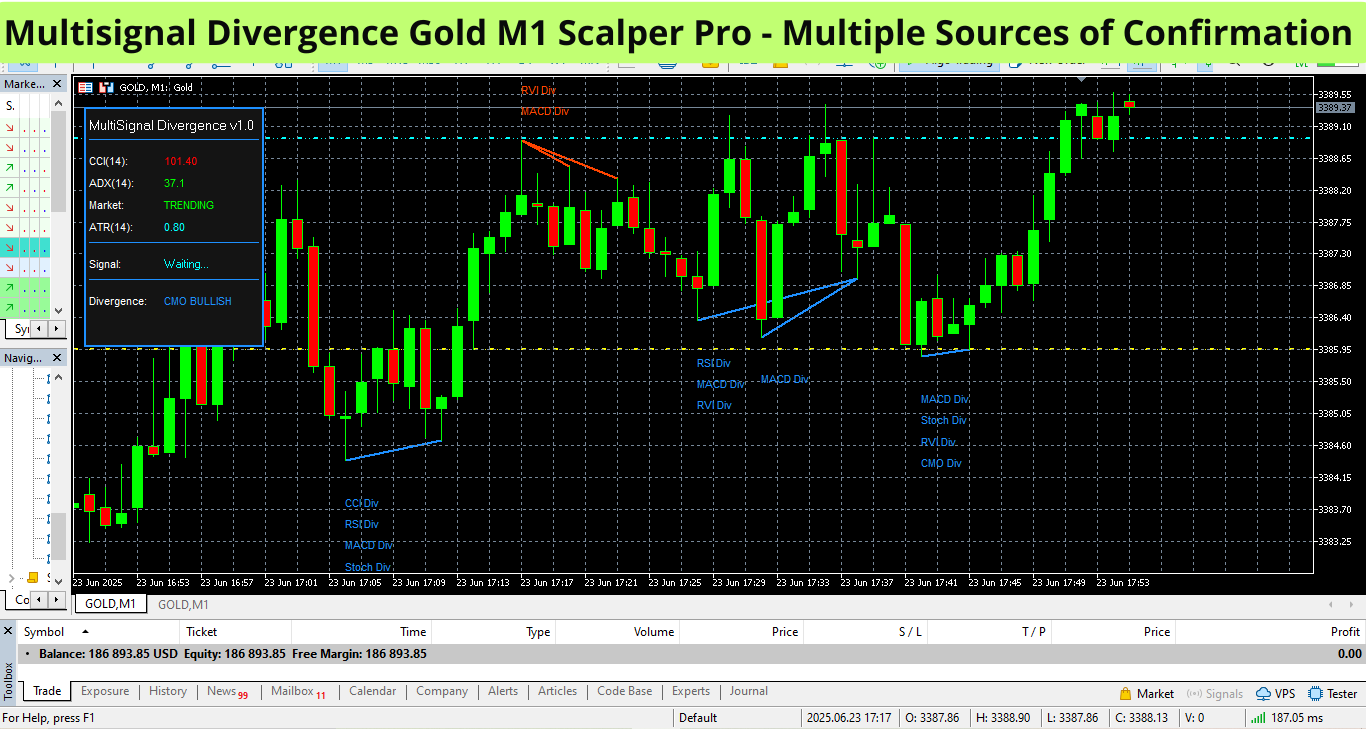
The "MultiSignal Divergence v1.0" indicator, as visualized on the GOLD M1 chart on the MetaTrader platform, is a sophisticated tool designed to identify and signal divergences between price movement and multiple technical oscillators. Its primary objective is to provide traders with clear visual alerts about potential reversal or trend continuation points, thereby optimizing decision-making.Analysis of Visual Components and Functionalities:Informative Panel (Dashboard):Located in the upper left corner of the chart, this panel offers a concise summary of market conditions and the indicator's status.CCI (14): 101.40 (in red) - Indicates that the Commodity Channel Index is in overbought territory, suggesting the price may be overextended to the upside.
ADX (14): 37.1 - An ADX value above 25, like this one, signals a strong prevailing trend in the market.Market: TRENDING - Confirms the ADX reading, indicating the market is in a trending phase.ATR (14): 0.80 - The Average True Range shows the average volatility for the period, useful for setting stops or targets.Signal: Waiting... - At the time of the screenshot, the indicator was awaiting a new consolidated entry signal.Divergence: CMO BULLISH - This is the most recent and prominent alert, indicating a bullish divergence detected via the Chande Momentum Oscillator. This suggests that while the price may have made lower lows or lows at the same level, the CMO made higher lows, signaling weakening selling pressure and potential upside.
Signaling Divergences on the Chart:The indicator plots lines directly on the price candles, connecting the tops (for bearish divergences, usually in orange/red) or bottoms (for bullish divergences, usually in blue/green) that form the divergence pattern with the respective oscillator.In the screenshot, we observe multiple blue lines connecting bottoms, accompanied by labels such as "RSI Div," "MACD Div," "RVI Div," "Stoch Div," and "CMO Div." These indicate various bullish divergences identified by different oscillators at different times.
There is also an indication of "RVI Div" and "MACD Div" with orange lines connecting tops, suggesting previous bearish divergences.Interpretation and Utility:The "MultiSignal Divergence v1.0" proves to be a powerful tool by:Aggregating Multiple Confirmation Sources: Instead of relying on a single oscillator, it scans various popular indicators (RSI, MACD, Stoch, CMO, RVI, etc.), increasing the robustness of the divergence signals.Facilitating Visualization: The direct plotting on the chart and the informative panel make pattern identification intuitive and quick, which is crucial on smaller timeframes like M1, where speed of analysis is essential.
Anticipating Movements: Divergences are often considered leading signals. On the chart, it's noticeable that after some of the bullish divergence signals (blue lines), the Gold price indeed showed upward movements, validating the indicator's effectiveness.The "MultiSignal Divergence v1.0" indicator is, therefore, a valuable assistant for traders who use divergence analysis as part of their strategy, offering a consolidated and visually clear approach to detecting potentially profitable trading opportunities.Explore the power of divergences and optimize your market entries! To learn more about "MultiSignal Divergence v1.0" and test its effectiveness, we invite you to download the free DEMO version via the official link on MQL5.com.
🏷️ Download the DEMO Version Here: https://www.mql5.com/pt/market/product/141856
Master the volatile Gold (XAUUSD) market on the M1 timeframe with the Multisignal Divergence Gold M1 Scalper Pro . This indicator is not just another tool, but an advanced trading engine, meticulously designed to provide scalpers with high-precision entry signals, filtering out noise and focusing on robust confluences. The Challenge of Gold M1 Scalping: Scalping, especially on an asset like Gold on the M1, demands speed, precision, and an exceptional ability to identify momentary reversals
Dear traders and investors,
It is with great pleasure that we share another update on the performance of our Expert Advisor, GoldOracle, operating in a real account. Our commitment is to transparency and demonstrating consistent results, and today was an excellent example of our robot's capabilities.
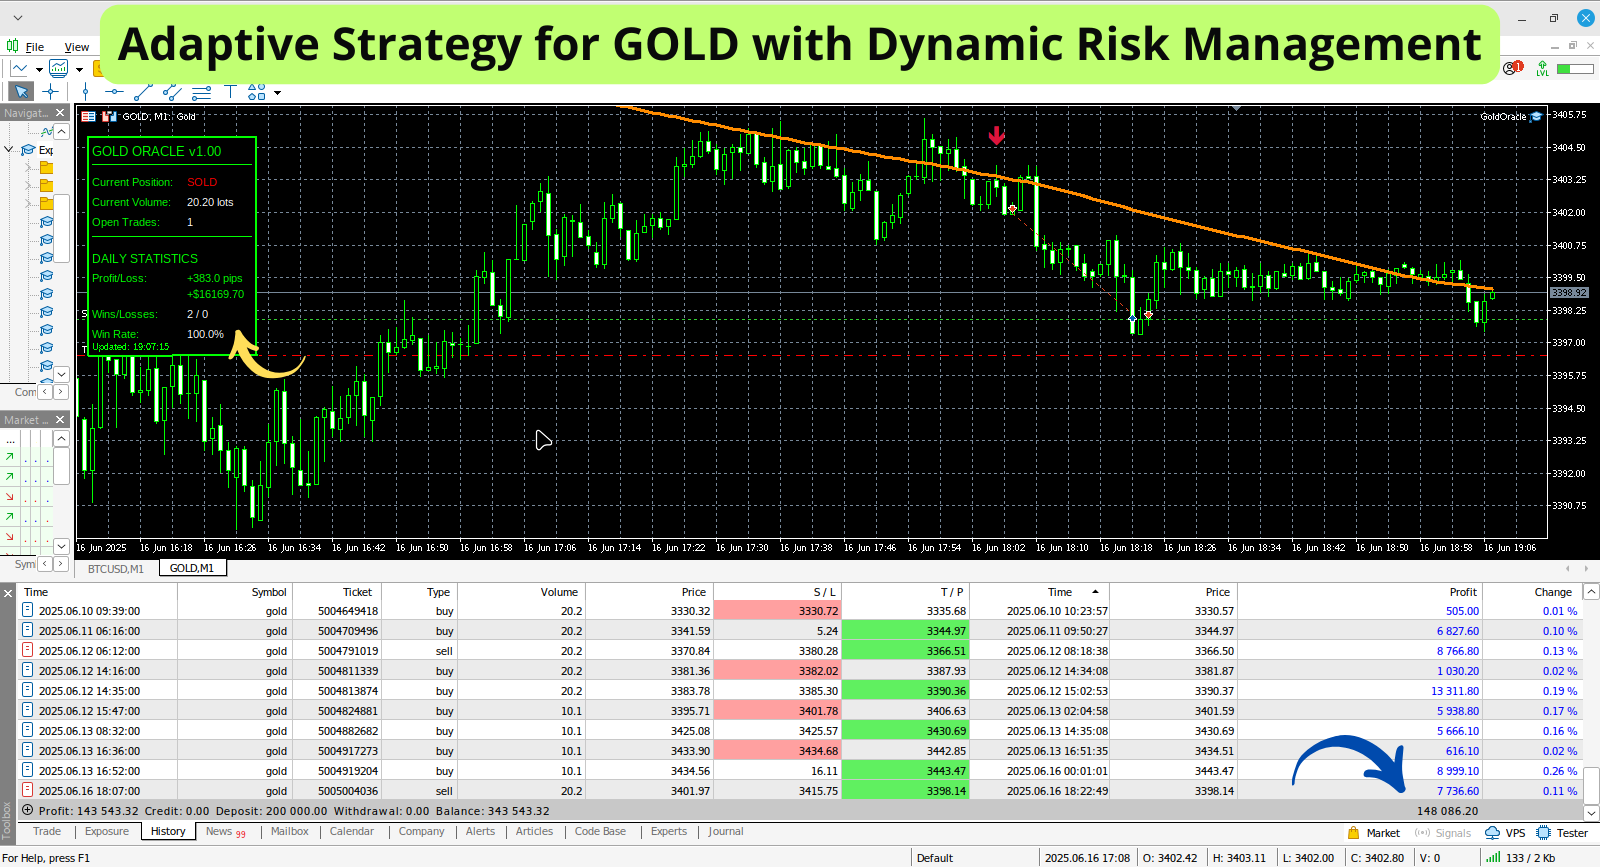
Recent Trade Analysis:
As we can see in the attached image, GoldOracle is trading on the Gold (GOLD) chart on the M1 timeframe. The technical analysis at the time showed a clear bearish trend line (LTB) acting as dynamic resistance.
The robot accurately identified a sell opportunity (SELL) exactly when the price touched this resistance and showed signs of rejection, as indicated by the red arrow on the chart. This trade demonstrates the EA's intelligence in reading price action and aligning with the prevailing trend of the micro-movement, maximizing the probabilities of success.
Highlighted Results:
Daily Profit: At the time of capture, the robot had accumulated a profit of +$16,169.70, which is equivalent to +383 pips.
Hit Rate: The "DAILY STATISTICS" panel displays an impeccable performance of 100% wins per day (2 winning trades).
Adaptive Strategy: The trading history (at the bottom of the image) proves the adaptive nature of the robot, which performs both buy and sell trades, seeking profit in any direction the market takes.
Dynamic Risk Management: Note the variation in the trading volume in the history (e.g.: 10.1 and 20.2 lots). This is a reflection of the dynamic management system, which adjusts risk exposure based on volatility and signal reliability, a fundamental pillar for long-term survival and profitability.
The combination of an adaptive strategy with dynamic risk management is what allows GoldOracle to efficiently navigate the high volatility of the gold market.
See for yourself! Try GoldOracle for Free.
Don't just take our word for it. We invite you to see for yourself how effective GoldOracle is. Download the free DEMO version and run your own tests in the Strategy Tester or on a demo account to see the robot in action.
Discover how our technology can optimize your trading in the gold market.
Click on the link below to download the demo version and learn more:
https://www.mql5.com/en/market/product/140615?source=Site+Profile+Seller
If you have any questions, please let us know in the comments.
Happy trading!
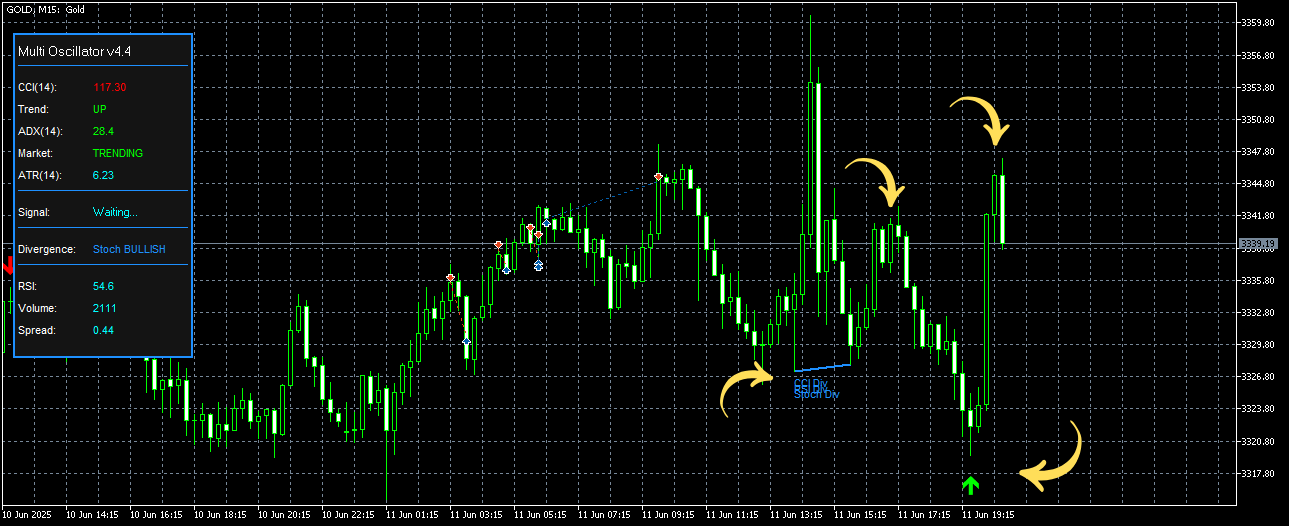
In addition to the EA's performance, I am excited to introduce a project I've been working on: the Multi Oscillator, an advanced indicator focused on identifying high-probability reversal opportunities.
Key Features:
Automatic Divergence Detection: The core strength of this indicator is its ability to identify divergences between price and oscillators. In the second screenshot, we can see a clear example of a "Stochastic BULLISH Divergence". While the price was forming a lower low, the implicit oscillator was forming a higher low—a classic sign that selling pressure is waning and an upward reversal is imminent.
Precise Top and Bottom Signaling: The indicator uses a refined logic to mark points of market exhaustion, signaling potential tops and bottoms with arrows and visual markers, such as the buy signal (green arrow) generated right after the divergence confirmation.
Comprehensive Analysis Dashboard: To complement the signals, the indicator features a panel that consolidates vital information such as trend strength (ADX), market condition (Trending), volatility (ATR), and readings from multiple oscillators, offering a complete overview for decision-making.
The future integration of such powerful logic, like divergence detection, into the GOLD ORACLE has the potential to further refine entry and exit points, filtering out lower-quality signals and anticipating market reversals with an extra layer of confirmation.
Conclusion
In summary, it was a day of excellent financial results, validating the robustness of the GOLD ORACLE EA. At the same time, the development of new tools like the divergence indicator points toward a future with even more intelligent and profitable analysis.
I would love to hear your thoughts: Is divergence detection a fundamental part of your trading strategy? Leave your comments below!
Thank you for following, and happy trading to all.
Hello, community!
Today, I'm sharing the results from another day of trading and a glimpse into a new tool I'm developing to further enhance the precision of our analysis.
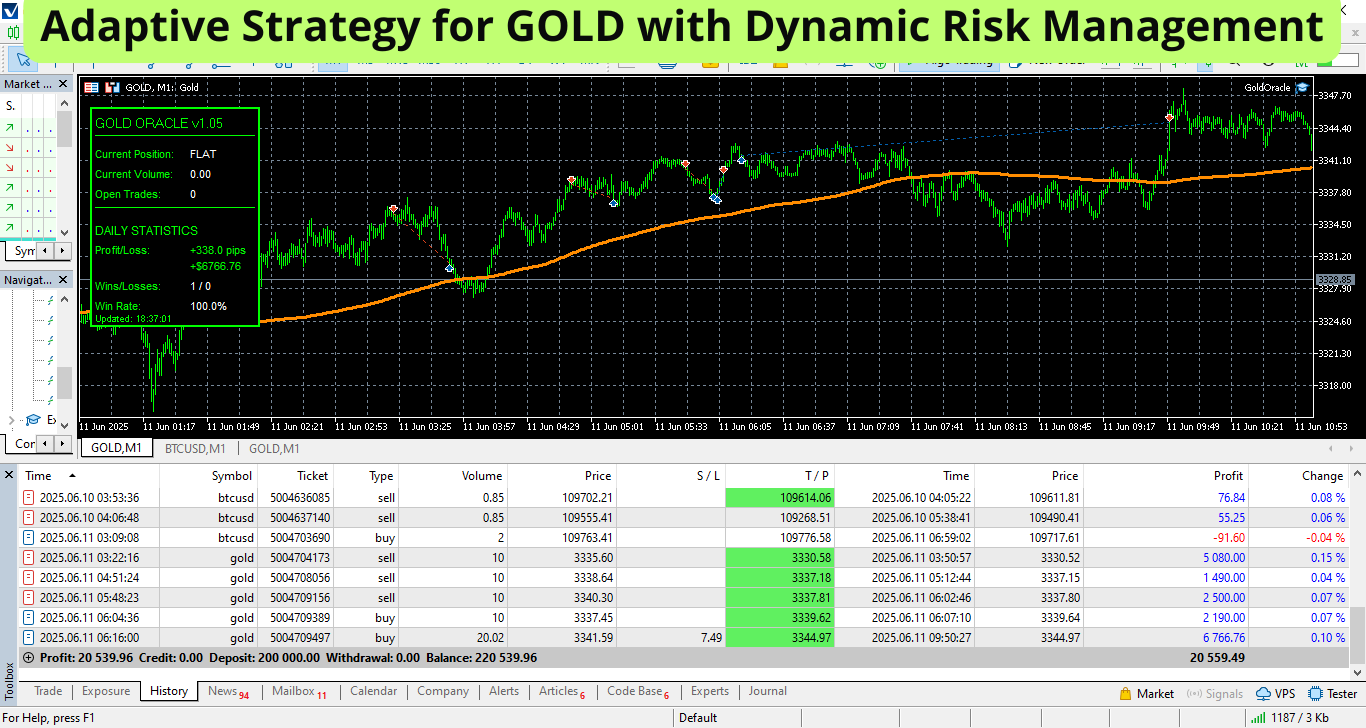
1. Performance Analysis: GOLD ORACLE v1.05
Today was an exceptional day for our Expert Advisor, the GOLD ORACLE v1.05, trading on Gold (XAUUSD) on the M1 timeframe. The market's volatility was navigated masterfully, resulting in a solid and consistent performance.
Today's Metrics (EA Panel):
Net Profit: +$6,786.76
Pips Gained: +338.8 pips
Win Rate (Current Session): 100% (1 winning trade / 0 losing trades)
Professional Trade Analysis:
Analyzing the trade history in the terminal, we can see that the EA executed a series of strategic trades throughout the day. The strategy, which appears to be based on swift movements around a central moving average (the orange line on the chart), proved to be highly effective.
The highlight was the last buy trade (buy 20.02 lots), which captured a strong upward momentum and was responsible for the majority of today's consolidated profit. This demonstrates the EA's ability not only to perform scalping but also to identify and position itself in stronger directional moves, maximizing gains. Precise risk management and positioning were crucial to closing the day without any losses recorded in the robot's current session.
Ready Setup for GoldOracle - Scalper M1 (Gold)
Hello, trader! You’ve just acquired GoldOracle, an expert advisor with pre-optimized settings for scalping on the M1 timeframe in the gold market (XAUUSD).
How to Load the Settings in MT5:
You have two options to start using the EA with the ideal configurations:
Option 1: Step-by-Step Guide
If you prefer manual setup, follow these steps:
Copy the entire parameter text (provided after purchase).
Open a plain text editor (Notepad or similar).
Paste the copied content into the blank file.
Click "File" → "Save As...".
In the save dialog:
Under "Save as type", select "All Files (.)".
In the "File name" field, enter: Scalper.set (or another name, but always with the .set extension).
Click "Save".
Done! Now you can load this file into the MT5 Strategy Tester (under the "Inputs" tab).
Option 2: Request the Ready-to-Use File
Prefer an easier way? Send me a message with the subject:
"scalper.set", and I’ll send you the pre-configured file, ready to use!
Questions? I’m here to help you start trading with maximum efficiency!
Happy trading and successful entries!
Copy the "scalper.set" code from the step-by-step guide in Option 1.
; General Settings
Timeframe=1
LotSize=0.01
UseTrailingStop=true
UseEnhancedTrailingStop=true
TrailingStopPips=400.0
TrailingStopSafetyBufferPips=400
LogFileName=GoldOracleLog.csv
MagicNumber=12345
; Initialization Settings
WarmUpBars=0
MinBarsCalculatedForIndicator=50
; Risk Management (Maximum Stop Loss)
UseAbsoluteMaxStopLoss=true
AbsoluteMaxStopLossPips=5000.0
; Indicators and Filters (Opening)
confirmationWindow=20
MA_Period=20
CCI_Period=50
ADX_Period=14
ADX_Threshold=30.0
SlopeThresholdPips=1.0
UseMA200Filter=true
UseM1Filter_AgainstOBS=true
; Current Candle/Trigger Validation (Post-Past Confirmation)
ValidateCurrentConditions=true
ADX_Current_Minimum_To_Continue=30.0
CCI_Validate_Current_Sell=true
CCI_Validate_Current_Buy=true
ValidateCurrentHistogram=true
; Advanced MACD Filter (Opening - bestCandleIndex)
UseMACDHistogramFilter=true
; Strong Volume Filter (Opening - bestCandleIndex)
UseStrongVolumeFilter=true
VolumeLookbackPeriod=20
VolumeMultiplier=1.0
Points_Volume_Confirm=1
; Scoring System for Confirmation (Opening - bestCandleIndex)
Points_ADX_Confirm=2
Points_CCI_Confirm=2
Points_Slope_Confirm=1
Points_MA200_Filter_Confirm=1
Points_ADX_Confirm_Sell=2
Points_CCI_Confirm_Sell=2
Points_Slope_Confirm_Sell=1
Points_MA200_Filter_Confirm_Sell=1
MinScoreToOpenTrade=4
MinScoreToOpenTrade_Sell=6
; Sell Operations Control
AllowSells=true
Sell_Block_Hours_UTC=
; MACD Parameters (Opening and OBS Closing)
MacdFastPeriod=12
MacdSlowPeriod=26
MacdSignalPeriod=9
MacdAppliedPrice=1
; Alternative MA Crossover Trigger
UseMAcrossoverTrigger=false
MACrossoverConfirmationWindow=30
; Structural Stop Loss (Initial)
StructureLookback=15
AtrPeriodSL=14
AtrMultiplierSL=6.0
StructureLookback_Sell=10
AtrMultiplierSL_Sell=6.0
; Dynamic Take Profit (ATR)
UseTakeProfitATR=true
AtrMultiplierTP_Buy=4.5
AtrMultiplierTP_Sell=5.0
AtrPeriodTP=14
; Sequential Trades Limit
UseSequentialTradesLimit=true
MaxAllowedSequentialTrades=2
MinSecondsIntervalBetweenSequentialTrades=1200
ADX_ConsecutiveFallingCandlesToReset=2
OppositeHistogramResetsSequence=true
; Time Filter and Optimized Dynamic Lot (UTC)
UseTimeFilter=true
UseDynamicLot=true
Reduced_Lot=0.01
; Dynamic Lot Filter by Performance (Hour/Day - UTC)
UseNewDynamicLot_Performance=true
Base_Lot_Performance=0.01
Increased_Lot_Performance=0.02
Significant_Profit_Hours_Performance=0,1,2,3,4,5,6,7,14,15,16,21
Profit_Exceeds_Loss_Hours_Performance=8,9,10,12,17,18,20,22
Significant_Profit_Days_Performance=1,2,3,4
; Overbought/Oversold Closing System (Main)
UseOBSClosing=true
RSI_Period=7
RSI_Overbought=70.0
RSI_Oversold=30.0
Stoch_Period=5
Stoch_K=3
Stoch_D=3
Stoch_Overbought=80.0
Stoch_Oversold=20.0
OBS_MinTimeInPositionSeconds=200
OBS_RequiredScoreToClose=2
; Additional Indicators for OBS Closing
UseWilliamsR=true
WilliamsR_Period=7
WilliamsR_Overbought=-20.0
WilliamsR_Oversold=-80.0
UseMFI=true
MFI_Period=7
MFI_AppliedVolume=0
MFI_Overbought=80.0
MFI_Oversold=20.0
UseBollingerBands=true
BB_Period=14
BB_Deviation=2.0
; Friday Market Close Filter
UseFridayCloseFilter=true
HoursBeforeMarketClose=1
; MA Direction Filter
UseMADirectionFilter=true
MinDistanceBetweenMAs=50.0
MinMA20SlopePips=3.0
MA20SlopeCheckBars=3
Hello, MQL5 community!
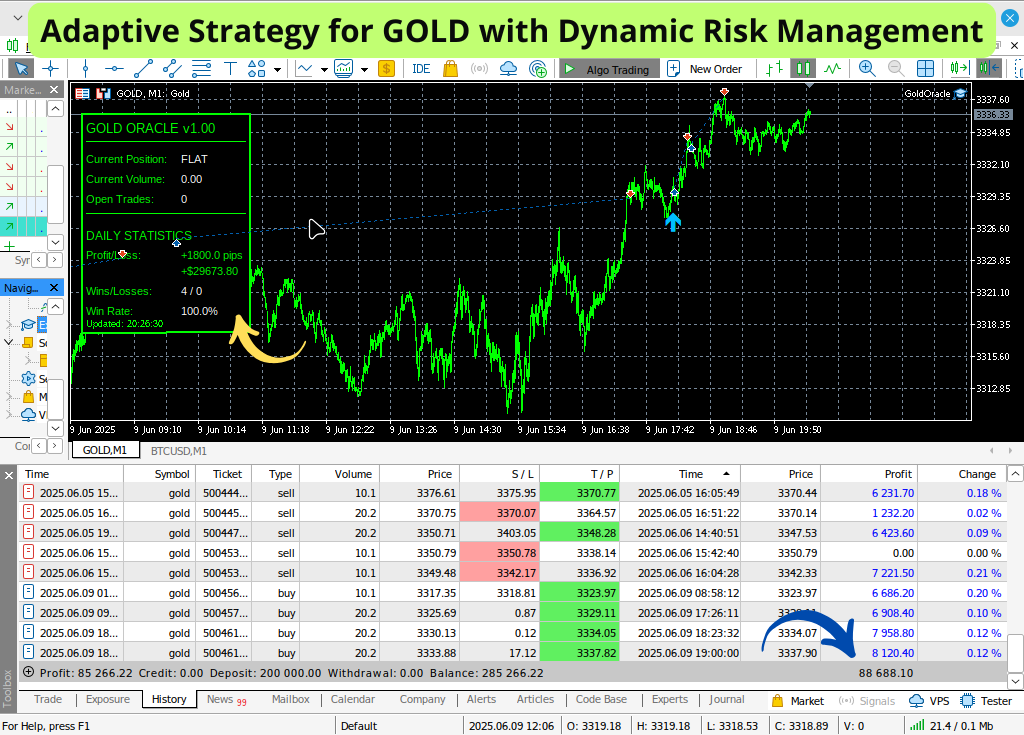
Today, I'm sharing a detailed analysis of the GoldOracle Expert Advisor's performance on the GOLD pair (XAU/USD) on the M1 timeframe. The day was marked by a strong uptrend, an ideal scenario to test our EA's adaptability and precision.
Summary of Today's Statistics:
Total Profit: +$29,673.80
Pips Gained: +1800.0 pips
Trades Executed: 4
Win Rate: 100% (4 wins / 0 losses)
Technical and Operational Analysis:
Analyzing the chart and the trade history, we can observe the intelligent behavior of GoldOracle. The EA correctly identified the strong buying momentum and executed a series of 4 trades, all in the direction of the main trend (buy).
What stands out is how the positions were managed. The EA didn't just open a single order; it applied a pyramiding technique, adding new buy positions (buy @ 3317.35, 3325.69, 3330.13, 3333.88) as the price confirmed the strength of the upward movement. Furthermore, the trade volume was dynamically adjusted (10.1 and 20.2 lots), optimizing risk exposure and maximizing potential profits in a favorable scenario.
This demonstrates the essence of our Adaptive Strategy for GOLD with Dynamic Risk Management. The system not only identifies the market direction but also adjusts the position size and entry timing based on volatility and signal conviction, ensuring that each trade has an optimized risk/reward ratio.
The result is clear: a flawless trading day, capitalizing fully on a directional market move with surgical precision and smart risk management.
We will continue to monitor and refine GoldOracle. Stay tuned for more performance updates.
Happy trading to all.
Hello, trader! You’ve just acquired GoldOracle, an expert advisor with pre-optimized settings for scalping on the M1 timeframe in the gold market (XAUUSD).
How to Load the Settings in MT5:
You have two options to start using the EA with the ideal configurations:
Option 1: Step-by-Step Guide
If you prefer manual setup, follow these steps:
Copy the entire parameter text (provided after purchase).
Open a plain text editor (Notepad or similar).
Paste the copied content into the blank file.
Click "File" → "Save As...".
In the save dialog:
Under "Save as type", select "All Files (.)".
In the "File name" field, enter: Scalper.set (or another name, but always with the .set extension).
Click "Save".
Done! Now you can load this file into the MT5 Strategy Tester (under the "Inputs" tab).
Option 2: Request the Ready-to-Use File
Prefer an easier way? Send me a message with the subject:
"scalper.set", and I’ll send you the pre-configured file, ready to use!
Questions? I’m here to help you start trading with maximum efficiency!
Happy trading and successful entries!
Copy the "scalper.set" code from the step-by-step guide in Option 1.
; General Settings
Timeframe=1
LotSize=0.01
UseTrailingStop=true
UseEnhancedTrailingStop=true
TrailingStopPips=400.0
TrailingStopSafetyBufferPips=400
LogFileName=GoldOracleLog.csv
MagicNumber=12345
; Initialization Settings
WarmUpBars=0
MinBarsCalculatedForIndicator=50
; Risk Management (Maximum Stop Loss)
UseAbsoluteMaxStopLoss=true
AbsoluteMaxStopLossPips=5000.0
; Indicators and Filters (Opening)
confirmationWindow=20
MA_Period=20
CCI_Period=50
ADX_Period=14
ADX_Threshold=30.0
SlopeThresholdPips=1.0
UseMA200Filter=true
UseM1Filter_AgainstOBS=true
; Current Candle/Trigger Validation (Post-Past Confirmation)
ValidateCurrentConditions=true
ADX_Current_Minimum_To_Continue=30.0
CCI_Validate_Current_Sell=true
CCI_Validate_Current_Buy=true
ValidateCurrentHistogram=true
; Advanced MACD Filter (Opening - bestCandleIndex)
UseMACDHistogramFilter=true
; Strong Volume Filter (Opening - bestCandleIndex)
UseStrongVolumeFilter=true
VolumeLookbackPeriod=20
VolumeMultiplier=1.0
Points_Volume_Confirm=1
; Scoring System for Confirmation (Opening - bestCandleIndex)
Points_ADX_Confirm=2
Points_CCI_Confirm=2
Points_Slope_Confirm=1
Points_MA200_Filter_Confirm=1
Points_ADX_Confirm_Sell=2
Points_CCI_Confirm_Sell=2
Points_Slope_Confirm_Sell=1
Points_MA200_Filter_Confirm_Sell=1
MinScoreToOpenTrade=4
MinScoreToOpenTrade_Sell=6
; Sell Operations Control
AllowSells=true
Sell_Block_Hours_UTC=
; MACD Parameters (Opening and OBS Closing)
MacdFastPeriod=12
MacdSlowPeriod=26
MacdSignalPeriod=9
MacdAppliedPrice=1
; Alternative MA Crossover Trigger
UseMAcrossoverTrigger=true
MACrossoverConfirmationWindow=30
; Structural Stop Loss (Initial)
StructureLookback=15
AtrPeriodSL=14
AtrMultiplierSL=6.0
StructureLookback_Sell=10
AtrMultiplierSL_Sell=6.0
; Dynamic Take Profit (ATR)
UseTakeProfitATR=true
AtrMultiplierTP_Buy=4.5
AtrMultiplierTP_Sell=5.0
AtrPeriodTP=14
; Sequential Trades Limit
UseSequentialTradesLimit=true
MaxAllowedSequentialTrades=2
MinSecondsIntervalBetweenSequentialTrades=1200
ADX_ConsecutiveFallingCandlesToReset=2
OppositeHistogramResetsSequence=true
; Time Filter and Optimized Dynamic Lot (UTC)
UseTimeFilter=true
UseDynamicLot=true
Reduced_Lot=0.01
; Dynamic Lot Filter by Performance (Hour/Day - UTC)
UseNewDynamicLot_Performance=true
Base_Lot_Performance=0.01
Increased_Lot_Performance=0.02
Significant_Profit_Hours_Performance=0,1,2,3,4,5,6,7,14,15,16,21
Profit_Exceeds_Loss_Hours_Performance=8,9,10,12,17,18,20,22
Significant_Profit_Days_Performance=1,2,3,4
; Overbought/Oversold Closing System (Main)
UseOBSClosing=true
RSI_Period=7
RSI_Overbought=70.0
RSI_Oversold=30.0
Stoch_Period=5
Stoch_K=3
Stoch_D=3
Stoch_Overbought=80.0
Stoch_Oversold=20.0
OBS_MinTimeInPositionSeconds=200
OBS_RequiredScoreToClose=2
; Additional Indicators for OBS Closing
UseWilliamsR=true
WilliamsR_Period=7
WilliamsR_Overbought=-20.0
WilliamsR_Oversold=-80.0
UseMFI=true
MFI_Period=7
MFI_AppliedVolume=0
MFI_Overbought=80.0
MFI_Oversold=20.0
UseBollingerBands=true
BB_Period=14
BB_Deviation=2.0
; Friday Market Close Filter
UseFridayCloseFilter=true
HoursBeforeMarketClose=1
; MA Direction Filter
UseMADirectionFilter=true
MinDistanceBetweenMAs=50.0
MinMA20SlopePips=3.0
MA20SlopeCheckBars=3
To ensure you use the optimized parameters, follow these simple steps to create the file to be loaded into MT5:
Copy all the parameter text listed below.
Open a plain text editor, such as Notepad on Windows.
Paste the copied text into the blank file.
Click on "File" -> "Save As...".
In the save dialog box, do the following:
In the "Save as type" field, select the "All Files (*.*)" option. (This is the most important step!)
In the "File name" field, type GoldOracle_Backtest.set (or any name you prefer, as long as it ends with .set).
Click "Save".
Done! You can now load this file directly in the "Inputs" tab of the Strategy Tester in MT5.
; General Settings
Timeframe=1
LotSize=0.1
UseTrailingStop=true
UseEnhancedTrailingStop=true
TrailingStopPips=800.0
TrailingStopSafetyBufferPips=400
LogFileName=GoldOracleLog.csv
MagicNumber=12345
; Initialization Settings
WarmUpBars=0
MinBarsCalculatedForIndicator=50
; Risk Management (Maximum Stop Loss)
UseAbsoluteMaxStopLoss=true
AbsoluteMaxStopLossPips=5000.0
; Indicators and Filters (Opening)
confirmationWindow=20
MA_Period=20
CCI_Period=50
ADX_Period=14
ADX_Threshold=40.0
SlopeThresholdPips=1.0
UseMA200Filter=true
UseM1Filter_AgainstOBS=true
; Current Candle/Trigger Validation (Post-Past Confirmation)
ValidateCurrentConditions=true
ADX_Current_Minimum_To_Continue=40.0
CCI_Validate_Current_Sell=true
CCI_Validate_Current_Buy=true
ValidateCurrentHistogram=true
; Advanced MACD Filter (Opening - bestCandleIndex)
UseMACDHistogramFilter=true
; Strong Volume Filter (Opening - bestCandleIndex)
UseStrongVolumeFilter=true
VolumeLookbackPeriod=20
VolumeMultiplier=1.1
Points_Volume_Confirm=1
; Scoring System for Confirmation (Opening - bestCandleIndex)
Points_ADX_Confirm=2
Points_CCI_Confirm=2
Points_Slope_Confirm=1
Points_MA200_Filter_Confirm=1
Points_ADX_Confirm_Sell=2
Points_CCI_Confirm_Sell=2
Points_Slope_Confirm_Sell=1
Points_MA200_Filter_Confirm_Sell=1
MinScoreToOpenTrade=4
MinScoreToOpenTrade_Sell=6
; Sell Operations Control
AllowSells=true
Sell_Block_Hours_UTC=
; MACD Parameters (Opening and OBS Closing)
MacdFastPeriod=12
MacdSlowPeriod=26
MacdSignalPeriod=9
MacdAppliedPrice=1
; Alternative MA Crossover Trigger
UseMAcrossoverTrigger=false
MACrossoverConfirmationWindow=30
; Structural Stop Loss (Initial)
StructureLookback=20
AtrPeriodSL=14
AtrMultiplierSL=4.0
StructureLookback_Sell=10
AtrMultiplierSL_Sell=3.0
; Dynamic Take Profit (ATR)
UseTakeProfitATR=true
AtrMultiplierTP_Buy=4.5
AtrMultiplierTP_Sell=4.0
AtrPeriodTP=14
; Sequential Trades Limit
UseSequentialTradesLimit=true
MaxAllowedSequentialTrades=2
MinSecondsIntervalBetweenSequentialTrades=1200
ADX_ConsecutiveFallingCandlesToReset=2
OppositeHistogramResetsSequence=true
; Time Filter and Optimized Dynamic Lot (UTC)
UseTimeFilter=true
UseDynamicLot=true
Reduced_Lot=0.01
; Dynamic Lot Filter by Performance (Hour/Day - UTC)
UseNewDynamicLot_Performance=true
Base_Lot_Performance=0.1
Increased_Lot_Performance=0.2
Significant_Profit_Hours_Performance=0,1,2,3,4,5,6,7,14,15,16,21
Profit_Exceeds_Loss_Hours_Performance=8,9,10,12,17,18,20,22
Significant_Profit_Days_Performance=1,2,3,4
; Overbought/Oversold Closing System (Main)
UseOBSClosing=true
RSI_Period=7
RSI_Overbought=70.0
RSI_Oversold=30.0
Stoch_Period=5
Stoch_K=3
Stoch_D=3
Stoch_Overbought=80.0
Stoch_Oversold=20.0
OBS_MinTimeInPositionSeconds=200
OBS_RequiredScoreToClose=2
; Additional Indicators for OBS Closing
UseWilliamsR=true
WilliamsR_Period=7
WilliamsR_Overbought=-20.0
WilliamsR_Oversold=-80.0
UseMFI=true
MFI_Period=7
MFI_AppliedVolume=0
MFI_Overbought=80.0
MFI_Oversold=20.0
UseBollingerBands=true
BB_Period=14
BB_Deviation=2.0
; Friday Market Close Filter
UseFridayCloseFilter=false
HoursBeforeMarketClose=1
; MA Direction Filter
UseMADirectionFilter=true
MinDistanceBetweenMAs=50.0
MinMA20SlopePips=3.0
MA20SlopeCheckBars=3