Tâche terminée
Spécifications
Hello Developers,
I want to make an indicator - Expert adviser getting its data from the indicator, i need to make the indicator first just to make sure its provides the correct data (will be described in detailed later).
developer need to be familiar coding with (Volume indicator - MACD - Regression Channel - Fibonacci retracment levels - to be able to wait for a future candles to occur so we can get data from) dont worry every thing will be described in details with photos later.
-i need a developer who can understand and speak English perfectly how ever its not my first language too but we will need to communicate some times.
- Quick responds will be highly appreciated so we can save each others time.
indicator will be the difficult part and then the expert will get its data from the indicator
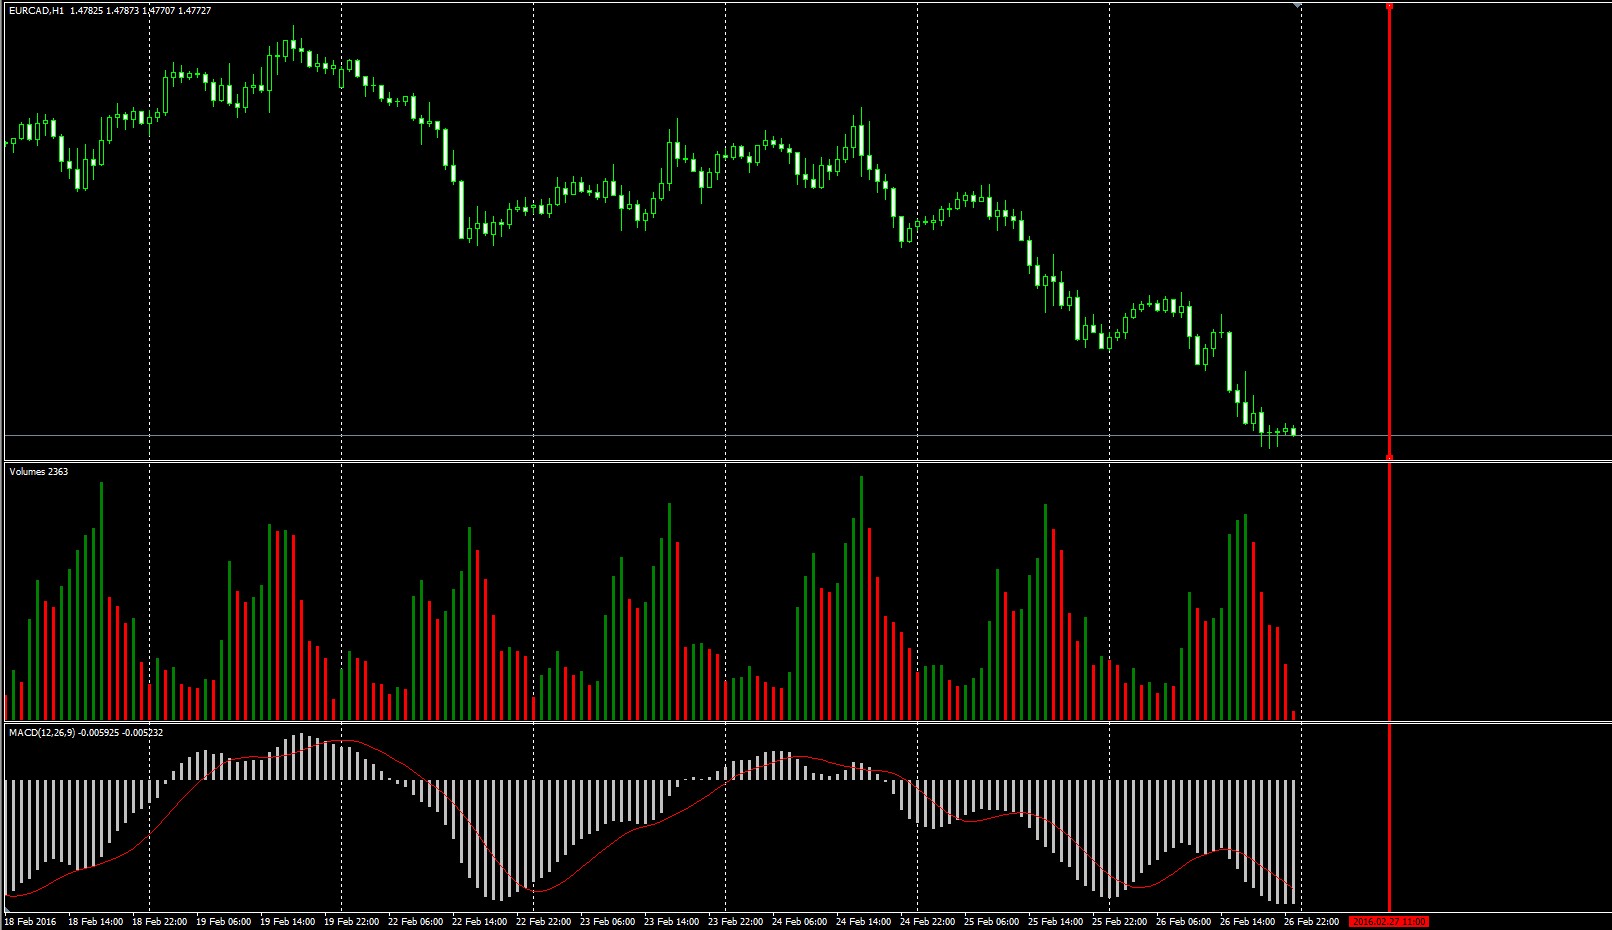
indicator will draw future line at the next day based on some calculations from the current day volume bars data.
PHASE 1.1 of The Indicator: (The Red Line)
quick example for the future line pic :
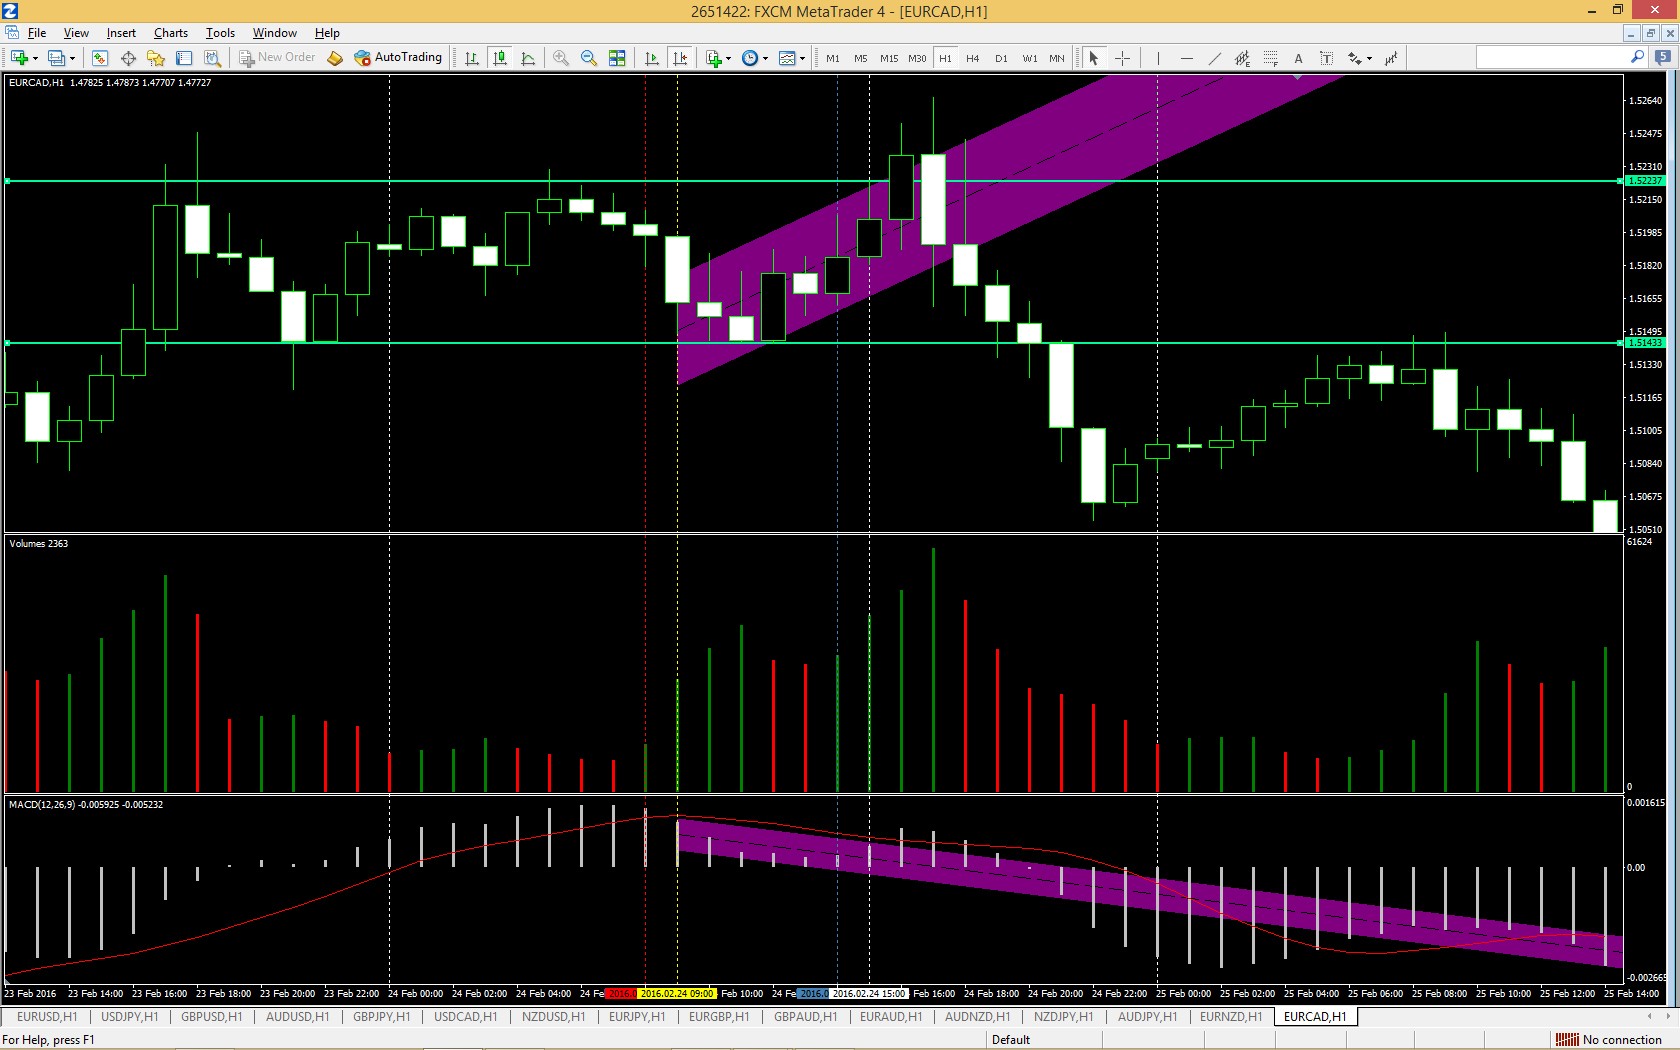
This Red Line is drawn at The Time 11:00 based on the current days calculations ....HOW ?? the answer is >>> by getting the average time periods of the Highest green candles .... not all of them only when a higher candles occurs..... for example pic 2
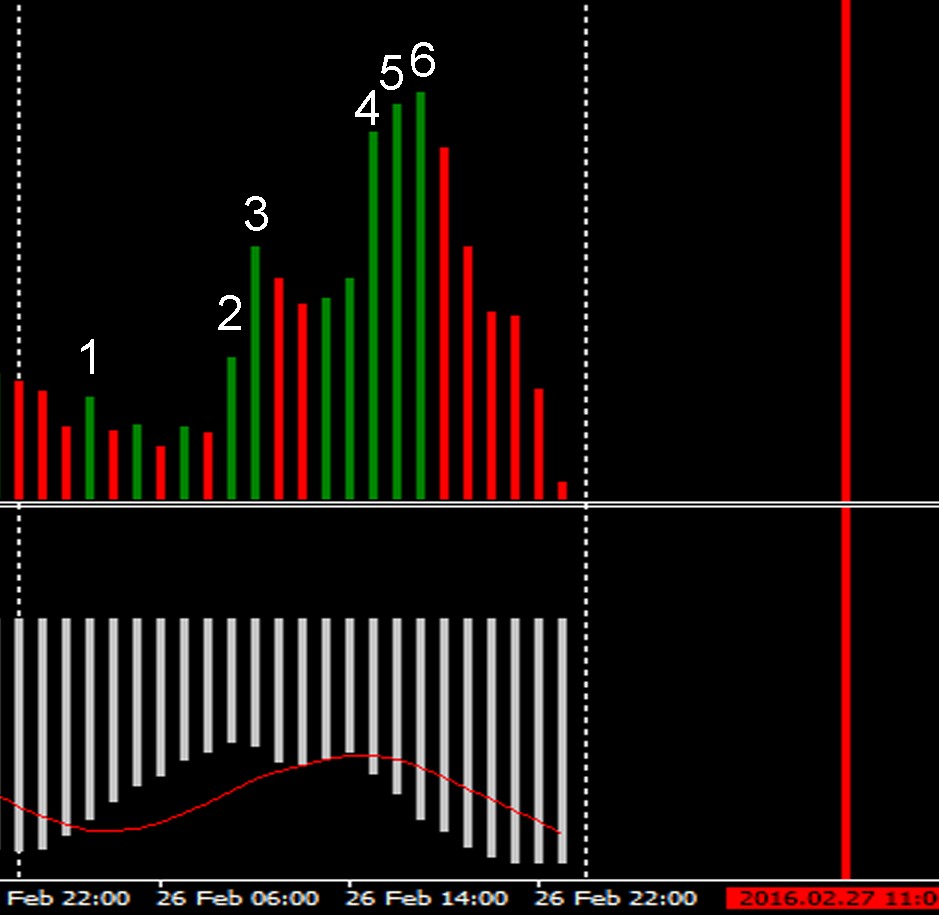
so bar number 2 is a green bar but higher than bar number 1 ...bar number 3 is higher than 2 .... bar number 4 is higher than 3 and 2 ....etc
so now ineed the the indicator to calculate the periods of each higher green bar period and and get their average period .... For ex ...
IF
Bar 1 period was at 3:00
Bar 2 period was at 9:00
Bar 3 period was at 10:00
Bar 4 period was at 15:00
Bar 5 period was at 16:00
Bar 6 period was at 17:00
Then
The average period will be (3+9+10+15+16+17) / 6 = 11.6 ..... yet the indicator will draw a Vertical line at (11:00). this will be the end of phase 1.1 programming.
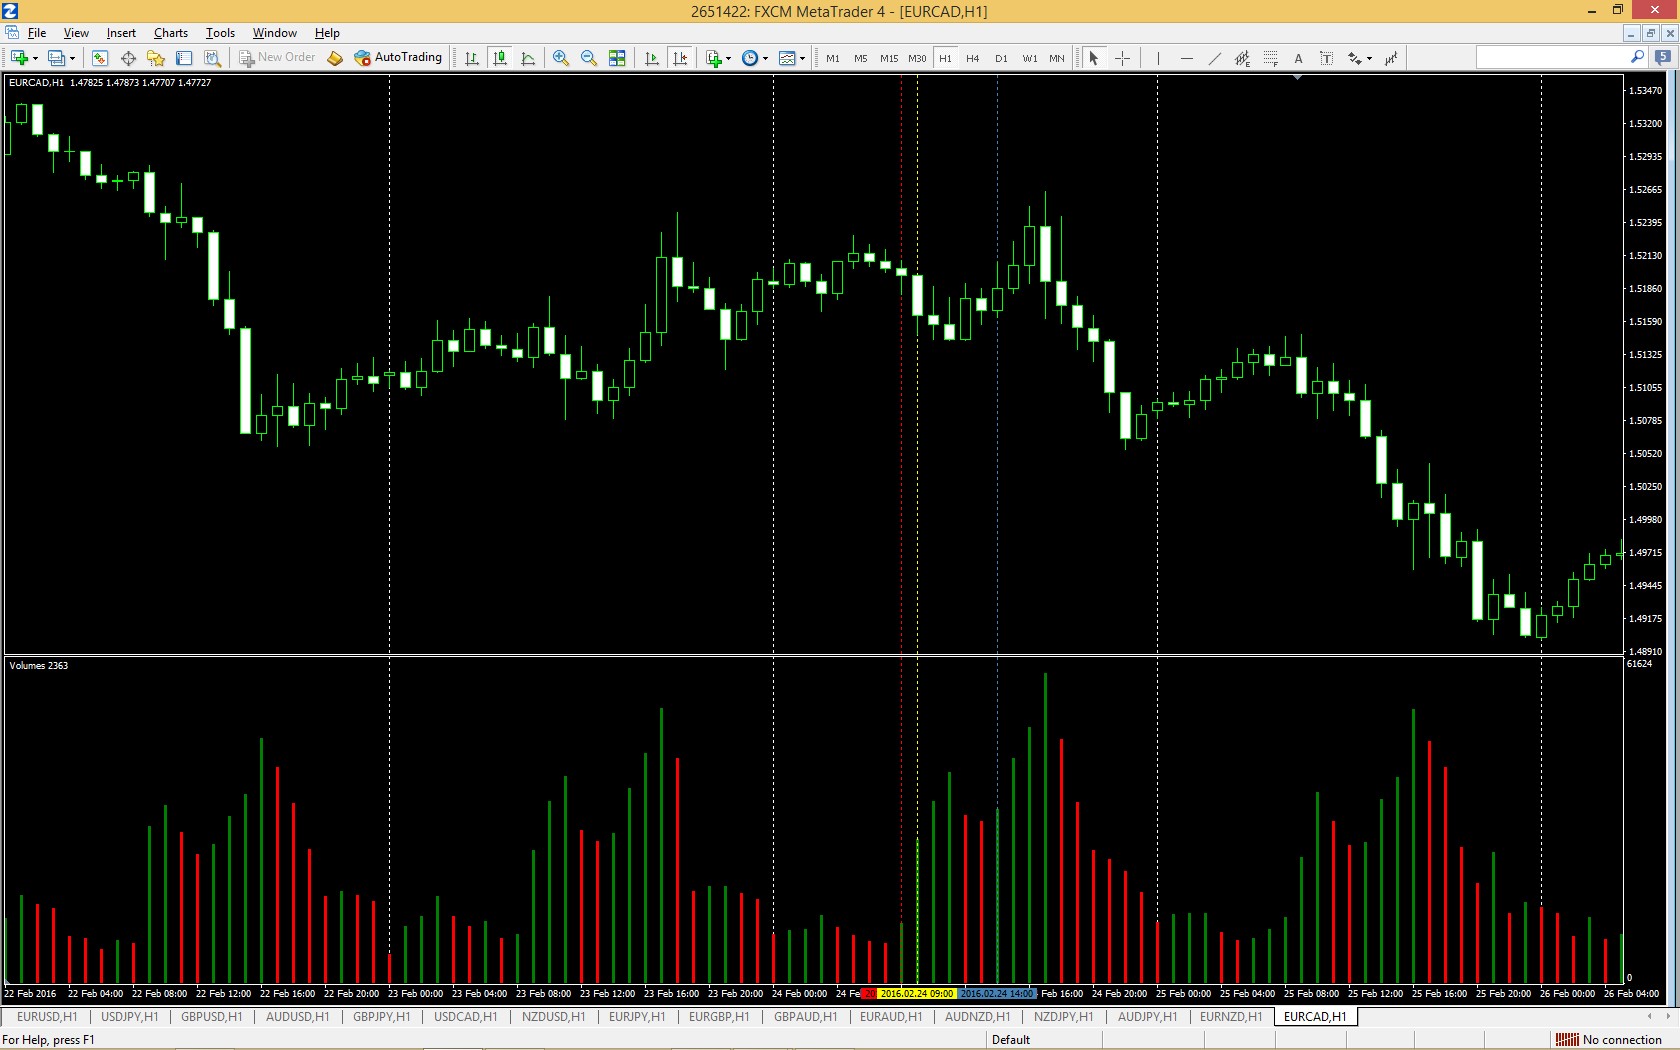
PHASE 1.2 of The Indicator: (The Yellow Line)
(new examples with new charts)
The indicator will wait until the price reaches the red line and then draw another vertical line when the current volume bar closes higher than the red line bar >> for example please look at the new chart pic below.

PHASE 1.3 of The Indicator: (The Blue Line)
Indicator will draw a blue line after 4 volume bars from the yellow line . please take a look at the pic below
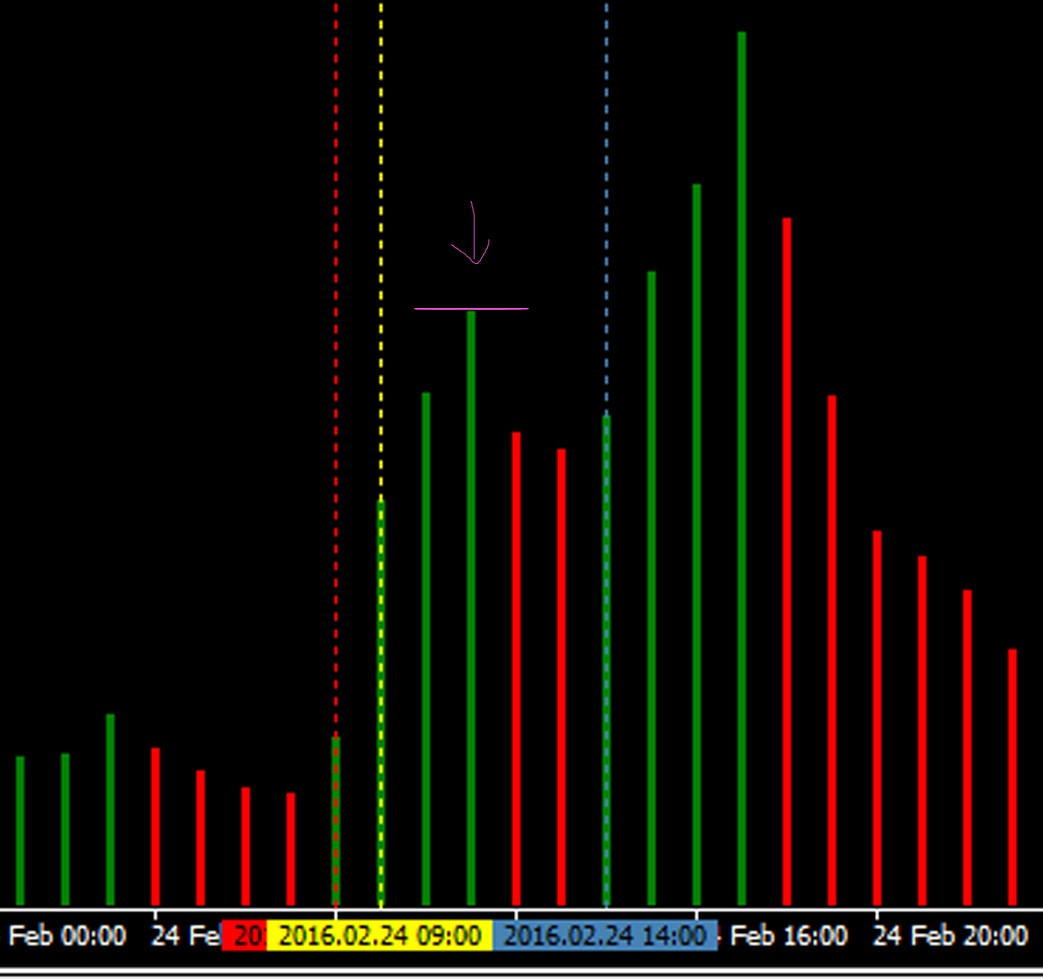
PHASE 1.4 of The Indicator: (Highest Vol Bar Value )
so now i need the indicator to save the highest vol bar value between the yellow and the blue lines . ex...... pic
PHASE 1.4 of The Indicator: (Entry Line)
in the phase i want the indicator to draw another vertical line when the current volume bar closes above (Highest Bar Value) plz see the pic
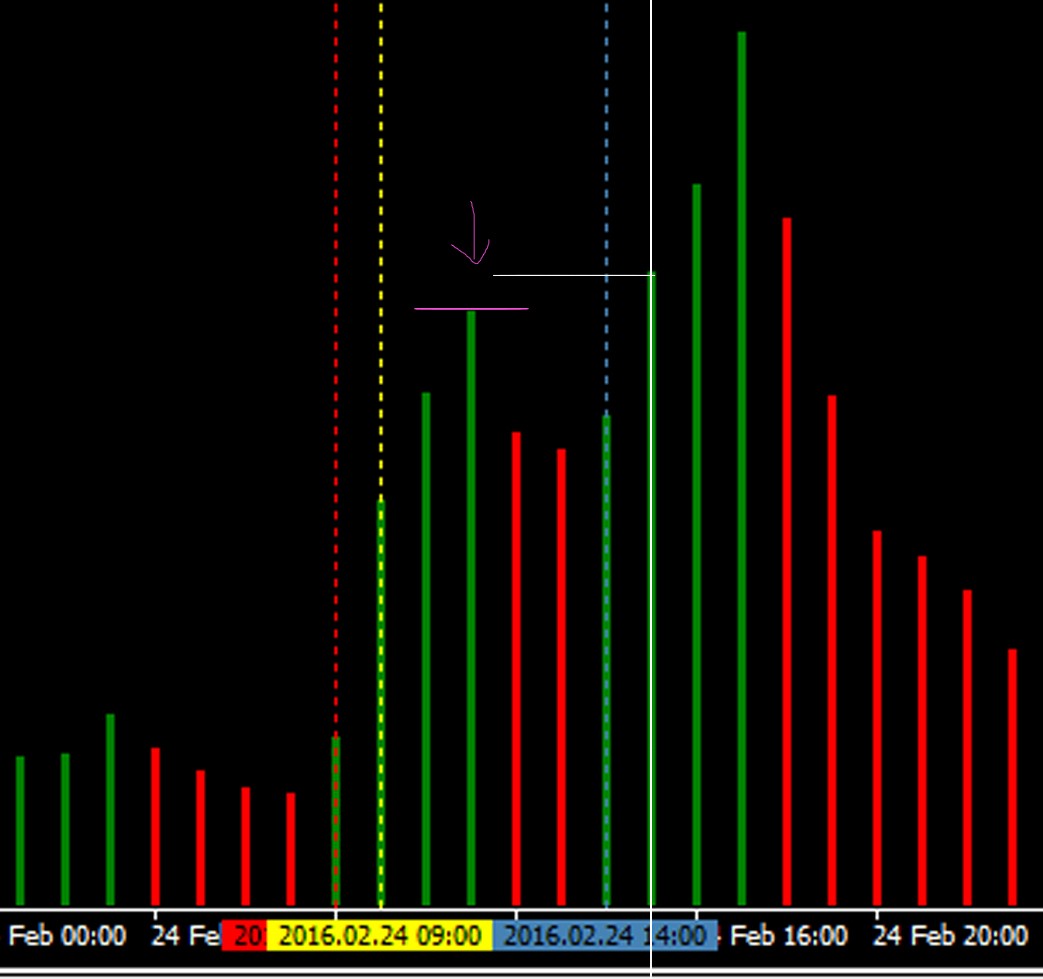
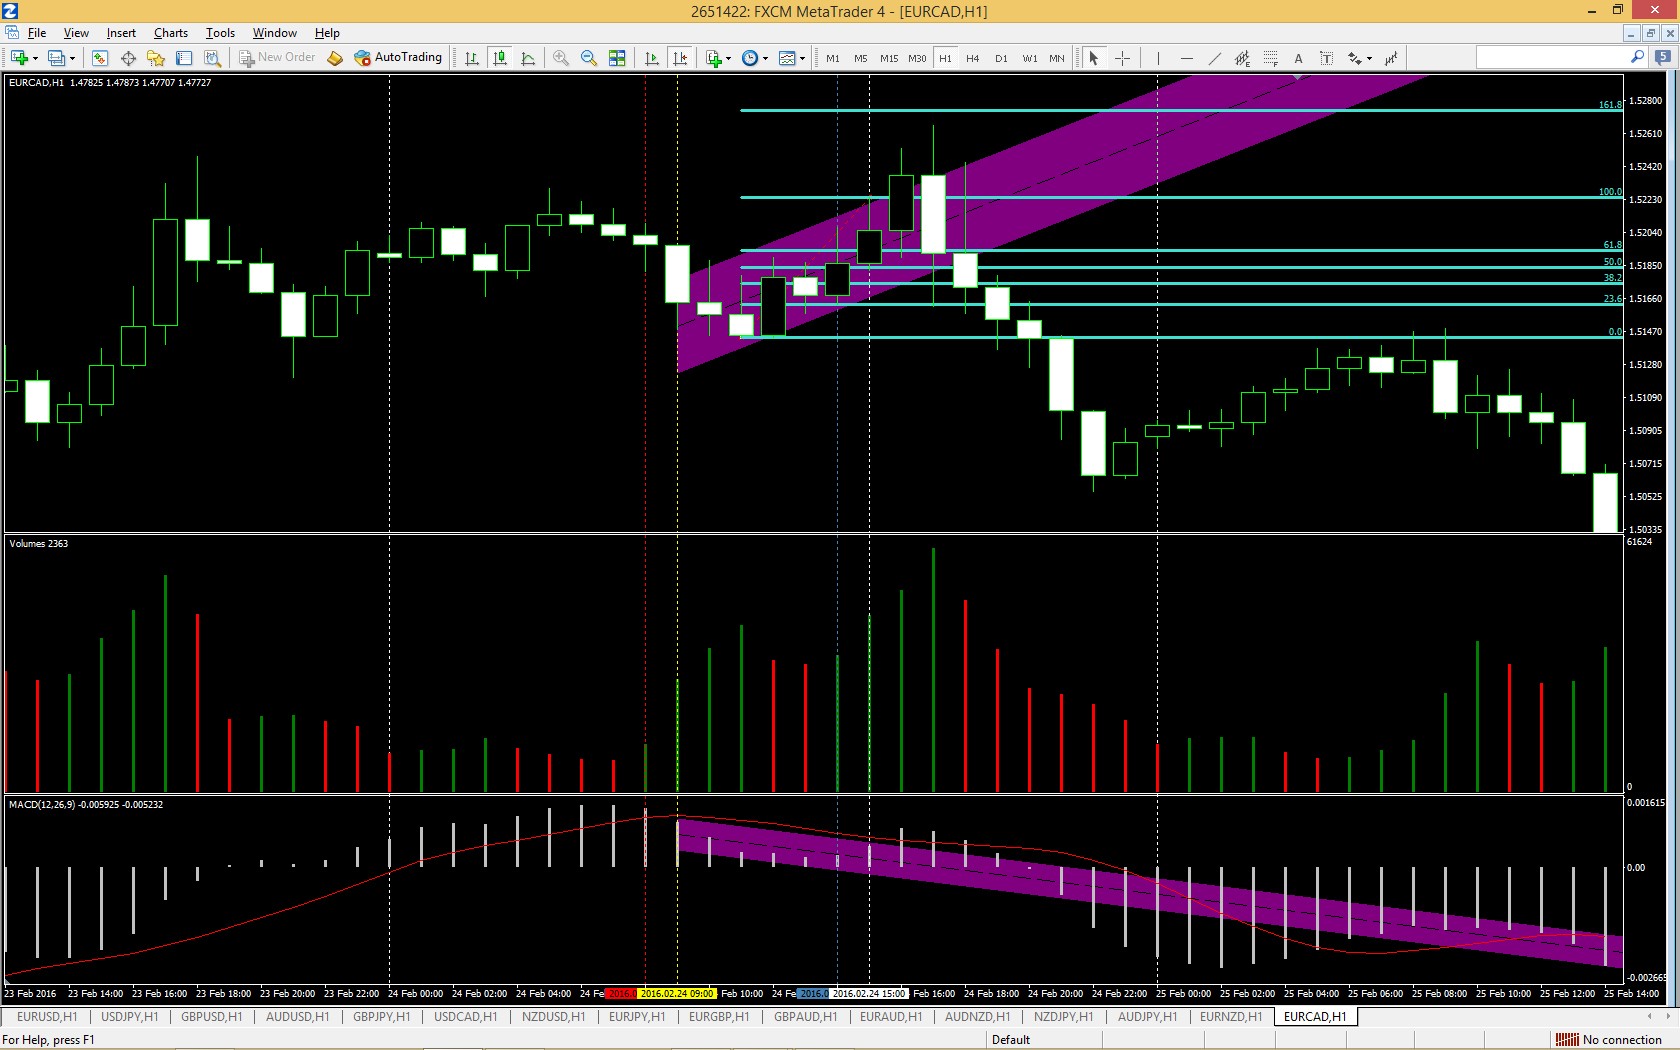
now the final indicator Chart will look like this
PHASE 2 of The Expert: (Quick not detailed Brief)
Now after the indicator has indicated the Volume bars and chart candles its time to make the entry conditions and SL - TP values
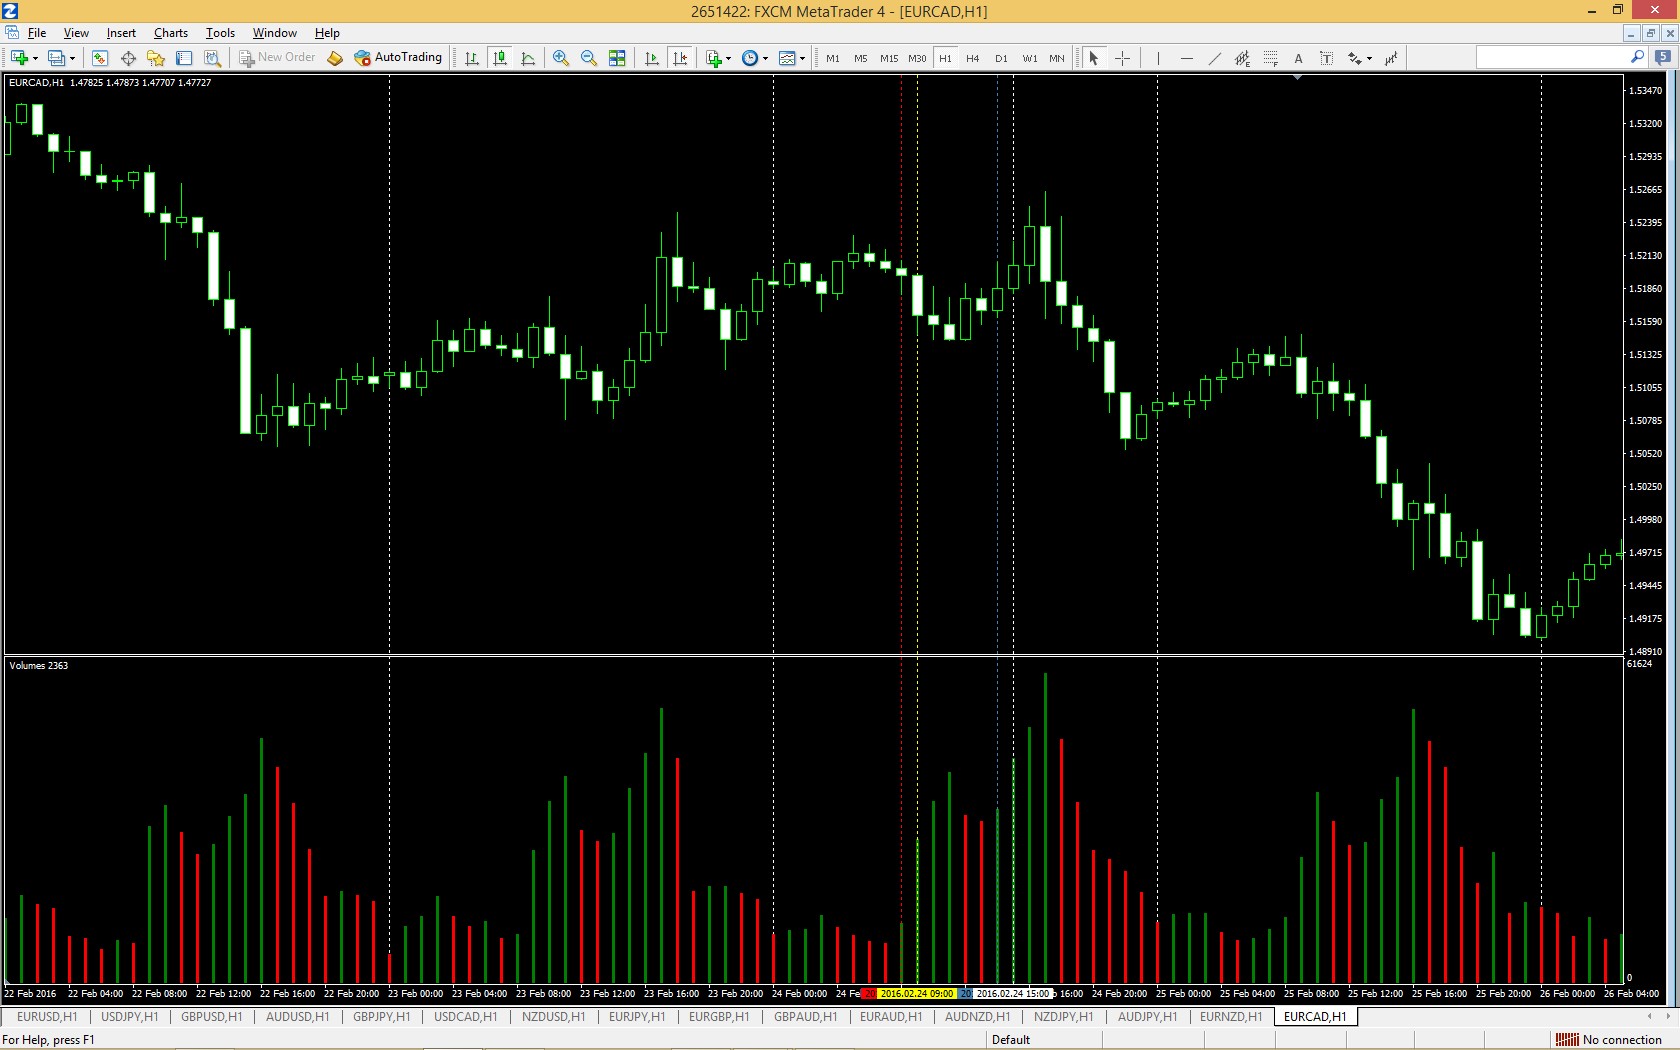
1- The expert will use the candles data between the yellow line and the entry Line ( saving the Highest High and the lowest low ) plz see the pic
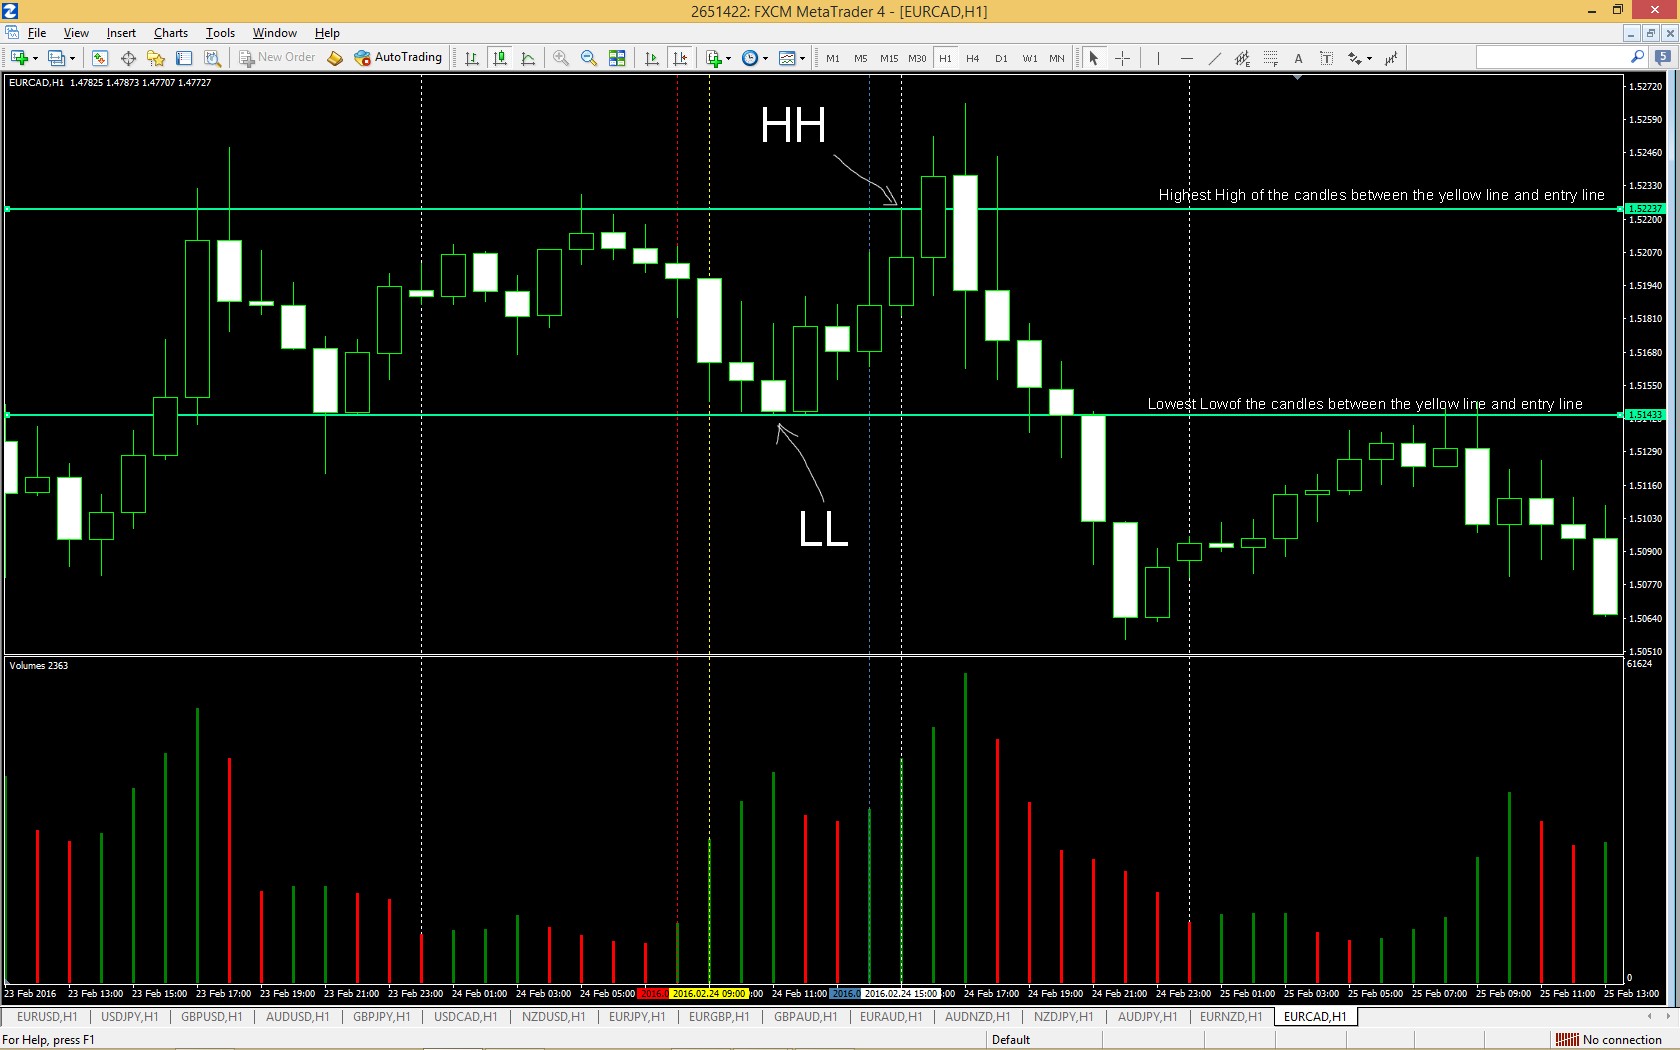
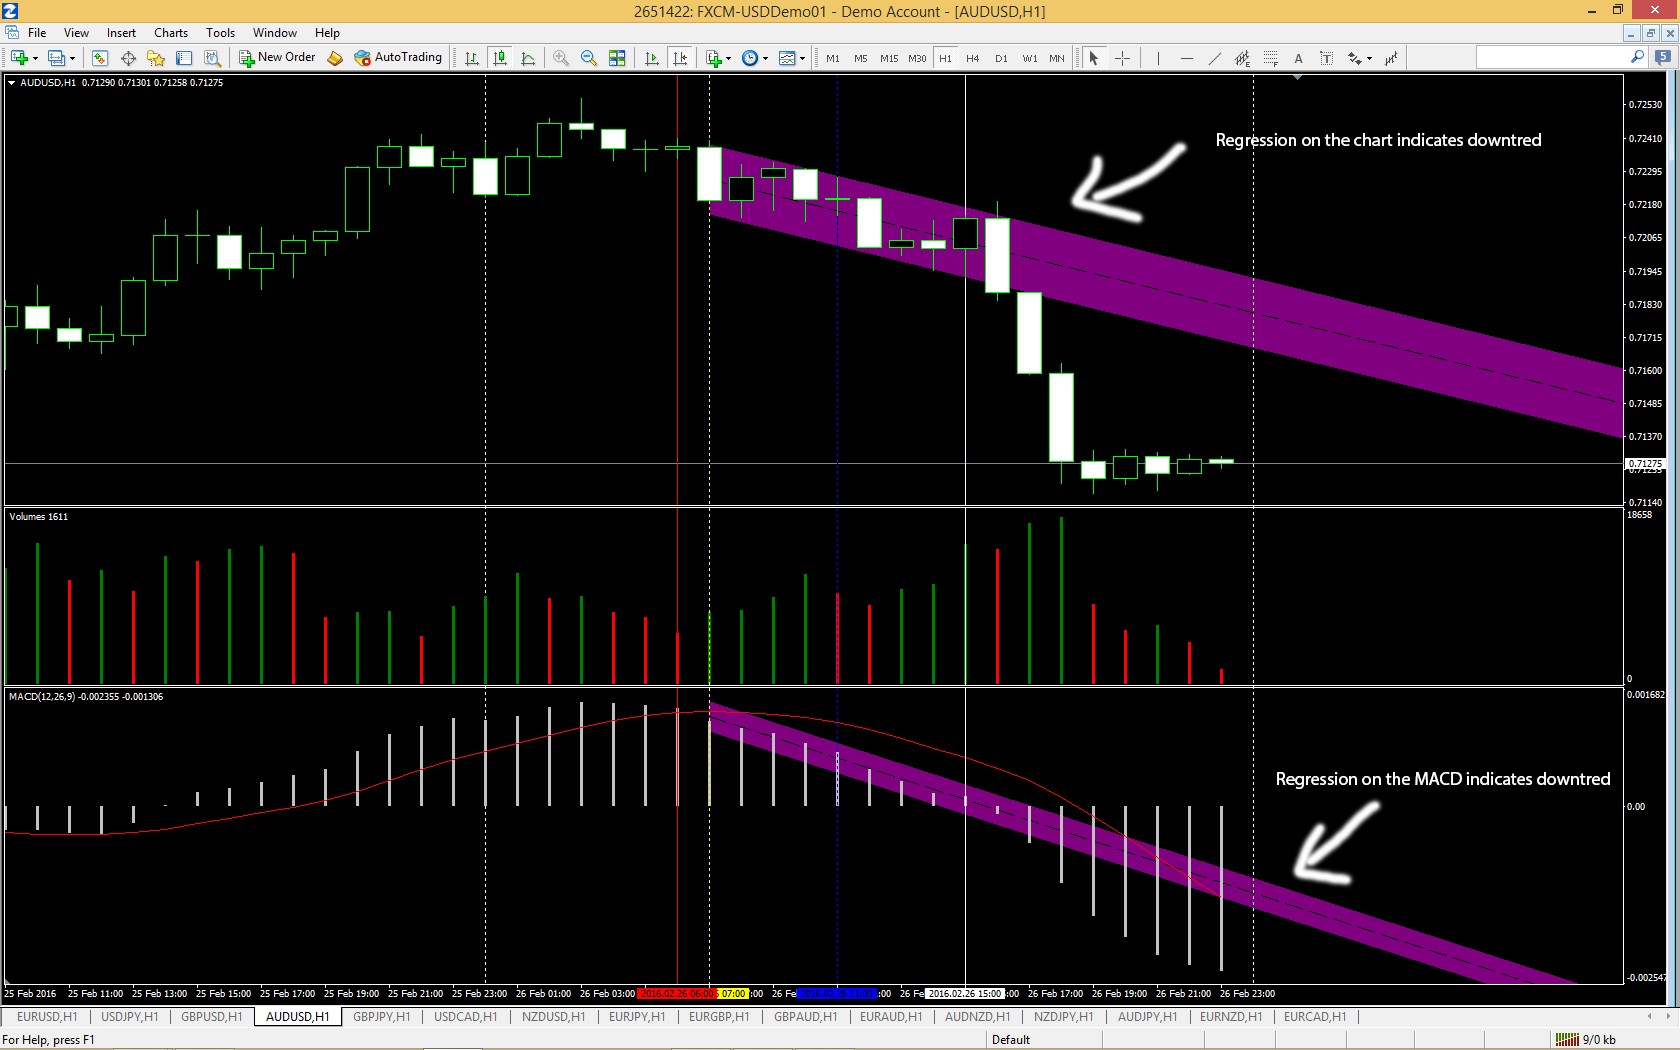
2- The Expert will draw a Regression Channel to determine the trend direction ... draw from the yellow line to the entry line .... look at the pic

3- Expert will draw another Regression Channel on the MACD indicator window to Confirm the market direction, also from the yellow line the entry line.... See the pic
4- Expert will Draw a (INVERSE) Fibonacci retracment lines to determine the TP level (fibo data will be from the high and low between the yellow and the entry line) see the pic
Expert Entries Conditions
1- Candle Close at Entry line provided by the indicator ... If the regression channel on the chart and the Regression Channel on the MACD are both indicating down trend then open sell and if the Regression channels indicates uptrend then open buy order see the pic below
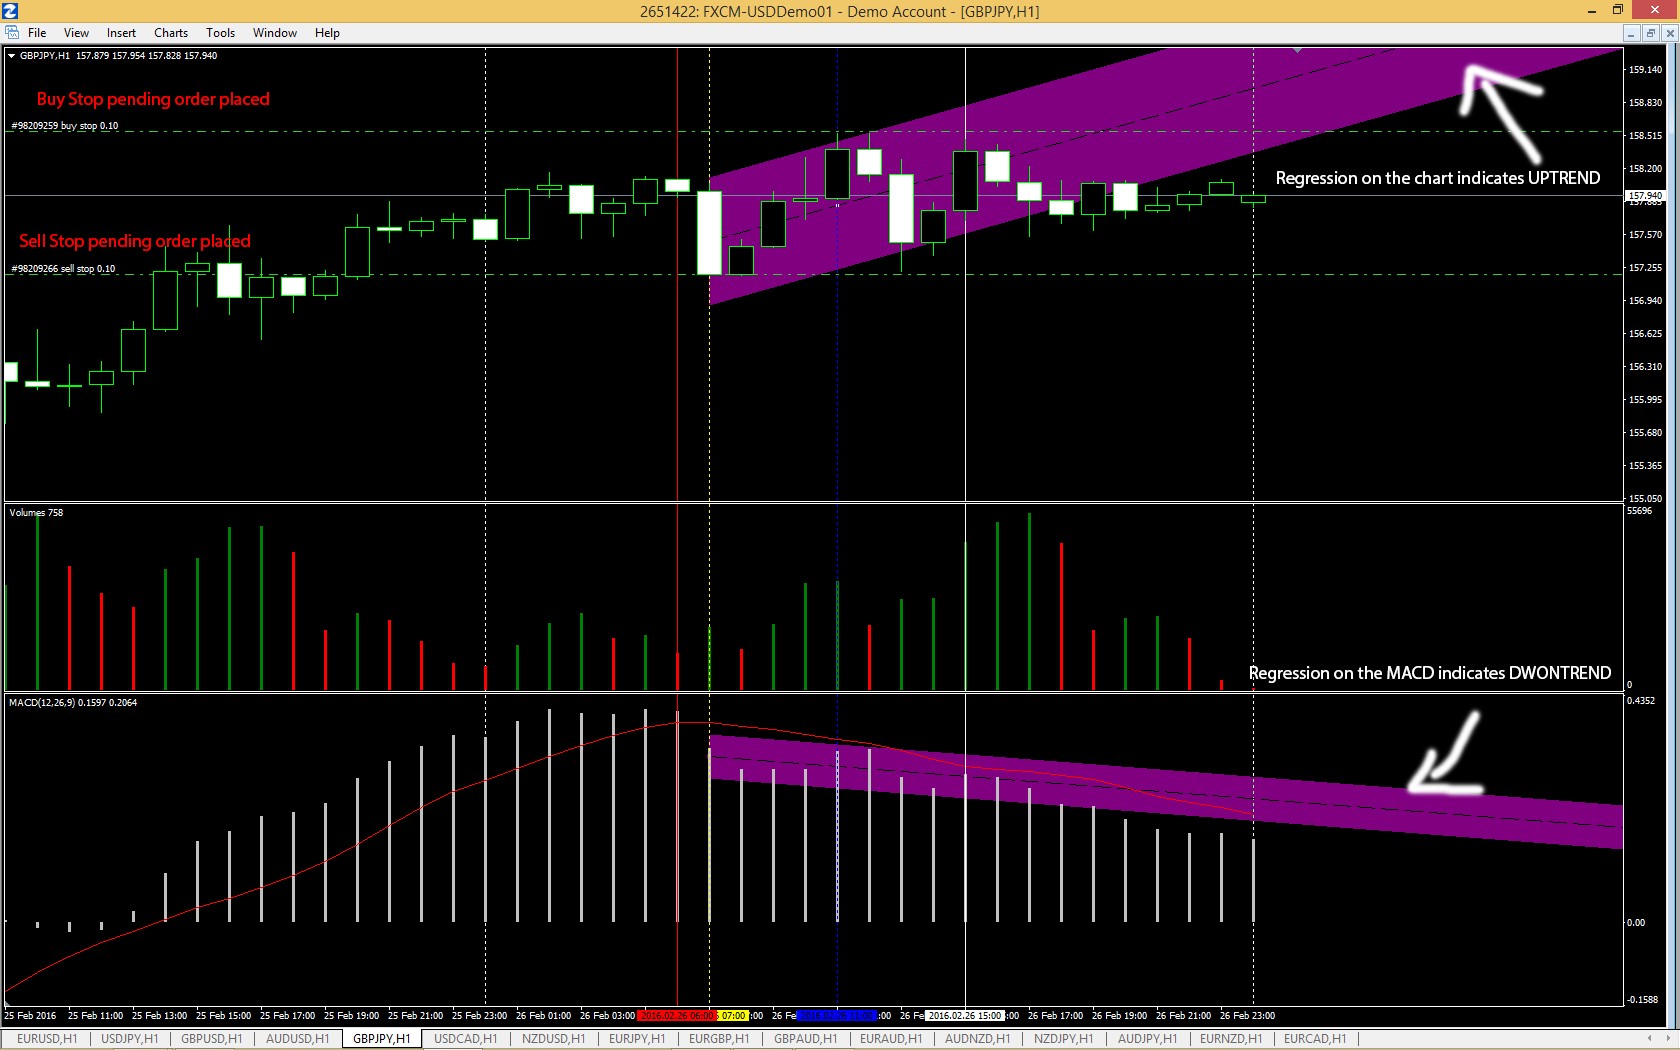
2- If the open position was SELL then the expert will place a Buy Stop order at the Highest high between the yellow line and the entry line... the same condition applies if the expert open BUY order then to place Sell Stop at the Lowest Low between the yellow line and the entry line , This pending order never expires unless the trade was closed on profit then the expert will delete this pending order
3- If the Regression Channel on the chart and the regrerssion channel on MACD are indicating different trend direction then the expert will not open trade BUT will only place Sell Stop order at the lowest low of the candles between the yellow and the entry line, and will place a Buy Stop at the highest high of the candles between yellow and entry lines , see the pic
Profit and Stop Loss
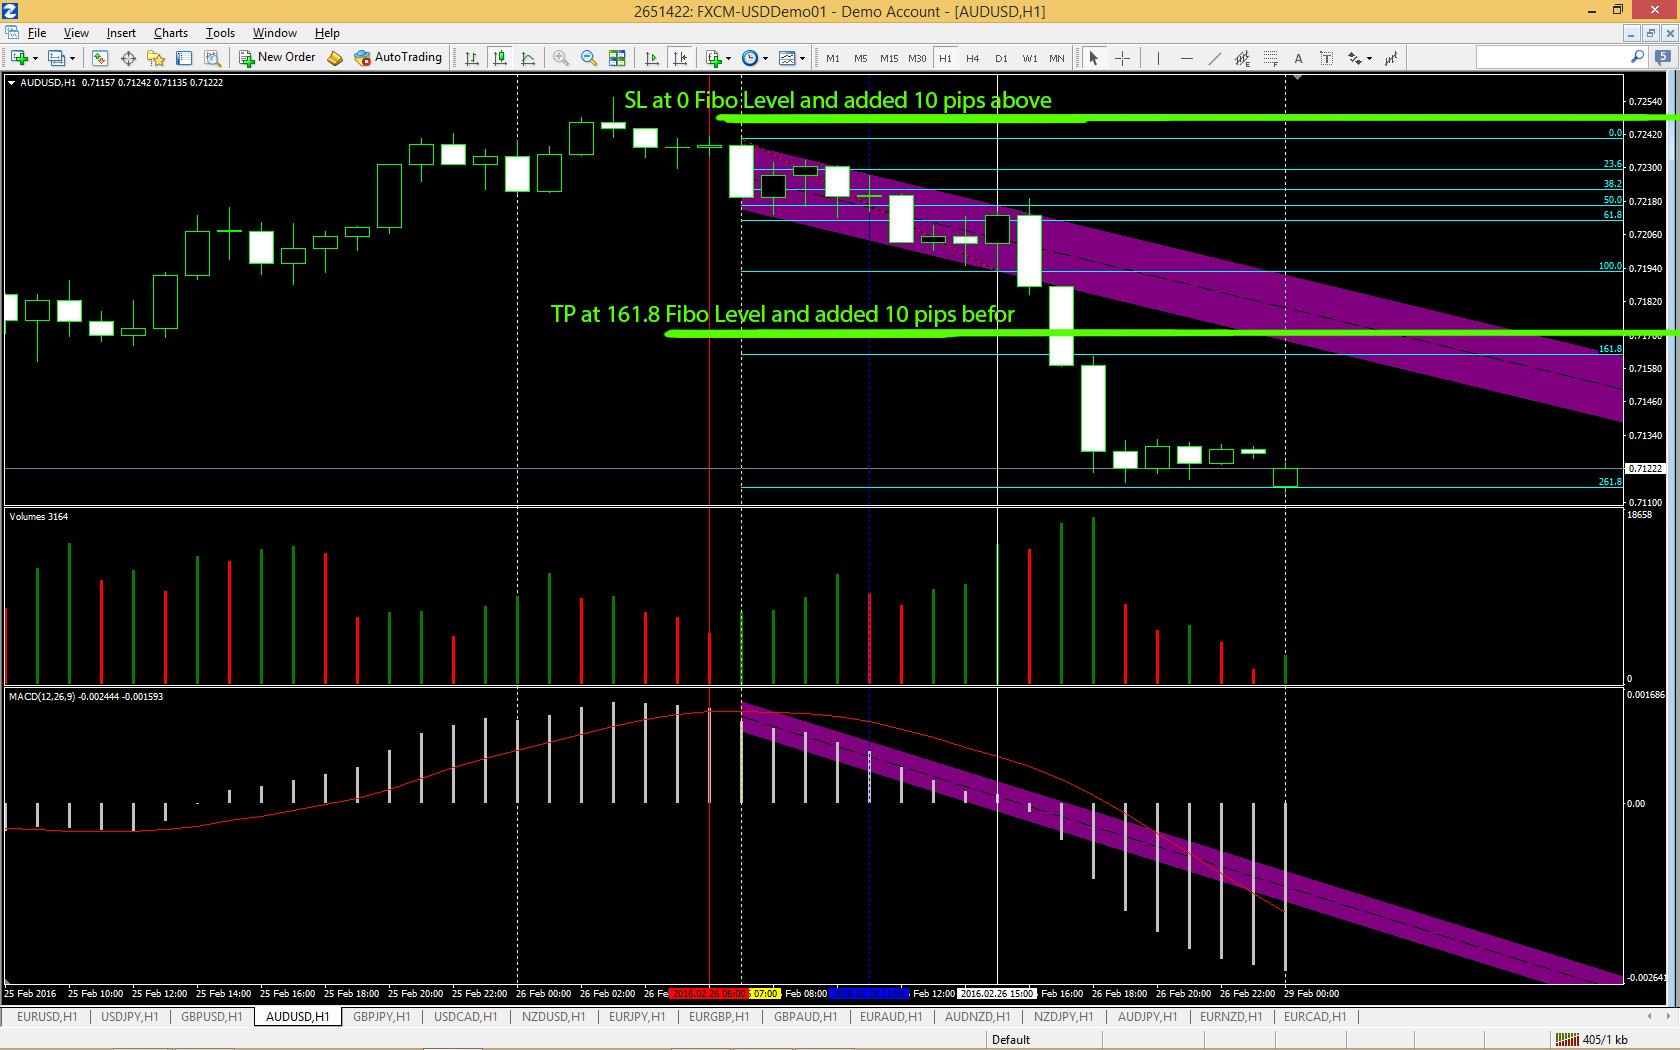
TP will be indicated by the FIBO level (161.8) - 10 pips .... when the regression channel on the chart indicates down trend then the fibo will be drawn from the Lowest Low to the Highest High between the yellow and the entry line, plz see the pic , the oppiste happend with the Uptrend to draw the fibo from the highest high to the lowest low ,SL will the The Fibo line 0 Level and add 10 pips to it these 10 pips calculations will be different from short to long positions but the pic below will describe it in case of sell order opened
Pending Orders TP and SL are calculated the same way above
Expert Input Parameters
1- Magic Number
2- Fibo TP Level (by default 161.8) i want to be able to change it for testing
3- Fibo SL Level (by default 0) i want to be able to change it for testing
4- Trailing ( STOP - GAP - NEW TP) enable & disable
5- Number Of Candles Between The yellow Lines and Entry Line.
6- ATR for profit and Stop (Period - TP x factor - SL x factor) if enabled will override the fibo tp and sl .
7- MACD indicators Values (fast ema - slow ema - sma period)
8- Money management (Balance - Equity)
9- Gab value before SL and top 10 pips by default
10- i want the expert to wait number of seconds befor opening new position even on another currency ... EX ill run the expert on 5 different currencies with different Magic number, and it happend that the expert want to open 5 positions for each cuureny at the same time .. in that point i want to avoid the re quoting issue by telling the expert to wait number of seconds between each trade ... so ineed these seconds value to be as an input parameter.
please again.... i need the Indicator to be done first befor we start with the expert just to make sure the calculations are correct
Thank You