Tâche terminée
Spécifications
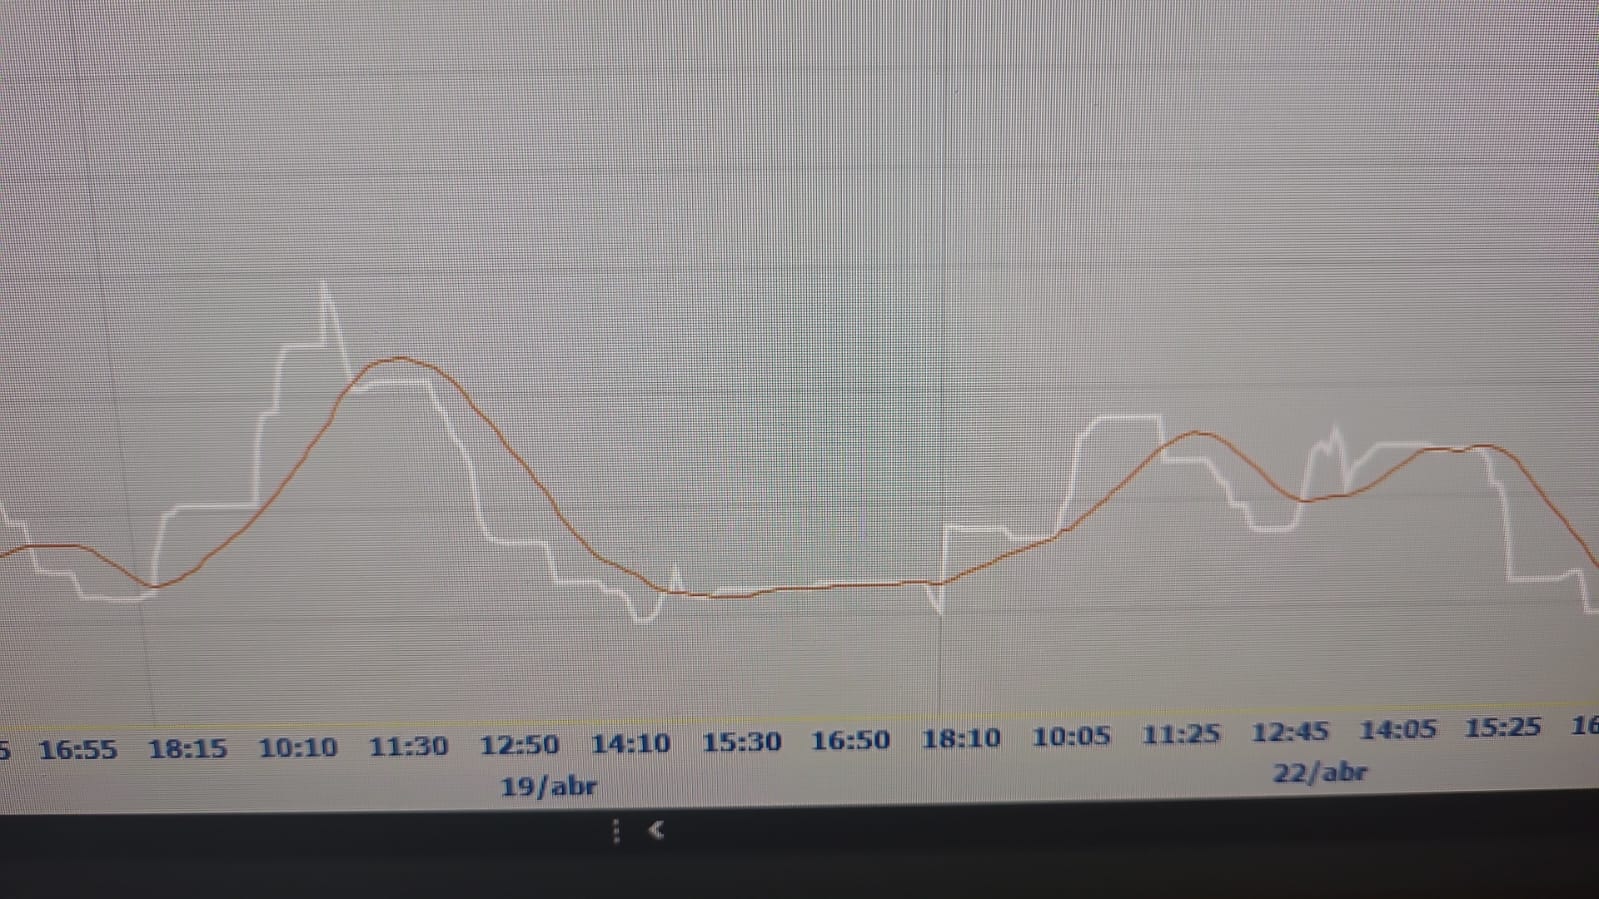
Eu criei um indicador pelo ChatGPT e ele está compilando corretamente mas as linhas que são plotadas na janela separada do indicador MT5 não estão sendo atualizadas corretamente, elas aparecem como linhas retas horizontais e não tem nenhuma variação, e eu não sei programar e não sei como ajustar isso e o chatGPT também não conseguiu resolver.
O código é bem pequeno e básico, acredito ser simples de resolver para quem sabe programar.
Segue o código gerado pelo chatGPT:
//+------------------------------------------------------------------+
//| Custom indicator for MetaTrader 5 |
//+------------------------------------------------------------------+
#property indicator_separate_window
#property indicator_buffers 3
#property indicator_plots 3
#property indicator_type1 DRAW_LINE
#property indicator_type2 DRAW_LINE
#property indicator_type3 DRAW_LINE
#property indicator_color1 DeepSkyBlue // Amplitude
#property indicator_color2 Red // Média da Amplitude
#property indicator_color3 Green // Linha Limite
//--- input parameters
input int PeriodoAmplitude = 30;
input int PeriodoMediaAmplitude = 17;
input double LinhaLimite = 20.0;
//--- indicator buffers
double amplitudeBuffer[];
double mediaAmplitudeBuffer[];
double linhaLimiteBuffer[];
//+------------------------------------------------------------------+
//| Indicator initialization function |
//+------------------------------------------------------------------+
int OnInit()
{
SetIndexBuffer(0, amplitudeBuffer);
SetIndexBuffer(1, mediaAmplitudeBuffer);
SetIndexBuffer(2, linhaLimiteBuffer);
ArraySetAsSeries(amplitudeBuffer, true);
ArraySetAsSeries(mediaAmplitudeBuffer, true);
ArraySetAsSeries(linhaLimiteBuffer, true);
PlotIndexSetString(0, PLOT_LABEL, "Amplitude");
PlotIndexSetString(1, PLOT_LABEL, "Média da Amplitude");
PlotIndexSetString(2, PLOT_LABEL, "Linha Limite");
IndicatorSetString(INDICATOR_SHORTNAME, "Indicador Customizado de Amplitude");
return INIT_SUCCEEDED;
}
//+------------------------------------------------------------------+
//| Custom indicator iteration function |
//+------------------------------------------------------------------+
int OnCalculate(const int rates_total,
const int prev_calculated,
const datetime &time[],
const double &open[],
const double &high[],
const double &low[],
const double &close[],
const long &tick_volume[],
const long &volume[],
const int &spread[])
{
int required = MathMax(PeriodoAmplitude, PeriodoMediaAmplitude);
if (rates_total < required)
return 0;
for (int i = prev_calculated > required ? prev_calculated : required; i < rates_total; i++)
{
amplitudeBuffer[i] = high[iHighest(NULL, 0, MODE_HIGH, PeriodoAmplitude, i)] - low[iLowest(NULL, 0, MODE_LOW, PeriodoAmplitude, i)];
mediaAmplitudeBuffer[i] = iMA(NULL, 0, PeriodoMediaAmplitude, 0, MODE_SMA, PRICE_CLOSE);
linhaLimiteBuffer[i] = LinhaLimite;
// Debugging information
Print("Bar ", i, ": Amplitude = ", amplitudeBuffer[i], ", Media = ", mediaAmplitudeBuffer[i], ", LinhaLimite = ", linhaLimiteBuffer[i]);
}
return rates_total;
}
---------------------------------------------------------------------
Ele deveria ficar como na imagem anexo...