I’m looking for an experienced MT4 developer to create a custom indicator (or EA) with mobile push notifications based on the following strategy. Trend Filter (Daily Timeframe) Daily Close above 50 EMA = Bullish Bias Daily Close below 50 EMA = Bearish Bias Entry Timeframe (H1) RSI Settings RSI Period: 14 (default) Upper Level: 65 Lower Level: 35 Buy Signal Generate a BUY signal when: Daily bias is Bullish (Daily
Hello, I'm looking for EA or indicator that would help me reach at least 0.5 lot daily on XAUUSD pair. I trade with 30-35 spread on live standard account. 0.3 to 0.5 lot on XAUUSD is all i need per day, without losing too much money during week or month doing that. Every advice od product is welcome. tg @stellarcptadmin
✅ MT4 EA Developer Checklist (For Your Ladder EA) 1️⃣ Indicator Integration EA reads signals from provided custom indicator (.ex4 or .mq4) Detects “Buy Next” / “Sell Next” signals on current candle Works with arrow-based or buffer-based signals 2️⃣ Next Candle Execution EA does not trade on the candle where the signal appears Orders placed only at first tick of the next candle Timeframes supported: M1, M5, M15
Hello, i need expert developer that have been develop so many profitable AI bots that work for mt5 and ctrader autonomously if you know you can easily execute this requirement bid for it. NOTE:- YOU MUST COME WITH SAMPLE FOR THE 2 TRADING PLATFORM. While i take a look at your profile and reach out to you thanks
I am looking for an experienced MT4/MT5 developer to analyze my trading history and replicate the strategy in a new Expert Advisor (EA). The developer must have proven experience in reverse engineering strategies, analyzing trading data, and developing EAs across various trading methodologies. A deep understanding of XAUUDS and BTCUSD behavior, as well as chart analysis, is essential. Please note that we do not have
I am in need of a good scalping bot for gold or any currency pair. If you have one that is working, reach out. You must be able to provide a trial version so I can test the bot myself
I am in need of a good scalping bot for gold or any currency pair. If you have one that is working, reach out. You must be able to provide a trial version so I can test the bot myself
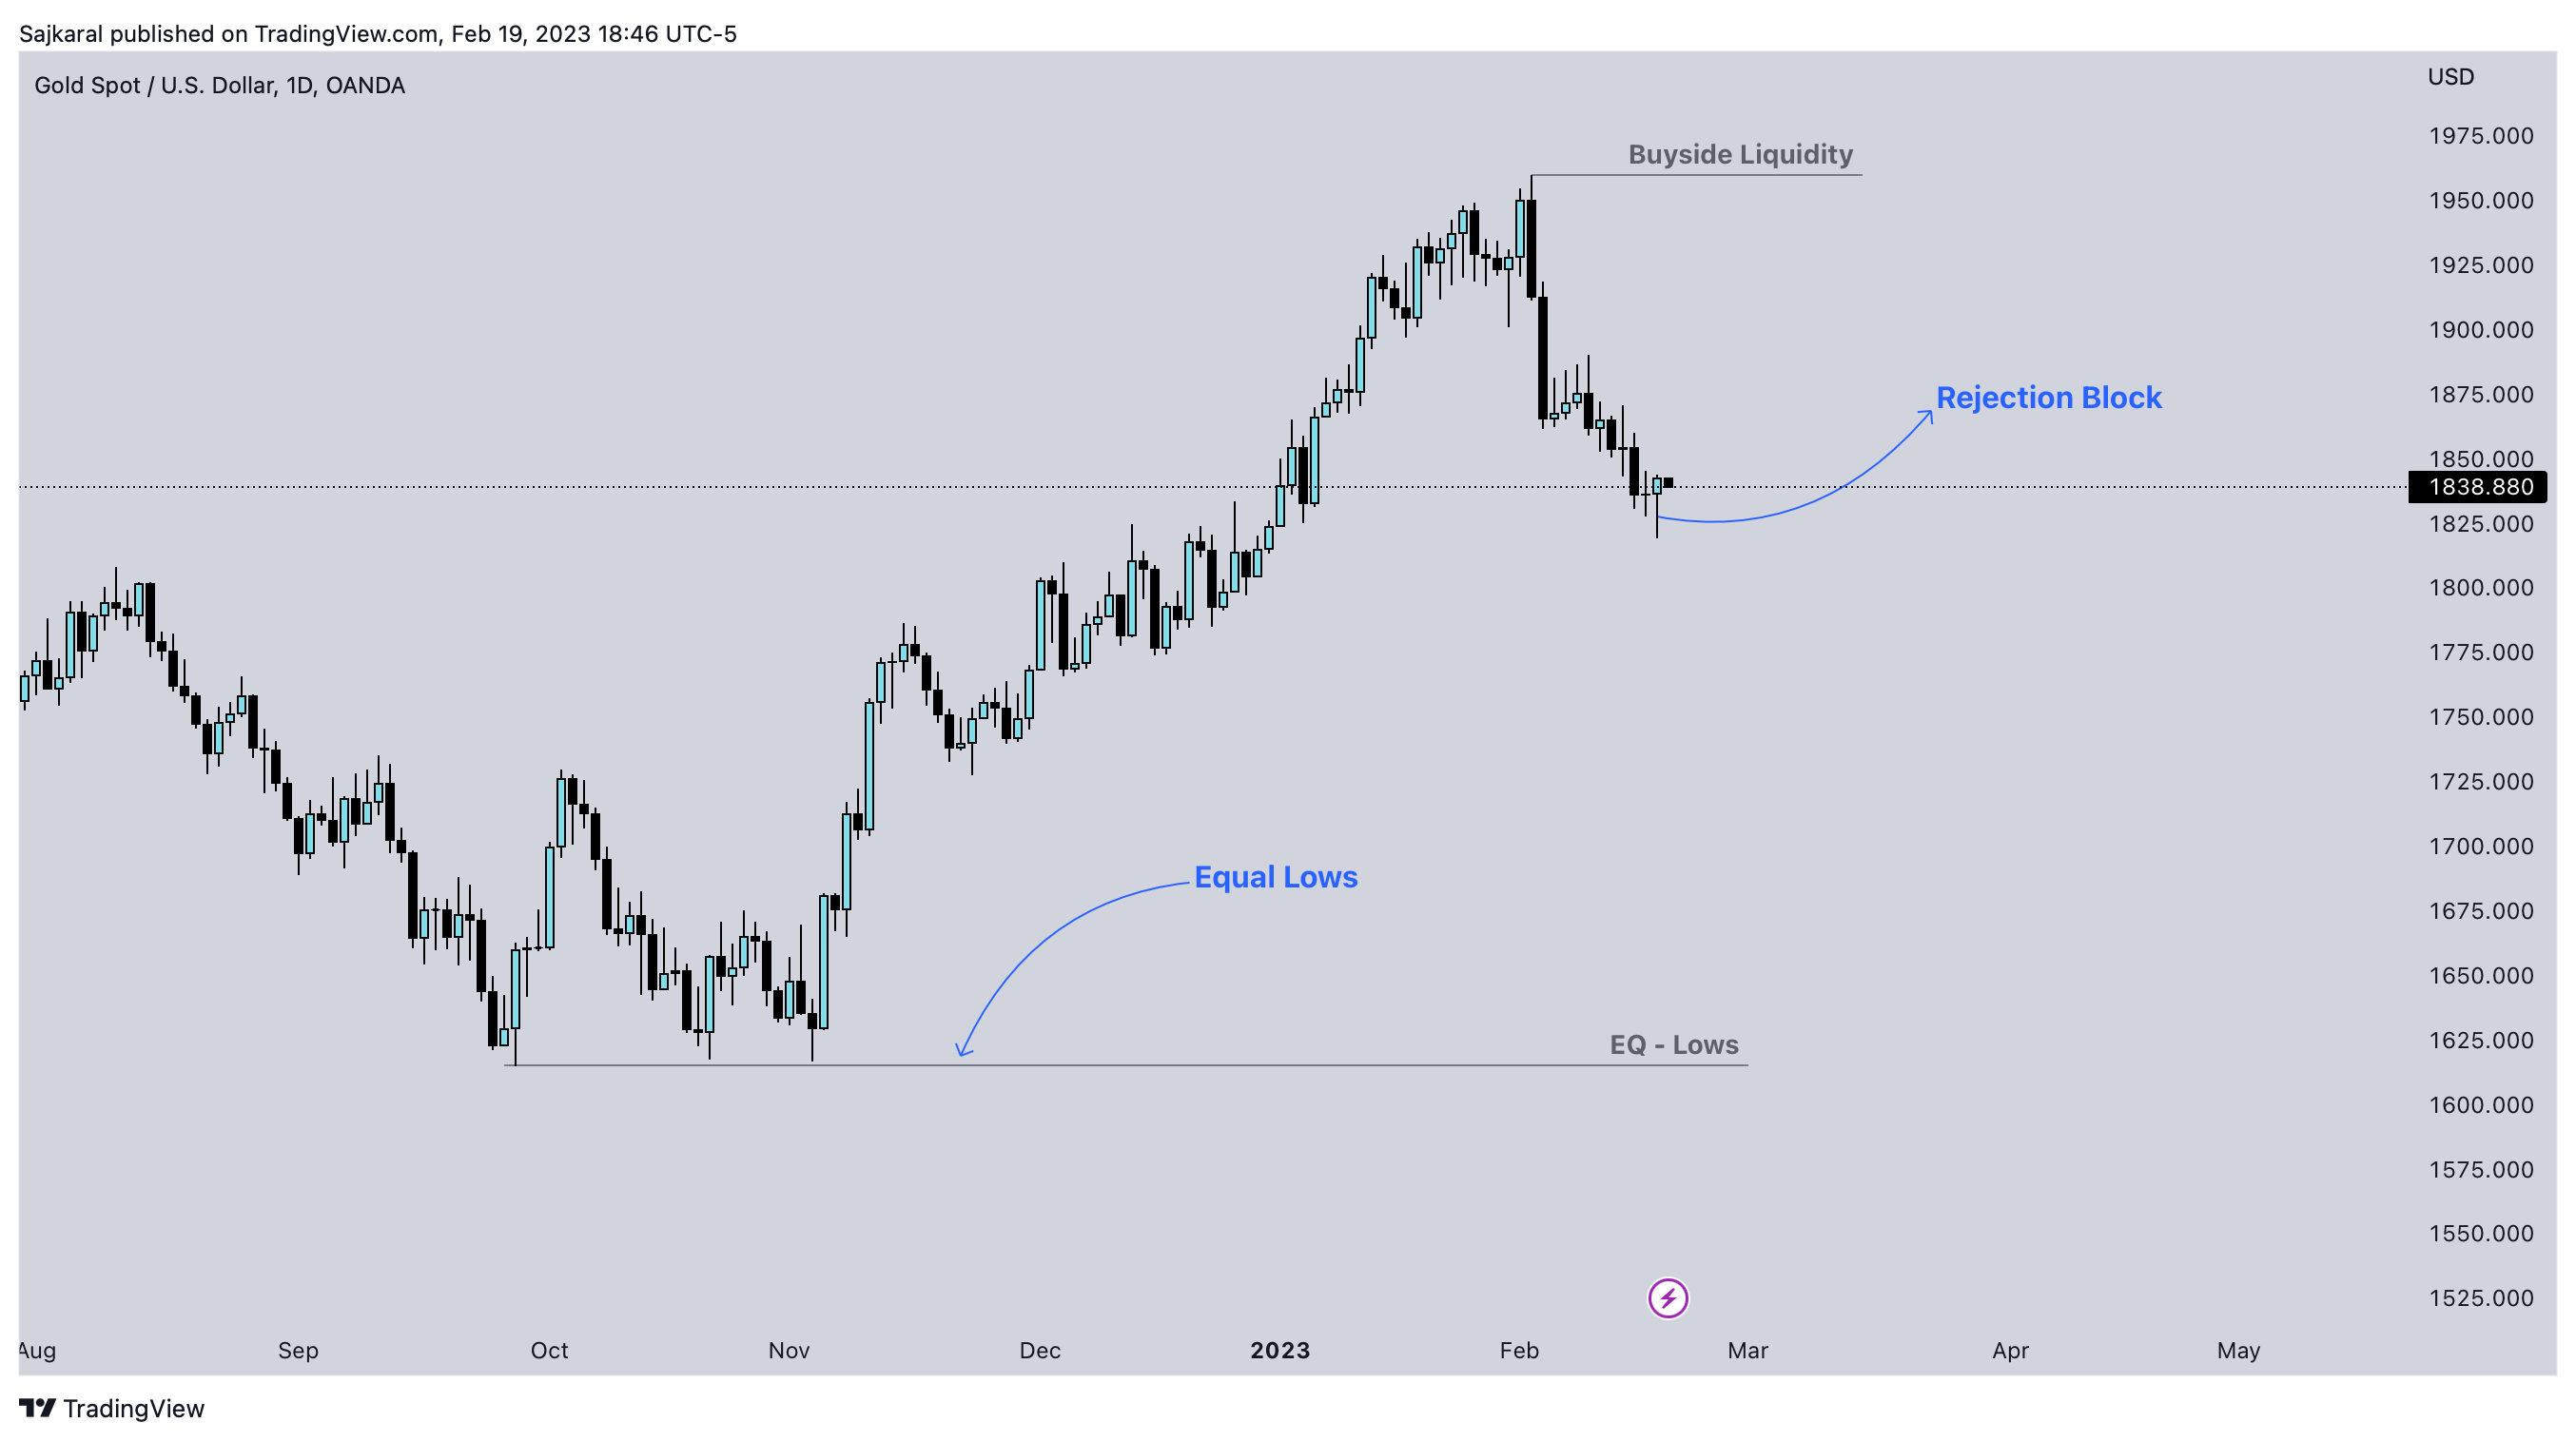
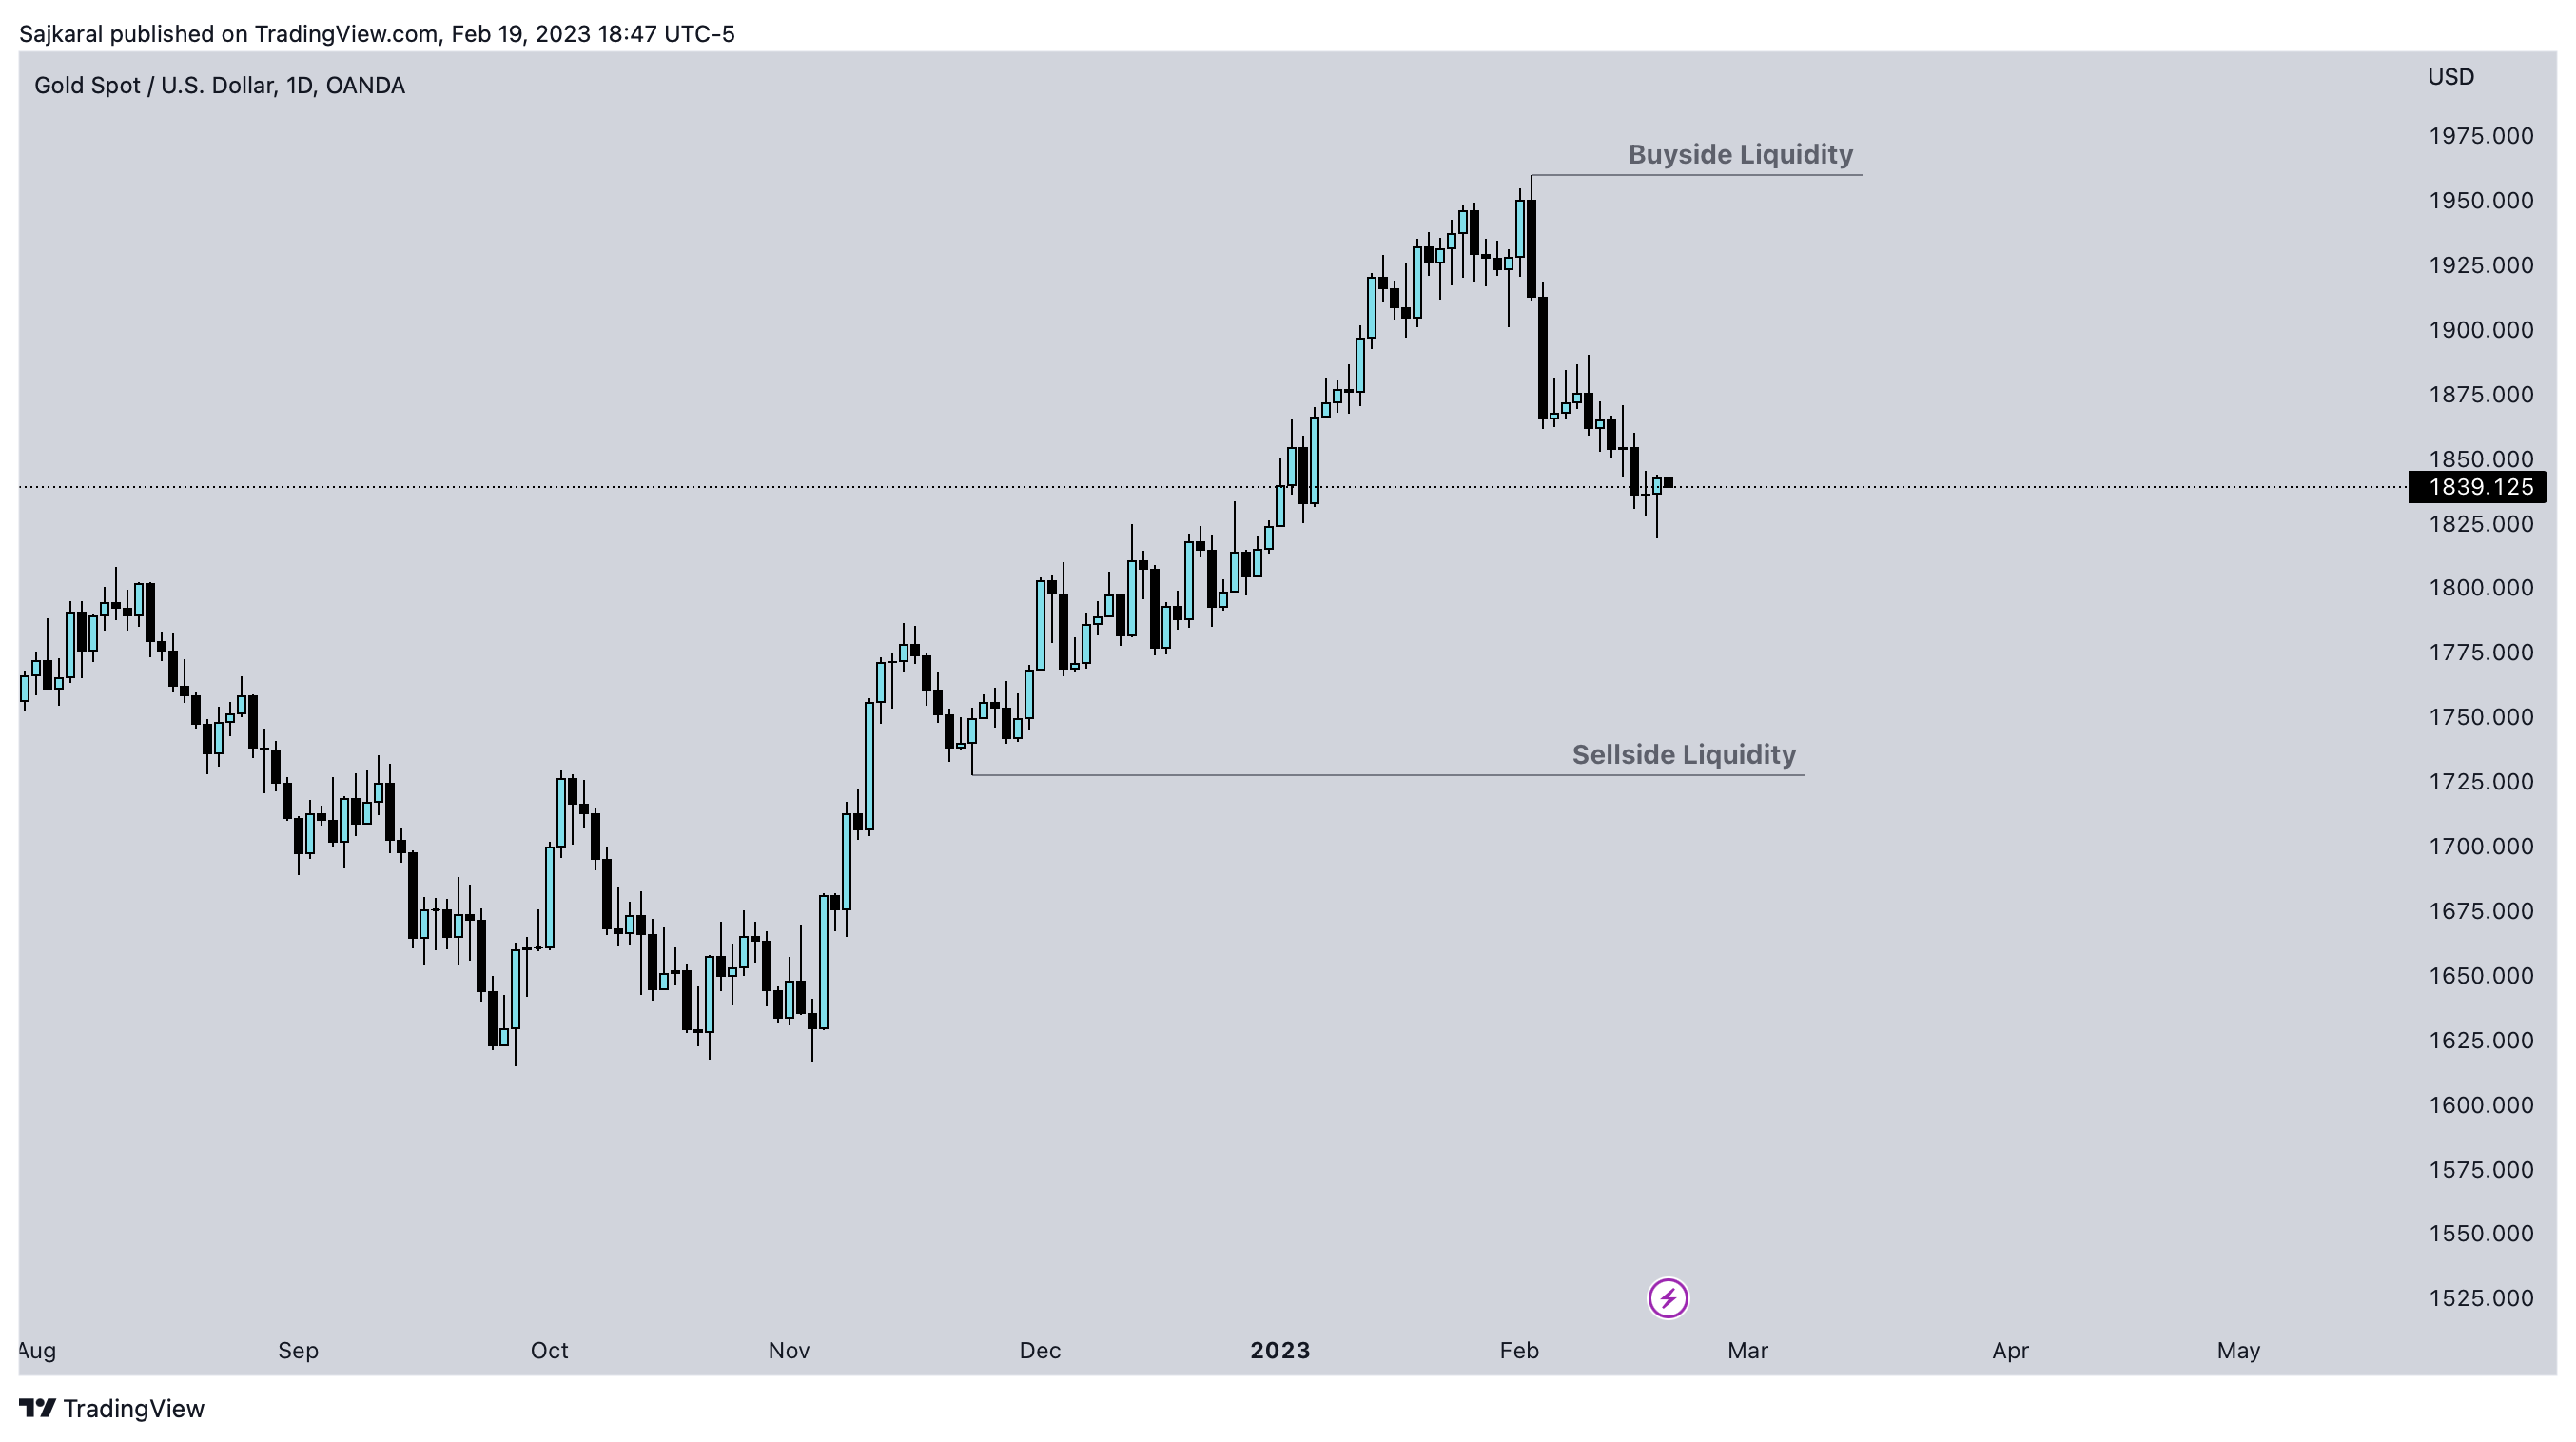
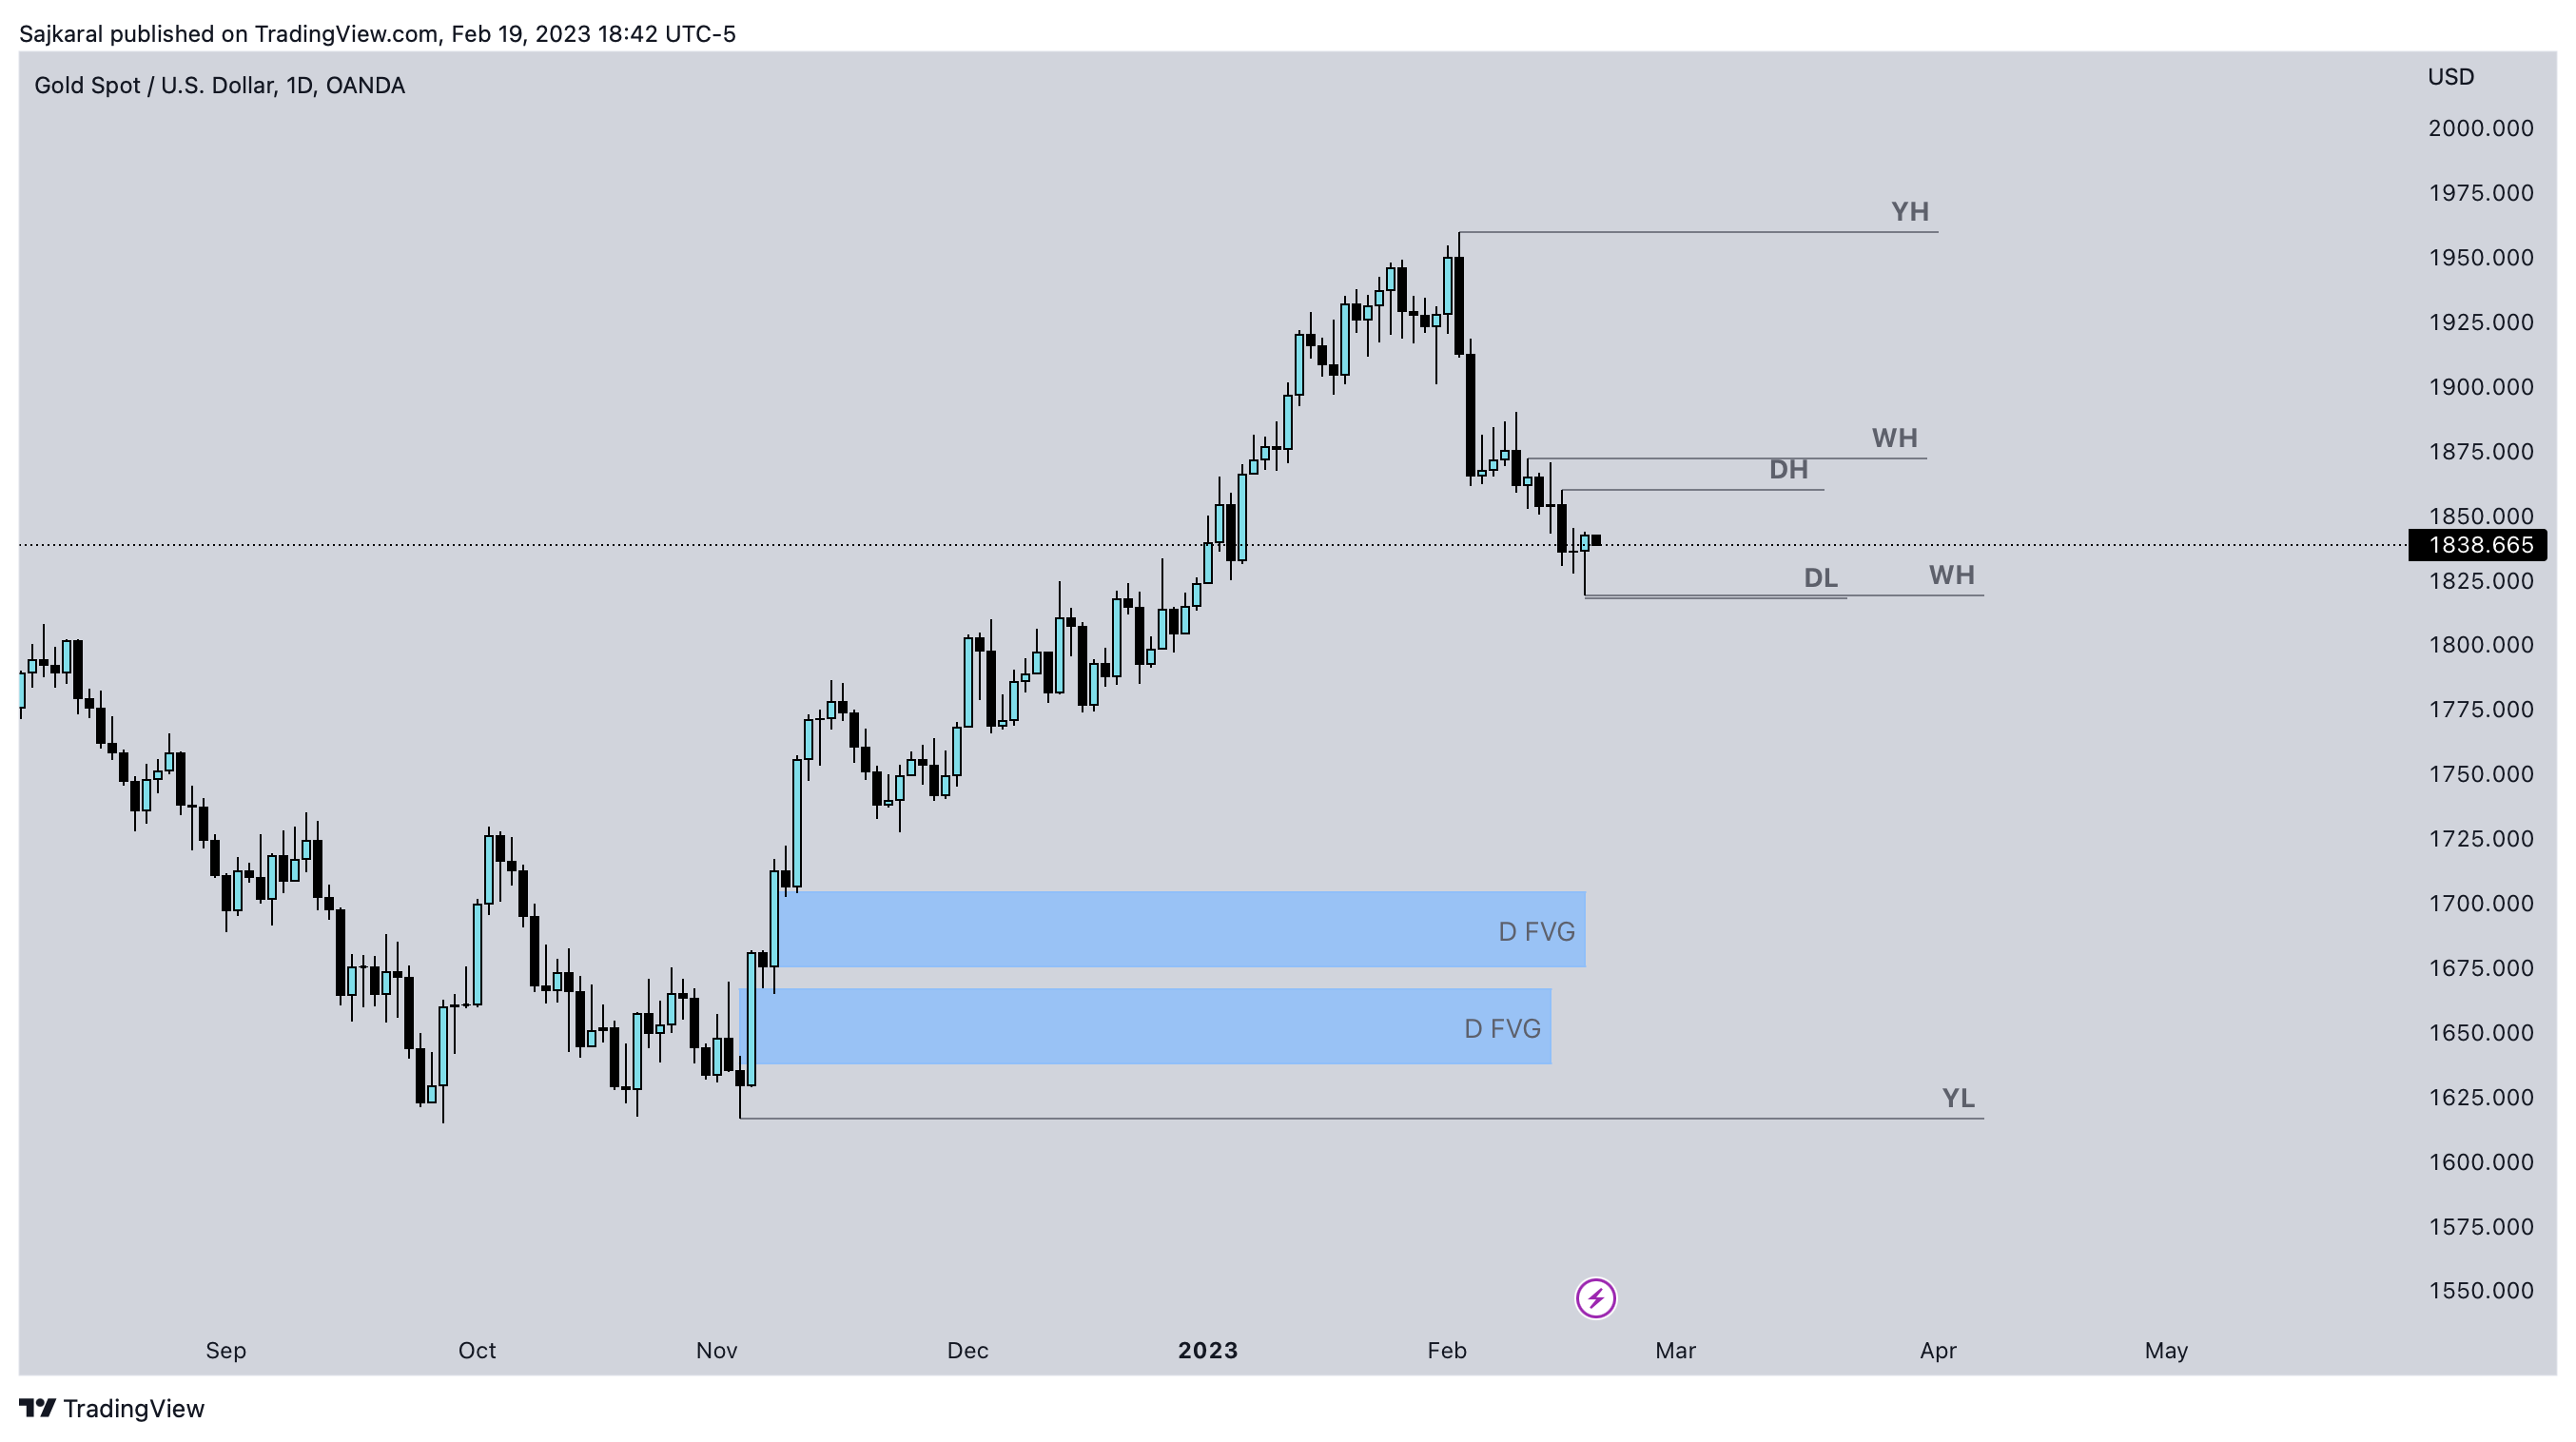
i have built a indicator on trading view which is veryt good, its based on liquidity sweeps on stop losses. im looking for an someone with experience in trading and indicators that has worked on similar strategy indicators. it already wins lots of very good trades im looking to tighten up on uneccesary trades it may send to clean it up as i currently am testing it out running to signal channel and want it the best /
I am looking for an experienced MQL5 developer to create a custom indicator for MetaTrader 5. The project requirements and indicator logic will be shared privately with the selected candidate to protect the concept and implementation details. Requirements: Strong experience with MQL5 indicator development. Ability to create clean, efficient, and well-structured code. Experience with custom buffers, chart objects
Generate a signal and place 2 arrows on the chart when these conditions happen. Rules: Levels up:price is below the Kijunsen and Senku A value is less than Senku B value Kijun sen close = previous kijun sen close; Kijun sen close value is LESS than Senku B close value Senkou B close = previous senku B close. Levels down: price is above Kijunsen. Senku A value is above Senku B value