Toutes les commandes
 Règles
Spécifications
I need an indicator developed that will have parameters/options for the Bollinger Band, MACD (Histogram), Stochastics (x2), and CCI (x2). The logic is fairly straight forward and much of the parameters are duplicated across the indicators, with only minor adjustments.
Below are the rules and logic:
Bollinger Band Parameters
Bollinger Band Period
Bollinger Band Deviation
Trade Entry SHORT (High/Low/Open/Close) Choose option
Trade Entry LONG (High/Low/Open/Close) Choose option
Show Historical (TRUE/FALSE) ***This refers to showing previous signals
Show Label (Left top/Left bottom/Right top/Right bottom) Choose option (Top and bottom refer to either ABOVE the ENTRY LINE or BELOW the ENTRY LINE)
Target 1 (Numerical Value)
Target 2 (Numerical Value)
Target 3 (Numerical Value)
Target 4 (Numerical Value)
Target 5 (Numerical Value)
Target 6 (Numerical Value)
Line Style
Entry Line color
Entry Line style
Entry Line width
Target Lines color
Target Lines style
Target Lines width
Stop Line color
Stop Line style
Stop line width
Label Style
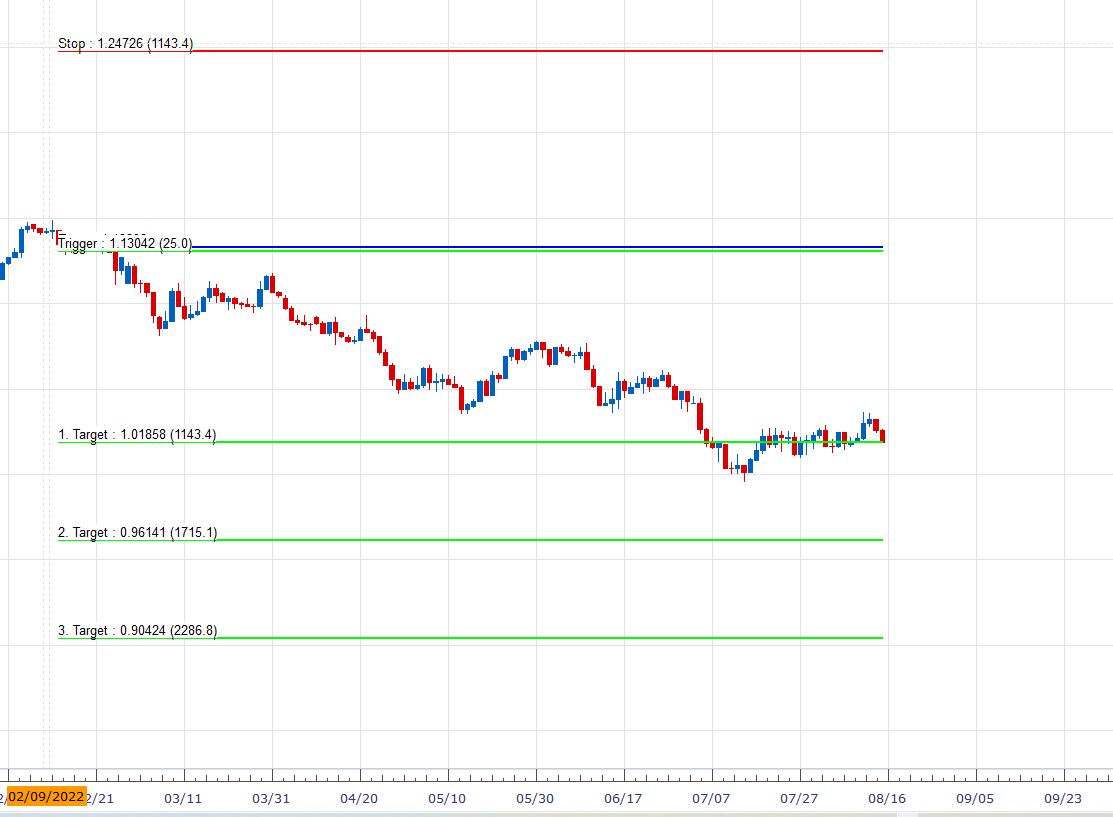
***The LABEL refers to a box drawn around the price values printed by the indicator. Please see the image CCI Example for an example of what this should look like***
Add Label Background (True/False)
Label Text Color
Label Text Size
Lebel Background Color
Arrow Style
SHORT style (For example, 238)
SHORT color
SHORT width
LONG style (For example,. 236)
LONG color
LONG width
Function
Use Bollinger Band Signal (True/False) ***This parameter indicates whether the Bollinger Band Signal will be shown on the chart or not
Use Bollinger Band Oscillator (True/False) ***This parameter indicates whether the Bollinger Band Oscillator will be shown in a separate indicator window
The indicator logic for the Bollinger Band is simple and is based off of the OUTER BANDS. For SHORT signal, price simply has to close BELOW the LOWER BAND. For LONG Signal, price simply has to close above the UPPER band.
MACD Histogram Parameters
Fast EMA
Slow EMA
MACD SMA
Trade Entry SHORT (High/Low/Open/Close) Choose option
Trade Entry LONG (High/Low/Open/Close) Choose option
Show Historical (TRUE/FALSE)
Show Label (Left top/Left bottom/Right top/Right bottom) Choose option (Top and bottom refer to either ABOVE the ENTRY LINE or BELOW the ENTRY LINE)
Target 1 (Numerical Value)
Target 2 (Numerical Value)
Target 3 (Numerical Value)
Target 4 (Numerical Value)
Target 5 (Numerical Value)
Target 6 (Numerical Value)
Line Style
Entry Line color
Entry Line style
Entry Line width
Target Lines color
Target Lines style
Target Lines width
Stop Line color
Stop Line style
Stop line width
Label Style
***The LABEL refers to a box drawn around the price values printed by the indicator. Please see the image CCI Example for an example of what this should look like***
Add Label Background (True/False)
Label Text Color
Label Text Size
Lebel Background Color
Arrow Style
SHORT style (For example, 238)
SHORT color
SHORT width
LONG style (For example,. 236)
LONG color
LONG width
Function
Use MACD Signal (True/False) ***This parameter indicates whether the MACD Signal will be shown on the chart or not
Use MACD Oscillator (True/False) ***This parameter indicates whether the MACD Oscillator will be shown in a separate indicator window
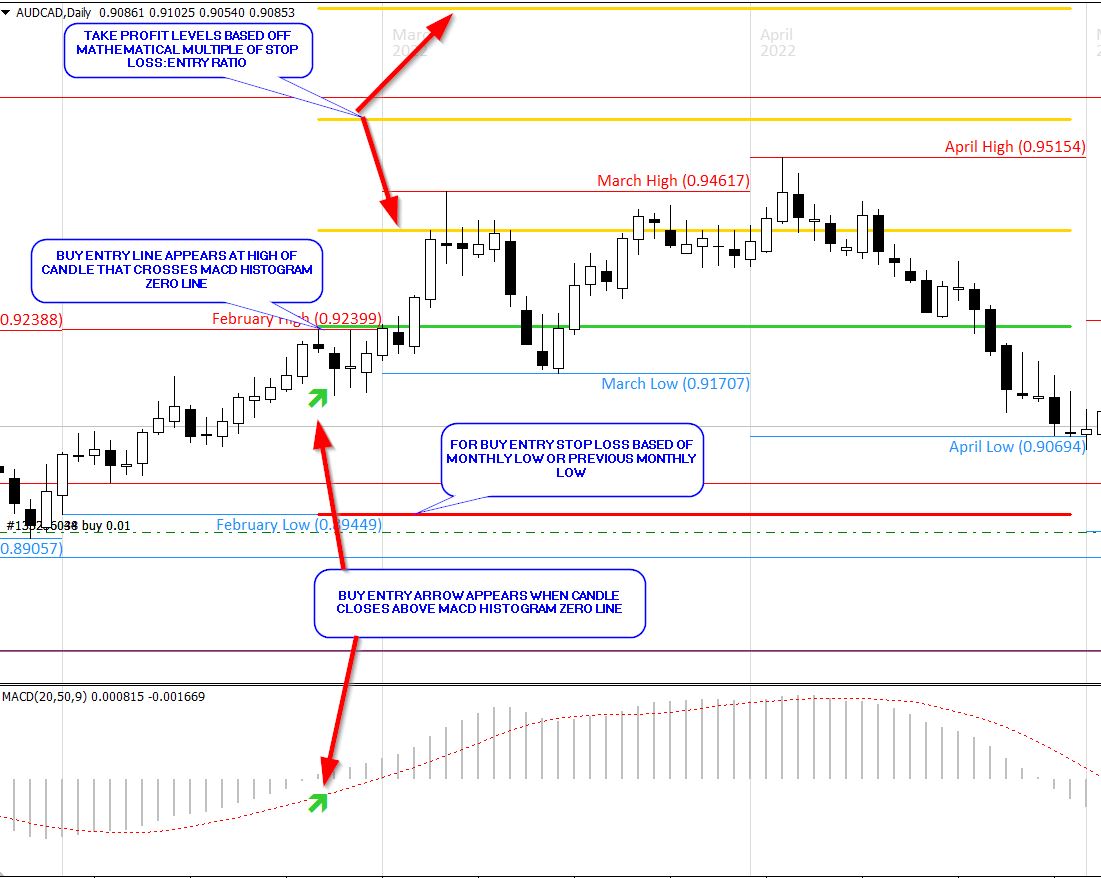
The indicator logic for the MACD is simple and is based off of the HISTOGRAM. For SHORT signal, price simply has to close BELOW the ZERO LINE. For LONG Signal, price simply has to close above the ZERO LINE.
STOCHASTICS 70/30
K Period (Numerical value)
D Period (Numerical value)
Slowing (Numerical value)
Overbought (Numerical value)
Oversold (Numerical value)
LONG Entry (Numerical value)
SHORT Entry (Numerical value)
Trade Entry SHORT (High/Low/Open/Close) Choose option
Trade Entry LONG (High/Low/Open/Close) Choose option
Show Historical (TRUE/FALSE)
Show Label (Left top/Left bottom/Right top/Right bottom) Choose option (Top and bottom refer to either ABOVE the ENTRY LINE or BELOW the ENTRY LINE)
Target 1 (Numerical Value)
Target 2 (Numerical Value)
Target 3 (Numerical Value)
Target 4 (Numerical Value)
Target 5 (Numerical Value)
Target 6 (Numerical Value)
Line Style
Entry Line color
Entry Line style
Entry Line width
Target Lines color
Target Lines style
Target Lines width
Stop Line color
Stop Line style
Stop line width
Label Style
***The LABEL refers to a box drawn around the price values printed by the indicator. Please see the image CCI Example for an example of what this should look like***
Add Label Background (True/False)
Label Text Color
Label Text Size
Lebel Background Color
Arrow Style
SHORT style (For example, 238)
SHORT color
SHORT width
LONG style (For example,. 236)
LONG color
LONG width
Function
Use Stochasitc 70/30 Signal (True/False) ***This parameter indicates whether the Stochastic 70/30 will be shown on the chart or not
Use Stochastic Oscillator (True/False) ***This parameter indicates whether the Stochastic Oscillator will be shown in a separate indicator window
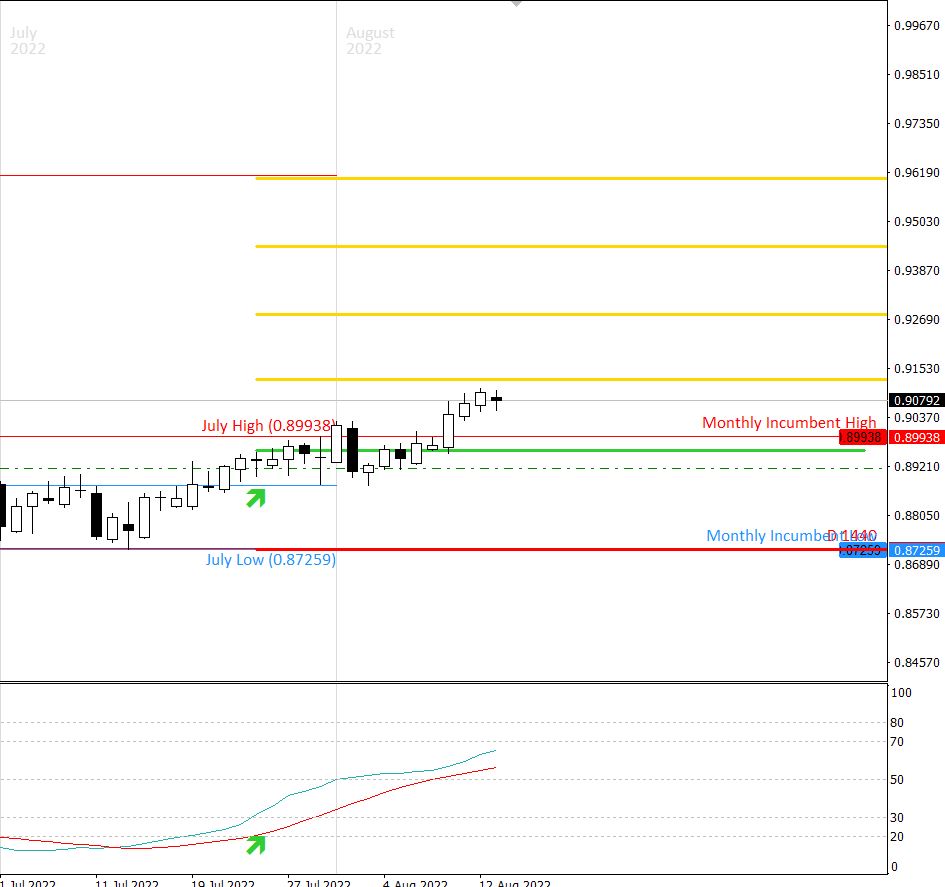
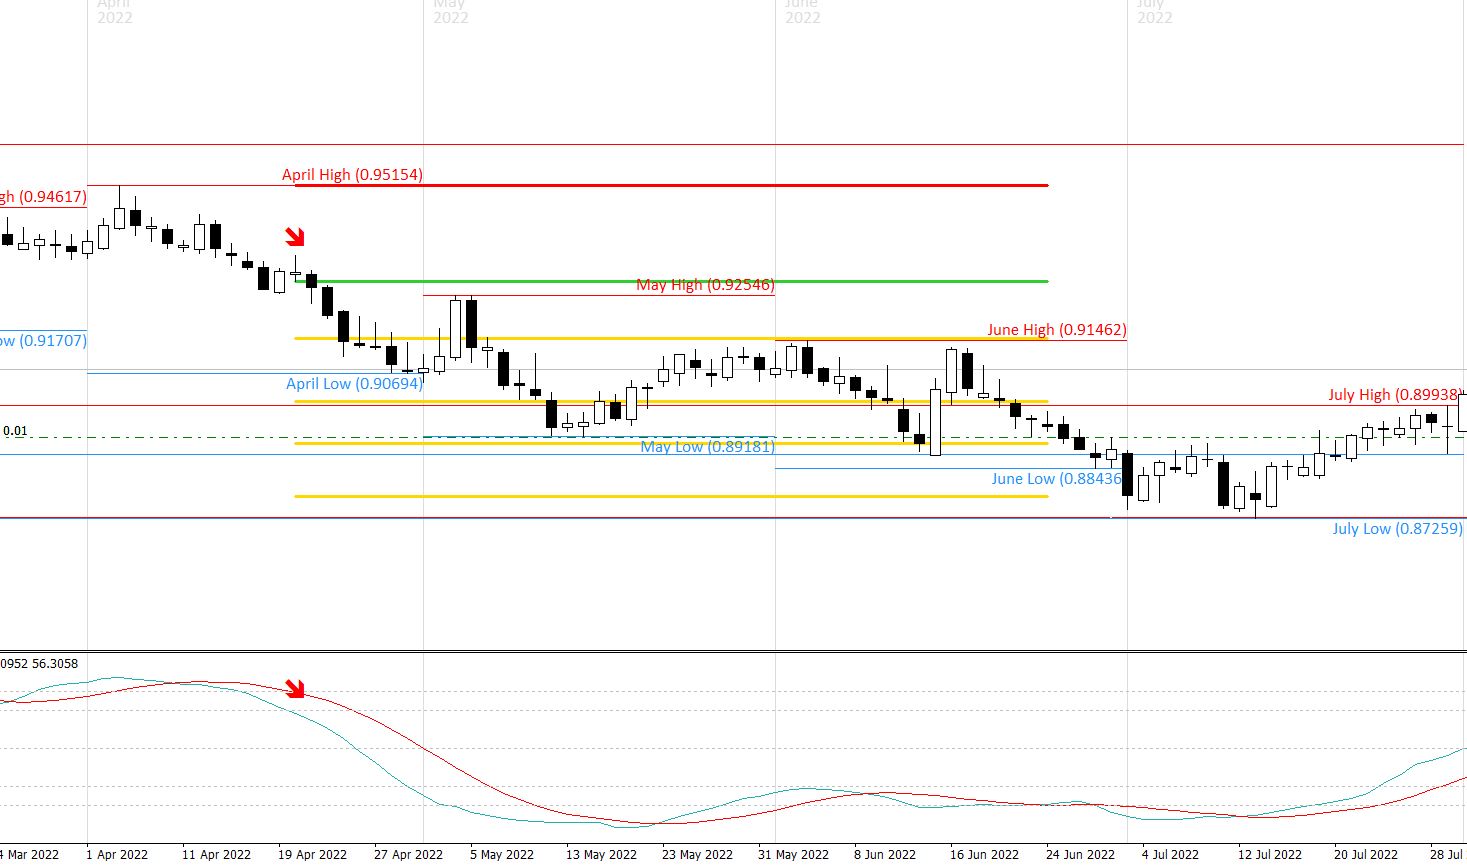
The indicator logic for the Stochastic 70/30 is simple and is based off of the STOCHASTIC LINE (Not the SIGNAL Line). For SHORT signal, price must first enter OVERBOUGHT territory before crossing below the SHORT ENTRY (see above in parameters). For LONG signal, price must first enter OVERSOLD territory before crossing above LONG ENTRY value (see above in parameters). For example, OVERBOUGHT is set to 80 and SHORT ENTRY is set to 70. Price crosses into OVERBOUGHT territory FIRST, then later crosses BELOW 70. The indicator would then print on the chart at the close of this candle (See image). Conditions for LONG ENTRY are the same, but in reverse.
STOCHASTICS 50
K Period (Numerical value)
D Period (Numerical value)
Slowing (Numerical value)
Overbought (Numerical value)
Oversold (Numerical value)
LONG Entry (Numerical value)
SHORT Entry (Numerical value)
Trade Entry SHORT (High/Low/Open/Close) Choose option
Trade Entry LONG (High/Low/Open/Close) Choose option
Show Historical (TRUE/FALSE)
Show Label (Left top/Left bottom/Right top/Right bottom) Choose option (Top and bottom refer to either ABOVE the ENTRY LINE or BELOW the ENTRY LINE)
Target 1 (Numerical Value)
Target 2 (Numerical Value)
Target 3 (Numerical Value)
Target 4 (Numerical Value)
Target 5 (Numerical Value)
Target 6 (Numerical Value)
Line Style
Entry Line color
Entry Line style
Entry Line width
Target Lines color
Target Lines style
Target Lines width
Stop Line color
Stop Line style
Stop line width
Label Style
***The LABEL refers to a box drawn around the price values printed by the indicator. Please see the image CCI Example for an example of what this should look like***
Add Label Background (True/False)
Label Text Color
Label Text Size
Lebel Background Color
Arrow Style
SHORT style (For example, 238)
SHORT color
SHORT width
LONG style (For example,. 236)
LONG color
LONG width
Function
Use Stochasitc 50 Signal (True/False) ***This parameter indicates whether the Stochastic 50 will be shown on the chart or not
Use Stochastic Oscillator (True/False) ***This parameter indicates whether the Stochastic Oscillator will be shown in a separate indicator window
The indicator logic for the Stochastic 50 is simple and is based off of the STOCHASTIC LINE (Not the SIGNAL Line). For SHORT signal, stochastic line must cross BELOW 50. For LONG signal, stochastic line must cross ABOVE 50.
CCI 100
CCI Period (Numerical Value)
Overbought (Numerical Value)
Oversold (Numerical Value)
Trade Entry SHORT (High/Low/Open/Close) Choose option
Trade Entry LONG (High/Low/Open/Close) Choose option
Show Historical (TRUE/FALSE)
Show Label (Left top/Left bottom/Right top/Right bottom) Choose option (Top and bottom refer to either ABOVE the ENTRY LINE or BELOW the ENTRY LINE)
Target 1 (Numerical Value)
Target 2 (Numerical Value)
Target 3 (Numerical Value)
Target 4 (Numerical Value)
Target 5 (Numerical Value)
Target 6 (Numerical Value)
Line Style
Entry Line color
Entry Line style
Entry Line width
Target Lines color
Target Lines style
Target Lines width
Stop Line color
Stop Line style
Stop line width
Label Style
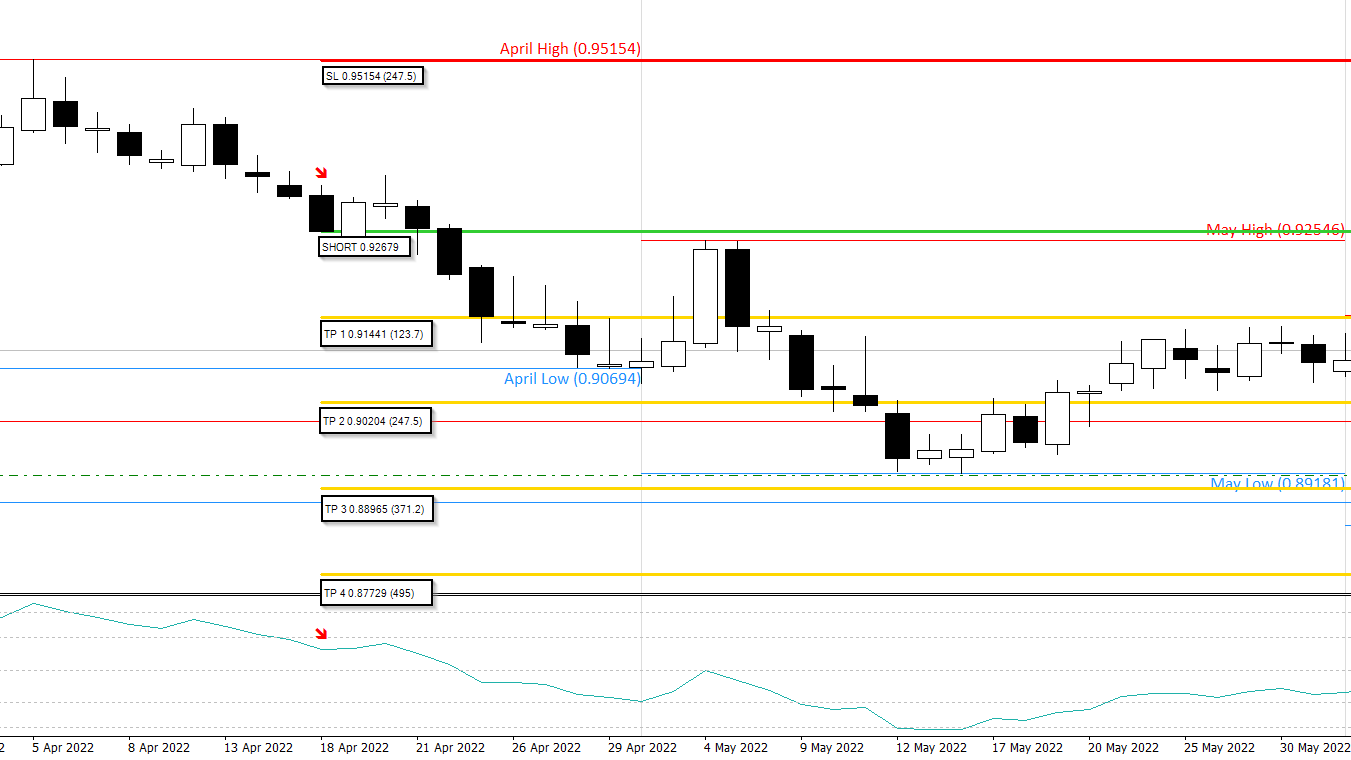
***The LABEL refers to a box drawn around the price values printed by the indicator. Please see the image CCI Example for an example of what this should look like***
Add Label Background (True/False)
Label Text Color
Label Text Size
Lebel Background Color
Arrow Style
SHORT style (For example, 238)
SHORT color
SHORT width
LONG style (For example,. 236)
LONG color
LONG width
Function
Use CCI 100 Signal (True/False) ***This parameter indicates whether the CCI 100 will be shown on the chart or not
Use Stochastic Oscillator (True/False) ***This parameter indicates whether the Stochastic Oscillator will be shown in a separate indicator window
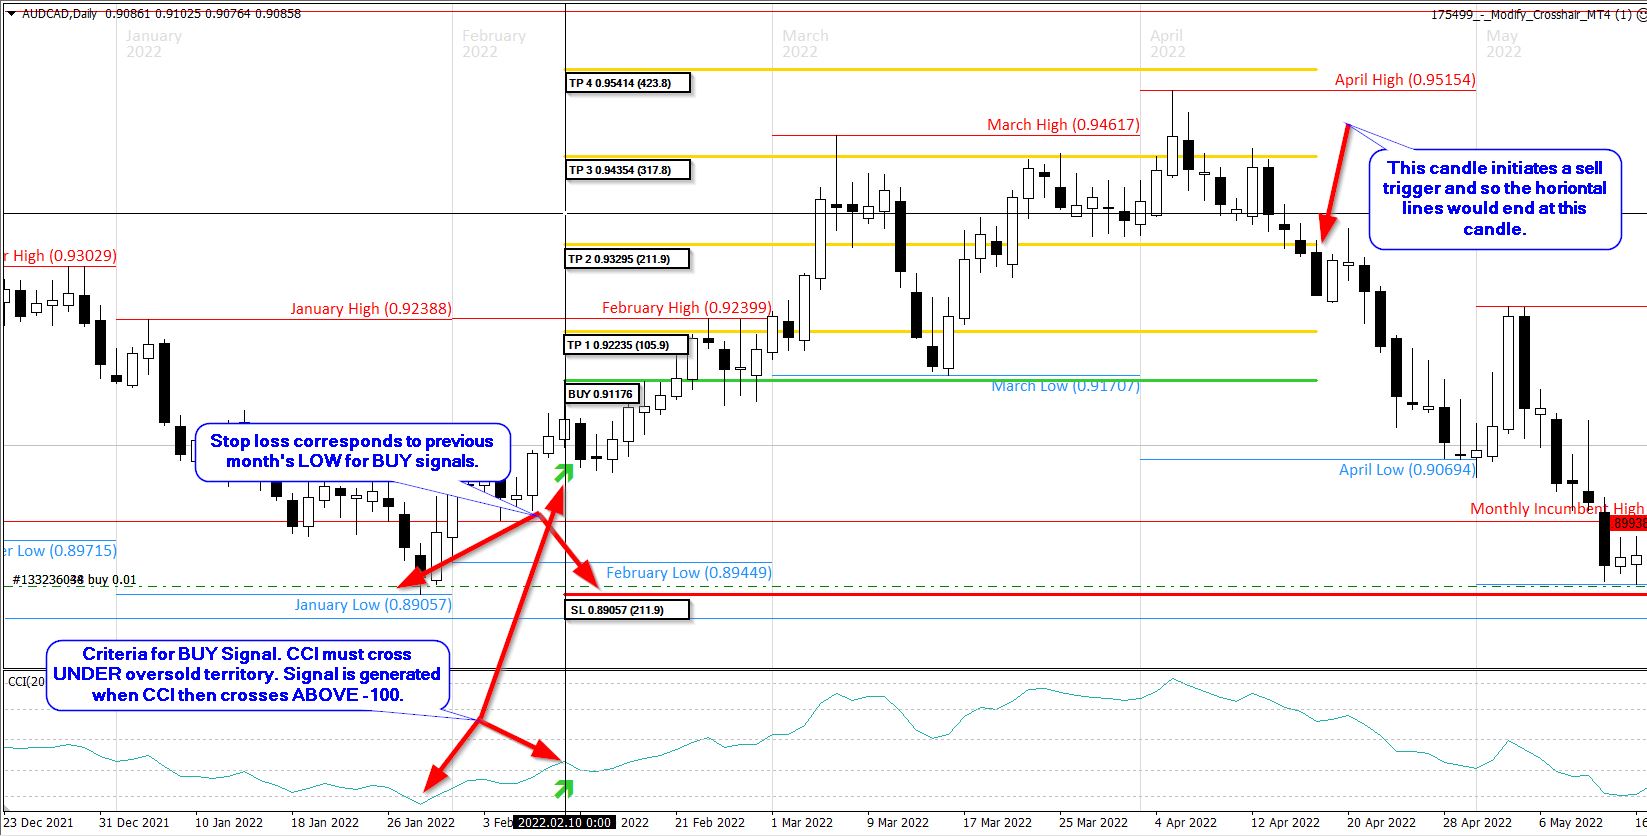
The indicator logic for the CCI is simple and is based off ENTRY and EXIT of OVERBOUGHT and OVERSOLD conditions. For LONG entry, CCI must first enter OVERSOLD territory before later crossing ABOVE the -100 value. For SHORT entry, CCI must first enter OVERBOUGHT territory before later crossing BELOW the 100 value.
CCI Zero
CCI Period (Numerical Value)
Trade Entry SHORT (High/Low/Open/Close) Choose option
Trade Entry LONG (High/Low/Open/Close) Choose option
Show Historical (TRUE/FALSE)
Show Label (Left top/Left bottom/Right top/Right bottom) Choose option (Top and bottom refer to either ABOVE the ENTRY LINE or BELOW the ENTRY LINE)
Target 1 (Numerical Value)
Target 2 (Numerical Value)
Target 3 (Numerical Value)
Target 4 (Numerical Value)
Target 5 (Numerical Value)
Target 6 (Numerical Value)
Line Style
Entry Line color
Entry Line style
Entry Line width
Target Lines color
Target Lines style
Target Lines width
Stop Line color
Stop Line style
Stop line width
Label Style
***The LABEL refers to a box drawn around the price values printed by the indicator. Please see the image CCI Example for an example of what this should look like***
Add Label Background (True/False)
Label Text Color
Label Text Size
Lebel Background Color
Arrow Style
SHORT style (For example, 238)
SHORT color
SHORT width
LONG style (For example,. 236)
LONG color
LONG width
Function
Use CCI Zero Signal (True/False) ***This parameter indicates whether the CCI Zero signal will be shown on the chart or not
Use Stochastic Oscillator (True/False) ***This parameter indicates whether the CCI will be shown in a separate indicator window
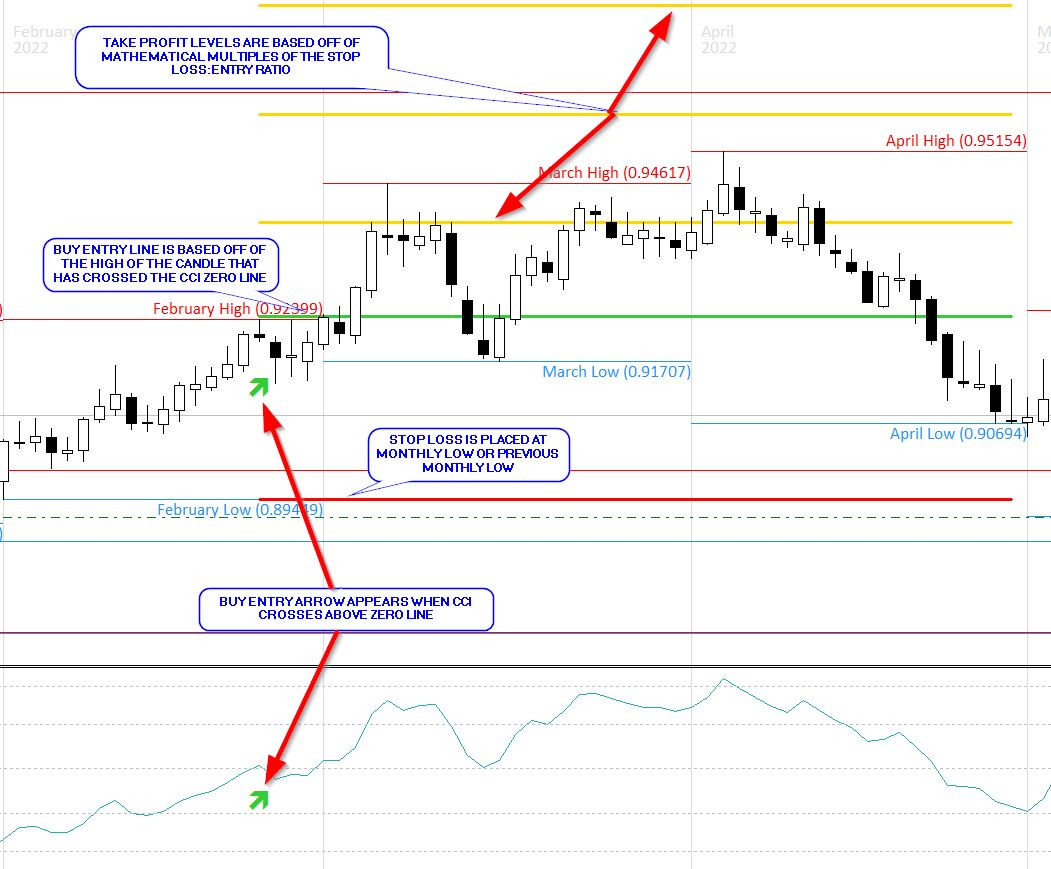
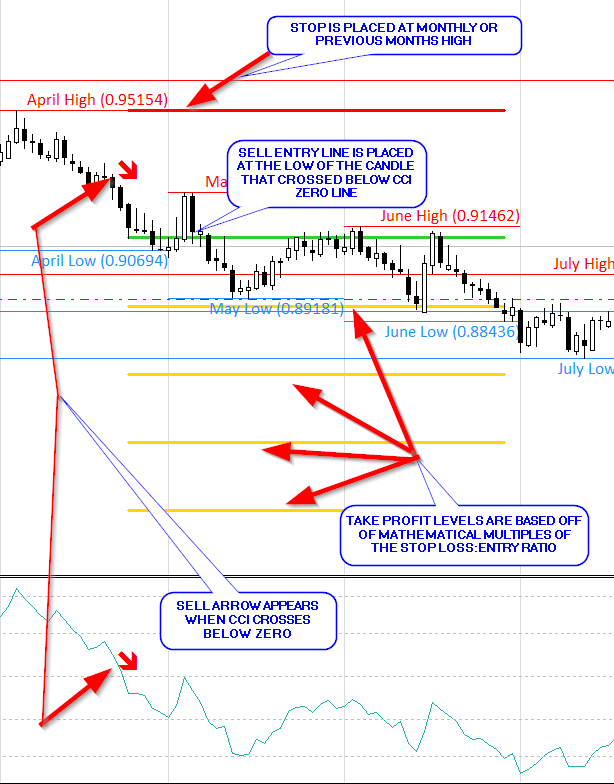
The indicator logic for the CCI is simple and is based off the ZERO LINE. For LONG entry, CCI must simply cross above the ZERO line. For SHORT entry, CCI must simply cross below the ZERO line.
STOP LOSS EXPLANATION
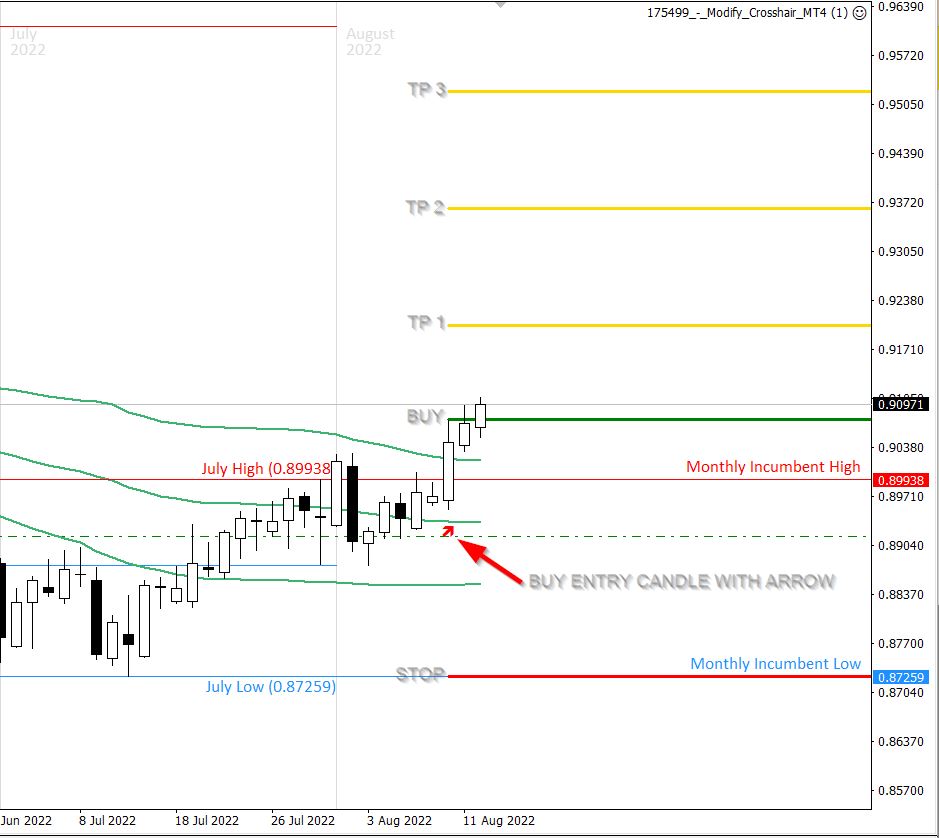
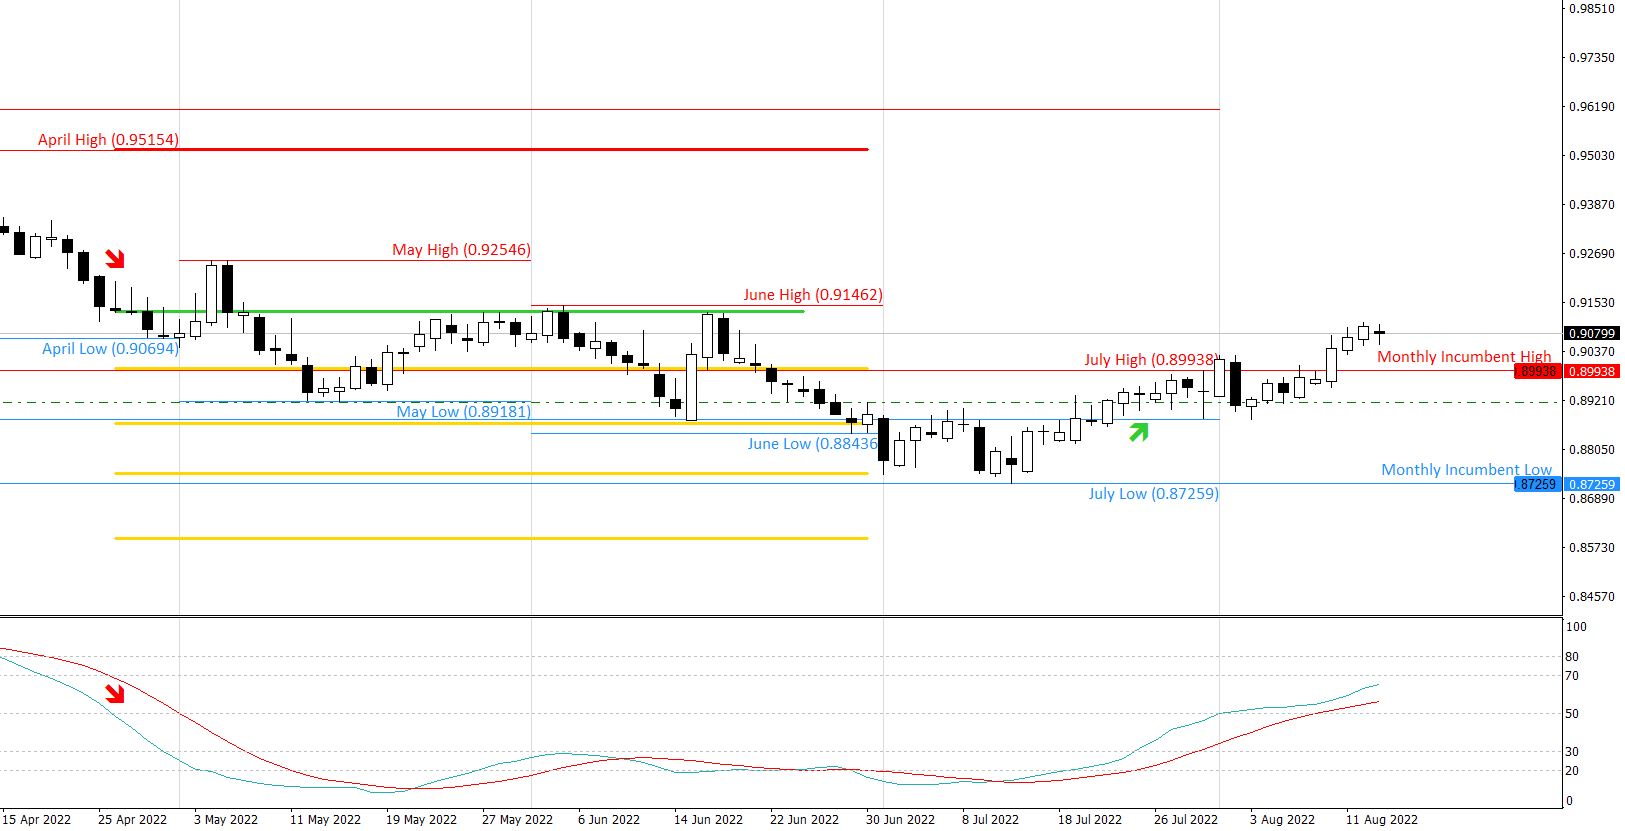
The STOP LOSS for ALL SIGNALS is the same. For BUY signals, STOP LOSS is either the MONTH LOW or the PREVIOUS MONTH'S LOW (I'm not sure which is simpler to code). For SELL signals, STOP LOSS is either the MONTH HIGH or the PREVIOUS MONTH'S HIGH.
TAKE PROFIT LEVELS EXPLANATION
I would like 6 TAKE PROFIT levels printed for each indicator. Each TAKE PROFIT level is based off a MATHEMATICAL MULTIPLE of the STOP LOSS to ENTRY ratio. For example, if the indicator prints an entry and it is 100 pips to the stop loss, I would like the option to choose the multiple of the ratio at which each take profit will print. For example, target 1 is (100 x 0.5) or 50 pips. Target 2 is (100 x 1) or 100 pips. Target 3 is (100 x 1.5) or 150 pips, etc.
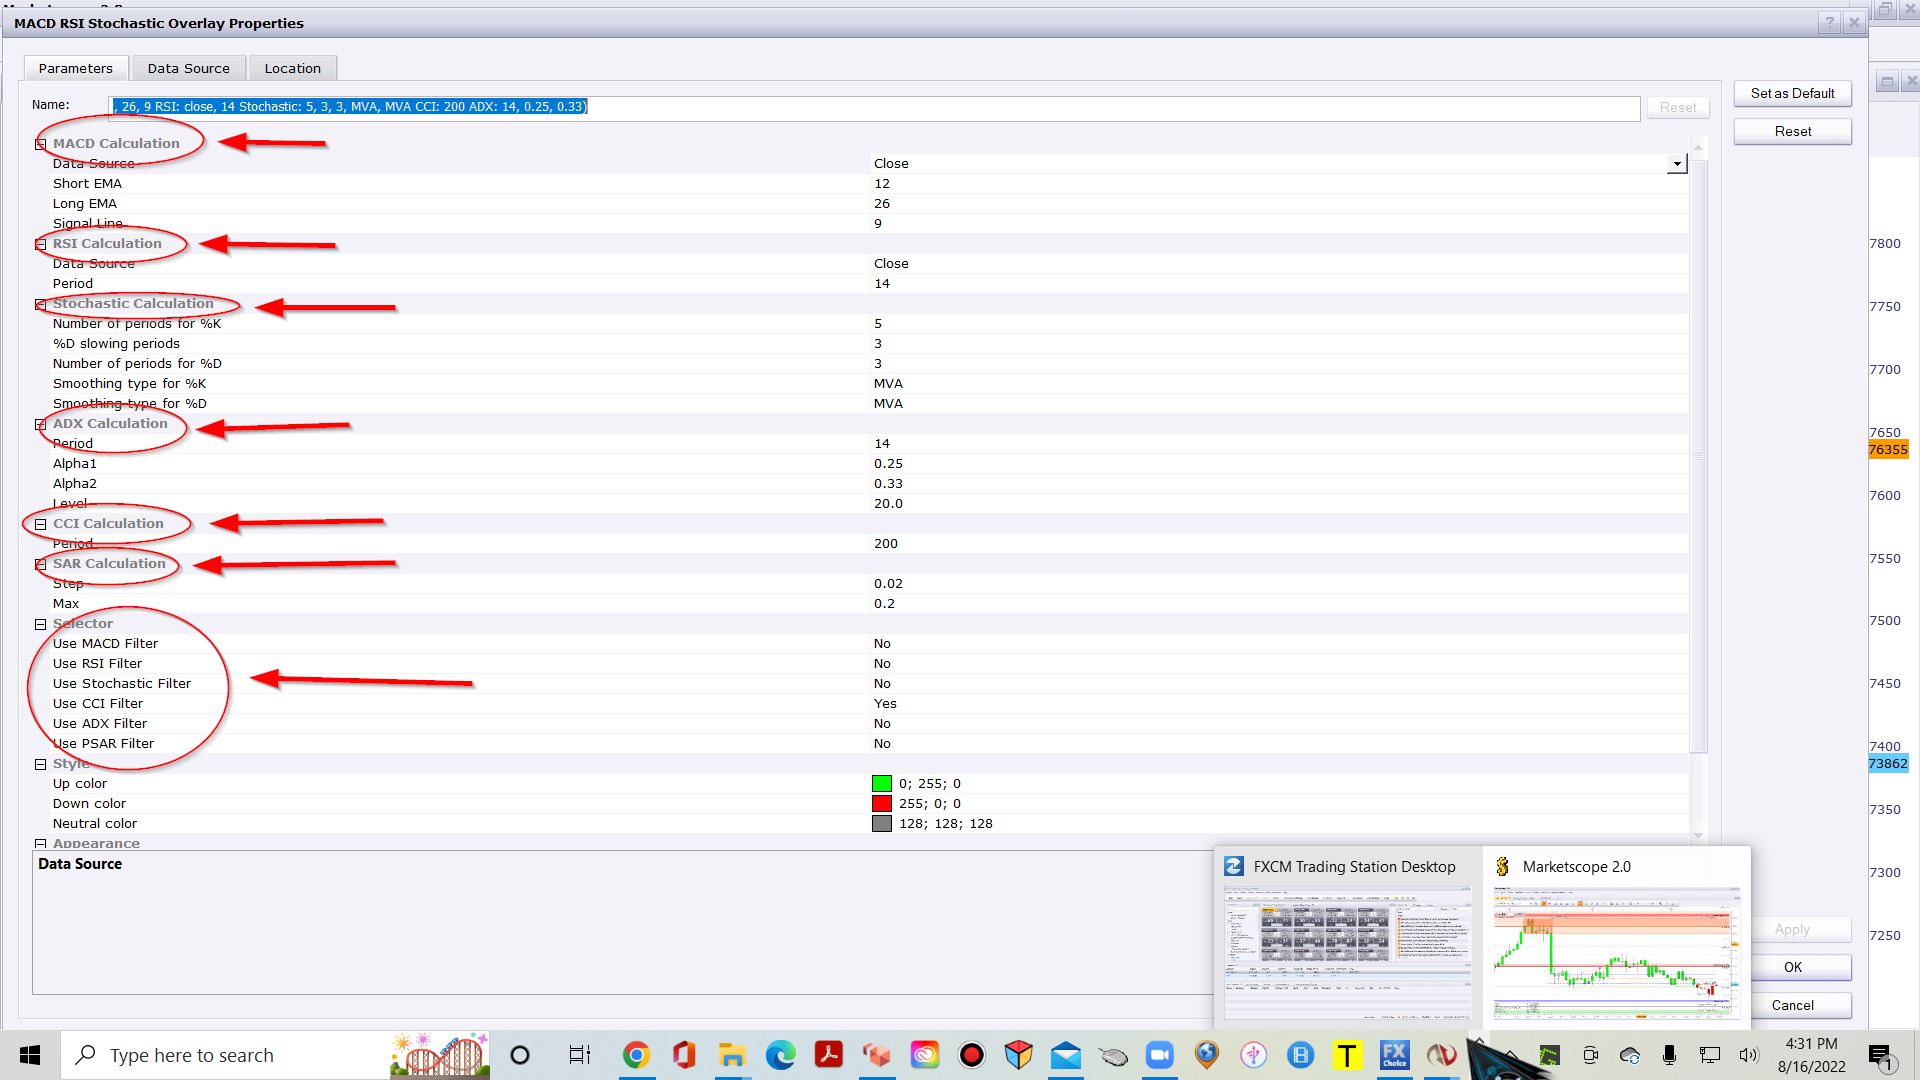
I have included several images where I have drawn in lines and annotated their meanings. I have also included an image titled "CCI EXAMPLE" which is an example of how this indicator looks in a different trading platform.