Toutes les commandes
 Règles
Tâche terminée

Spécifications
Summary: I require an interactive panel box that I can drag on to any chart which will show all current open positions in the particular financial instrument plus enable me to input data, so that the panel will display certain data.
Some definitions (you may need to read further down first and then come back to these definitions in order they make more sense):
When I say trade, I mean the total of all positions open, both long and short in any one particular instrument (eg, S&P.fs, AUDUSD, WTI.fs, EURUSD, Silver.fs etc).
When I say position, I mean an open individual position with it's own entry price, quantity, commission and swap charges, and profit/loss
When I say added profits, I mean a profit or loss I have made from other positions or trades which I want to include in the total net profit/loss for another trade.
The below example should help to illustrate these definitions.
For example,
I enter long a quantity of .05 the S&P.fs at 3000 in early August
I enter long a quantity of .03 the S&P.fs at 3400 in late August
I enter short a quantity of .03 the S&P.fs at 3350 in early September
I enter long a quantity of .01 the VIX.fs at 26 in early September
I enter long a quantity of .01 the VIX.fs at 28 in early September
Each of the above are individual positions.
The total of all 3 S&P.fs positions and the net profit/loss thereof constitutes one trade (the S&P.fs trade)
The total of all 2 VIX.fs positions and the net profit/loss thereof constitutes one trade (the VIX.fs trade)
So in total, I have 5 positions, but 2 trades.
If I place the panel on the S&P.fs chart, it should only show up the 3 S&P.fs positions (and not the VIX.fs positions).
If I place the panel on the VIX.fs chart, it should only show up the 2 VIX.fs positions (and not the S&P.fs positions) .
Assume I close out both the VIX.fs positions (and hence the VIX.fs trade) a few days later for a profit - I might choose to include this profit as an added profit for the S&P.fs trade (because I used it as a hedge). I have kept all the S&P.fs positions open.
When I place the panel in the S&P.fs chart, it will show all 3 S&P.fs positions (the 2 longs on the left, the 1 short on the right), it will ask for any added profits, and I will enter the profit I obtained from my VIX.fs trade, and it will ask me for a profit target in $. It will then show me what price the S&P.fs must reach to break-even and to reach my stated profit target.
Specifics on the panel
1. The data I want displayed and the data I want to enter in the panel.
i. Need the panel to show all current open long positions as entries on the left hand side, and all current open short positions on the right hand side
ii. Need all entries to show the entry price of each position, the quantity of each position, the up-to-date swap charges on each position, any commissions charged for each position, and the net p/l for each position
iii. Underneath each side also need a total of all the above positions and their quantities, swaps, commissions, and net p/l(ii)
iv. I also need the panel to ask for inputs from me, which include:
- what is my goal in $
- have i any added profits I want to include
v. Once I have entered inputs from iv., the panel must then show me:
- The price target for all positions (both long and short) needed to be reached to break even on the trade
- The price target for all positions (both long and short) needed to be reached to reach the profit target on the trade
- The current profit/loss for the trade (which includes any added profits)
2. The panel/box itself.
i. I would like to be able to move the panel around on my chart by clicking and dragging with my mouse.
ii. I would like the panel to be pleasing to the eye, so that it stands out a bit from the white background of the chart.
iii. As an addition to 2, I would like the panel to be at the forefront, so that wherever I place it on the chart I will only see the panel and the info in it (and not what is in the background).
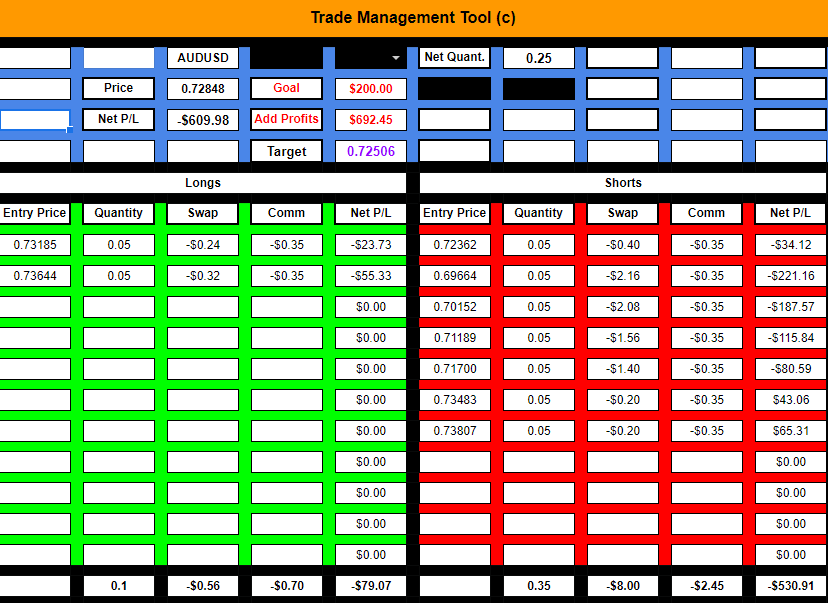
I have attached a screenshot of what I have been using up to now to fulfill the same purpose.
I created this tool using google spreadsheets and google finance for some quotes (such as forex).
The problem I have however is that I have had to manually enter in all positions, update the swaps daily, etc.
This was a live trade which was only closed yesterday but I have kept the details for illustrative purposes.
As you can see, the spreadsheet shows all long positions on the left side, and all shorts on the right.
At the bottom it has the totals
Above it has the other details and inputs I am asking to be put into this panel
As you can see, in red it is asking me for a profit target in $ terms (you can see I entered $200).
It has also asked for added profits (you can see I have entered $692.45 - these added profits came from AUDUSD positions I closed earlier which I then removed from the spreadsheet).
The spreadsheet then factors in everything and gives a price level to reach my profit target, which you can see is .72506.
I then manually enter in this through my broker as my take profit on all the short positions and stop loss on all the longs.
Yesterday when the AUDUSD traded at .72506, all longs and shorts were subsequently liquidated and my trade was finished with a net $200 profit.
Please note: I do not need the panel you create to be exactly like the spreadsheet in appearance, only in functionality. The screenshot of the spreadsheet was merely to illustrate what I need the panel tool to do.
I will require source code
I will be looking for further tools to be made with more functionality later so if I find the right person this could be some on-going work.