Tobias Fedier
Tobias Fedier
  • Information
10+ years
experience
0
products
0
demo versions
0
jobs
0
signals
0
subscribers
Tobias Fedier
Tobias Fedier
pretty soon i will look for a EURUSD Sell opportunity ^^ around 1.09000
Tobias Fedier
Tobias Fedier
How long does it need to answer my question on service desk??? any idea?
Matthew Todorovski
Matthew Todorovski 2014.12.14
Depends on the question. Some SD requests are still open for me for months... have they forgotten?
Matthew Todorovski
Matthew Todorovski 2014.12.14
Make a poll and find out! ;)
Nikolay Globa
Nikolay Globa 2015.08.03
Хорошо!
ramasubbu velayutham
my this week trades :)))my this week trades :)))
5
GoldnMoney
[Deleted] 2015.03.15
cool
Tobias Fedier
Tobias Fedier
Ad seconde position to my trade :) so easy ^^ swiss precision
Tobias Fedier
Tobias Fedier
what a nice entry all clear and ready to run all the way down ^^
Tobias Fedier
Tobias Fedier
Interesting EURUSD weekly
Nice work!
Daniel Stein
Daniel Stein
Just for the gallery....

1. Long EURCAD = 32 Pips
2. Wait a few minutes at the Resistance Level
3. Short EURCAD = 28 Pips

Result: 60 Pips in less than 90 minutes...Just for the gallery....

1. Long EURCAD = 32 Pips
2. Wait a few minutes at the Resistance Level
3. Short EURCAD = 28 Pips

Result: 60 Pips in less than 90 minutes...
2
Tobias Fedier
Tobias Fedier
Good evening :) anybody know a good support and resistance indi? thanks and cheers ^^
Tobias Fedier
Tobias Fedier 2014.11.19
okay let me see thanks :)
Tobias Fedier
Tobias Fedier 2014.11.20
Many thanks Osiri!
Tobias Fedier
Tobias Fedier
u got it? :)
Tobias Fedier
Tobias Fedier
Im ready for this week and know exactly where the market will go ^^
Dmitriy Smaglyuk
Dmitriy Smaglyuk 2014.11.16
very pretty! )
Richer Araujo
Richer Araujo 2014.11.16
... Christmas tree :P
Tobias Fedier
Tobias Fedier
Keep it simple ^^
Tobias Fedier
Tobias Fedier 2014.11.16
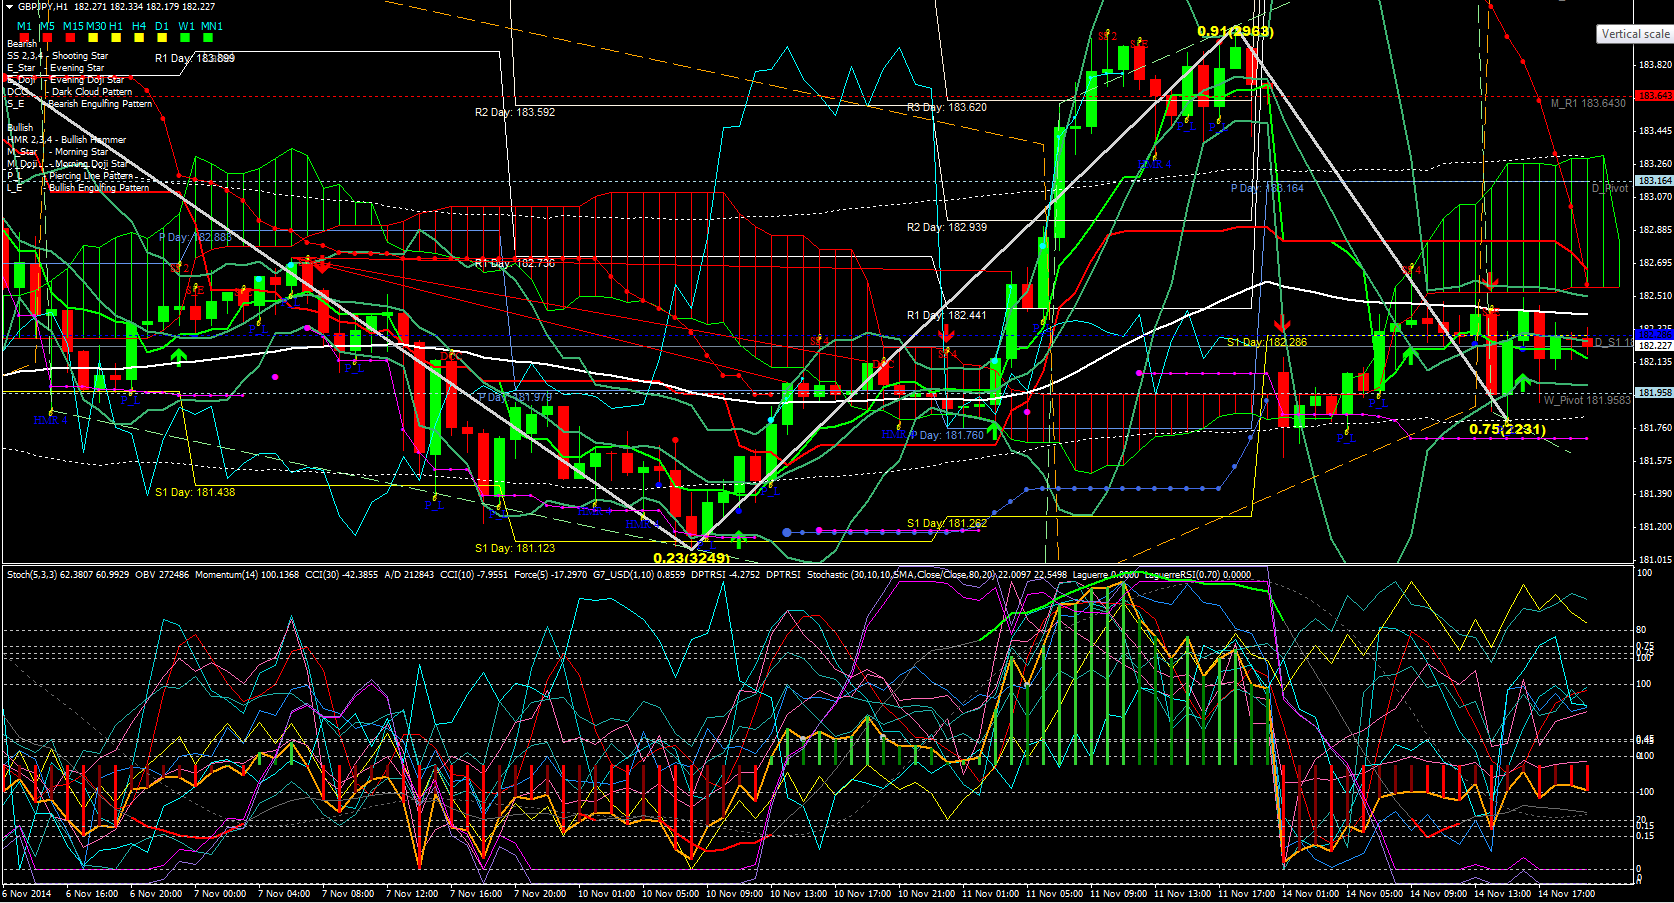
Yea i wanted to add some more but unfortunately my MT4 crashes all the time :D
Osiris
Osiris 2014.11.17
very pretty :) looks like a pip machine
Manuel Jesus Barrera Velazquez
Manuel Jesus Barrera Velazquez 2014.11.19
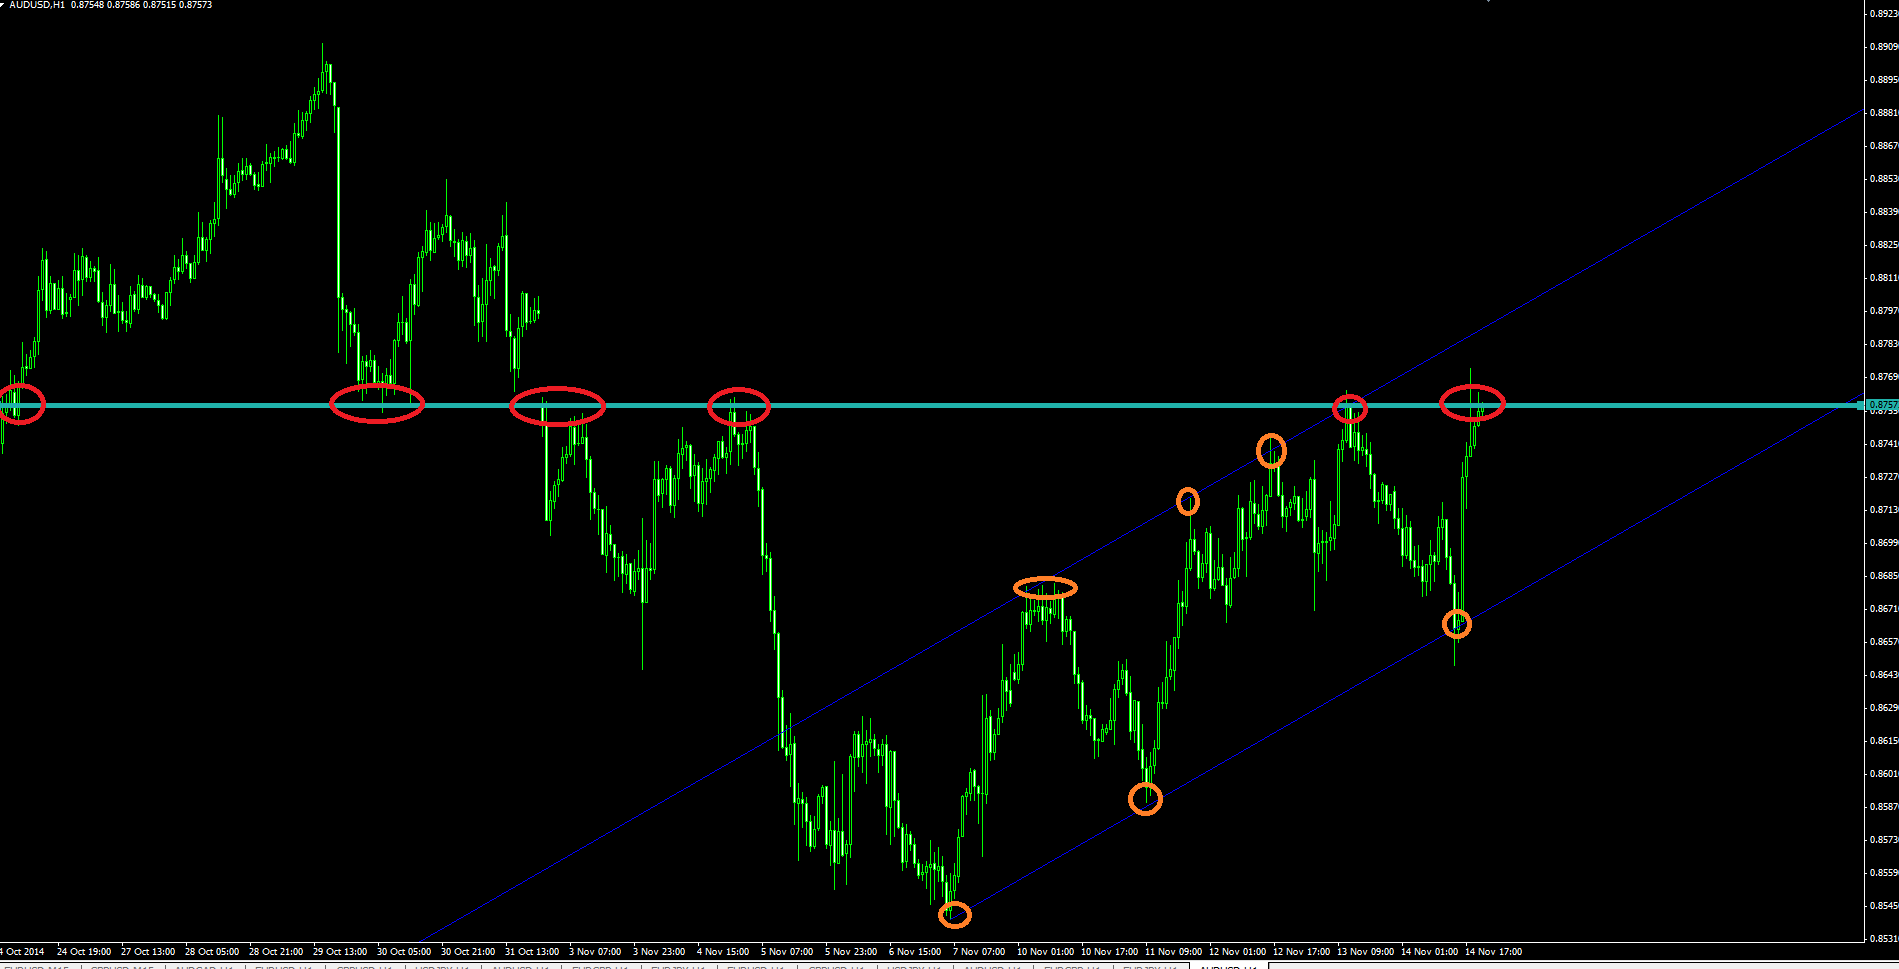
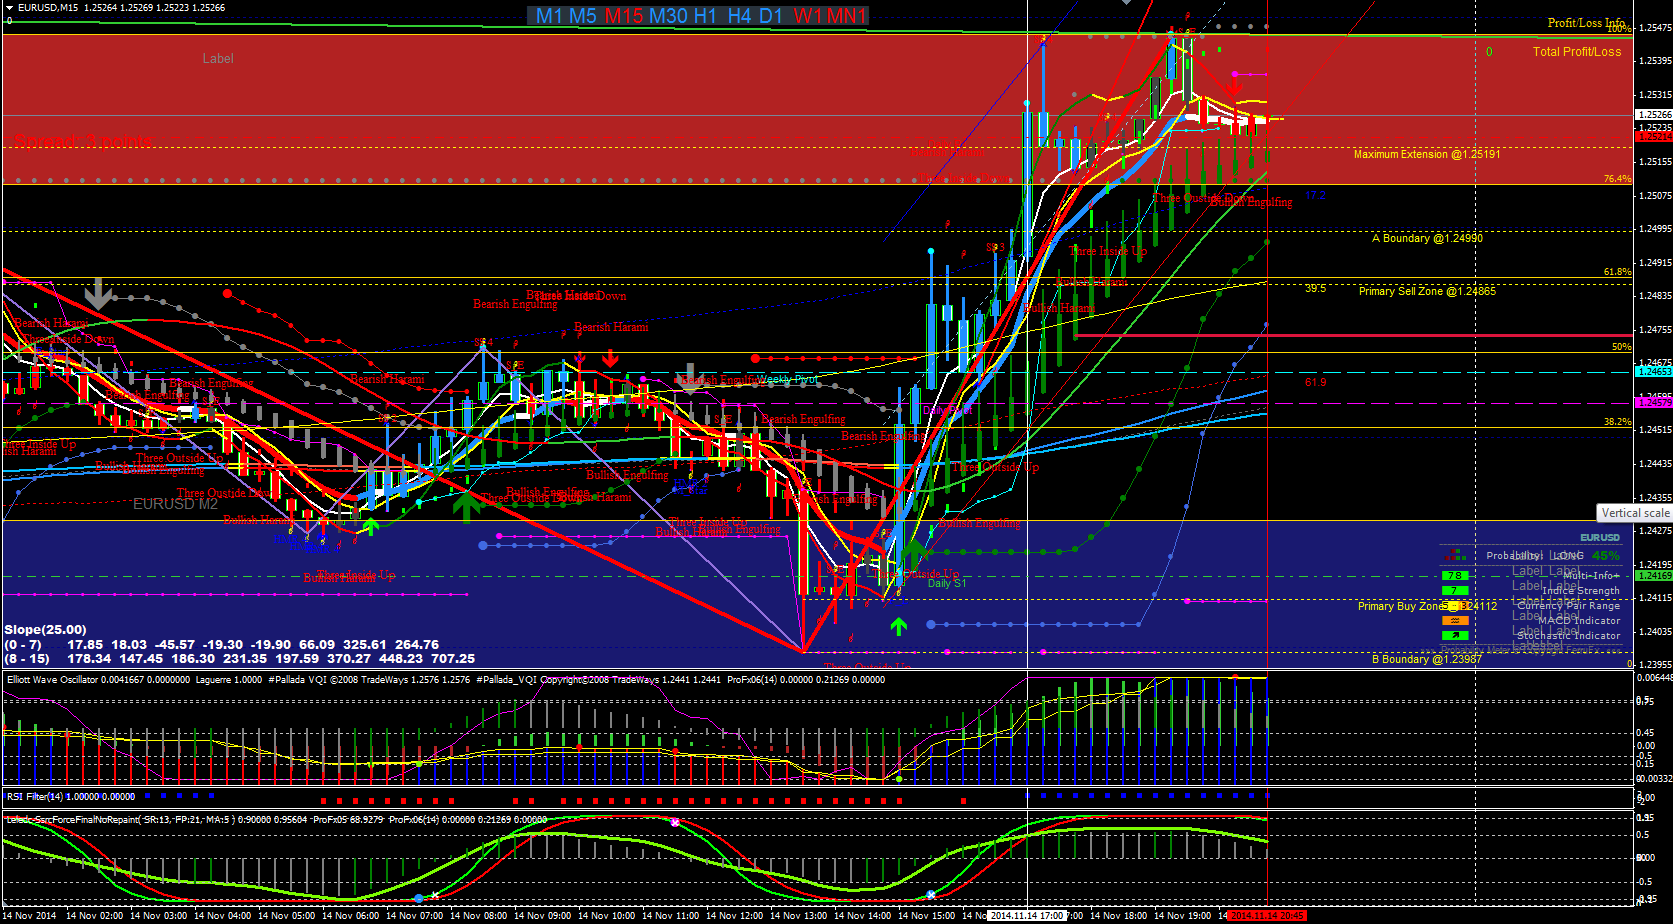
Whats can you see here??? Are you see anything here???????????? Its imposible to look something????
Amir Sadeghi
Amir Sadeghi
AUDUSDAUDUSD
5
Abbas Makki
Abbas Makki 2014.11.16
Nice what is the target
Matthew Todorovski
Matthew Todorovski 2014.11.16
Hindsight is a valuable thing... foresight is priceless!
Tobias Fedier
Tobias Fedier
Best Signal on MQL5 so far. Good guy

https://www.mql5.com/en/signals/35539
This is crazy...
Matthew Todorovski
Matthew Todorovski
Methods that work for automated trading

Despite all electronic trade systems, market inefficiency has even increased over the last decade, making automated trading more profitable than ever. Returns of 100% per year, far above the profit range of any serious long-term investment, can be relatively easily achieved trough automated trading, even with a cheap PC and slow Internet connection. The most important methods for exploiting inefficiencies are listed below:

Trend. All strategies try to anticipate the trend, but the current trend of a price curve itself can be used to predict future prices. Traders tend to follow the mass: when some buy, others start buying too. This causes a sequence of price movements in the same direction that can be detected and exploited. Trend following is one of the most often used strategies, but also one of the most difficult: the crucial point is detecting a beginning trend as early as possible, while at the same time preventing false signals. An example of a trend trading strategy can be found in Workshop 4.

Mean reversion (counter-trend). Traders often believe in the existence of a 'fair price' of an asset. They buy when the actual price is cheaper than it ought to be in their opinion, or sell when it is more expensive. This causes the price curve after going in a certain direction often to reverse back to the mean. An example of a mean reversion strategy can be found in Workshop 5.

Cycles. When a trade is profitable, traders often sell after a certain time for taking profits; unprofitable trades are sold after a different time. This has often the effect to synchronize entries and exits among a large number of traders, and causes the price curve to oscillate with a period that is stable over a relatively long time span. Such a cycle can be detected with spectral analysis functions and used for predicting the price trend. (Those cycles in price curves are real and unrelated to the imagined "waves" mentioned below).

Clusters. Traders often believe in a 'real price' of a certain asset, and sell or buy a position at the moment when the price curve reached that value. This is the reason that prices sometimes cluster at certain levels and produce the famous "support" and "resistance" lines (also called "supply" and "demand").

Curve patterns. Traders believe that price movements are preceded by certain curve patterns. Most of them - such as the famous "head and shoulders" pattern - are myths. But some patterns, for instance "cups" or "half-cups", can indeed precede an upwards or downwards movement and can be exploited by pattern-detecting methods such as the Fréchet algorithm.

Price action. Certain configurations of the open, close, high, or low prices of 3, 4, or 5 consecutive candles are said to predict price movements. Problem is that predictive candle patterns can't be found in books - they depend on the market, the broker's liquidity providers, and on the time zone, and thus change all the time. But done the right way, price action trading can indeed generate profit with candle patterns that are found by statistical analysis. An example for detecting profitable candle patterns with a machine learning algorithm can be found in Workshop 7.

Price cap. Sometimes a governement establishes a floor or ceiling for its currency exchange rate. Interventions prevent that the exchange rate exceeds a certain limit - a famous example is the above mentioned 1.20 ceiling of the EUR/CHF rate. This can be used in strategies to the trader's advantage.

Seasonality. "Season" does not necessarily mean a season of a year. Monthly, weekly, or daily trading behavior at large stock exchanges, such as the NYSE, often follows a certain pattern that can be exploited by strategies. For instance, the S&P500 index often moves upwards in the first days of a month, and also has often an upwards trend in the early morning hours before the main trading session of the day. You can detect seasonal effects with Zorro's Profile functions.

Gaps. When an asset is traded during certain market hours only - such as stocks and stock indices - tomorrow's market open price can sometimes be predicted to some degree from the trading behavior at today's market close time.

Arbitrage. When two assets are known to be strongly correlated, strategies can exploit the fact that their prices tend to regularly end up at the same level or the same ratio, and derive profit from temporary price deviations.

Price shocks. They often happen on Monday or on Friday morning when companies or organizations publish good or bad news that affect the market. Even without knowing the news, a strategy can detect the first price reactions and quickly jump onto the bandwagon.
All this sounds as if it were quite easy to exploit the markets. But trading is a game of probability. No computer can predict with certainty the outcome of a particular trade. Any detected inefficiency gives a trading system only a relatively small advantage, and mistakes can easily turn a winning strategy into a losing one. There are many traps to avoid when developing trade strategies.

------------------------------------------------------------------------------------------------------------------------------------------------
Trade methods that don't work

Although profitable strategies can be created with multiple methods, even more trade methods can and will separate traders from their money in remarkably short time. The prereqisite for any working trade method is a valid scientific foundation. However, the difference between valid science and the many strange market theories, misconceptions, and myths circulating in the trading scene is not always easy to see for non-specialists. How do you know which way of trading is sound, and which is nonsense? Here's a small part of the long list of trade methods that you better avoid.

Staring at price curves. Discretionary trading - that means, entering trades manually - can be successful under one of two conditions. First, you have some information about the particular asset that other traders don't have or don't use. Second, you have a stroke of luck. Otherwise you'll lose money at least at the rate of the transaction costs. It's not possible to the human mind to identify profitable trades by looking at a price curve - except, of course, in hindsight. And although we see in Workshop 8 that luck gives a strategy a powerful edge, it has one problem: it can end anytime.

Technical analysis. This might come as a surprise, as it's normally considered the very essence of automated trading. Technical analysis uses a toolset of 'technical indicators' for determining trade entry and exit points. How indicators are supposed to work is described in the Technical Analysis chapter - but in a nutshell: they don't. At least not in the way they are normally used. Many studies confirmed that classical technical indicators such as Moving Averages, MACD, 'Stochastic', Ichimoku, etc. have no predictive value. Using them for trade signals is equivalent to throwing a coin. Still, even nonpredictive indicators can be helpful for auxiliary purposes. The ATR, for instance, can be used for determining volatility and setting up stop loss distances.

Neural networks. They are the paragon of artificial intelligence - so how can it be that they don't work for trading? A neural net is fed with the price curve, processes the prices in several linear stages for generating trade signals, and learns from failure or success. Unfortunately it learns too good. A neural net based system can be extremely profitable, but only with the very historical price curve that was used for learning. Neural nets fail miserably in out-of-sample tests and in live trading. Feeding the network not with prices, but with indicators or other derivatives of the price curve should theoretically produce a similar result - but in reality the result can be very different. That's why people are still experimenting with processing the price curve in any imaginable way before passing it to the net. Nonetheless, no neural net system is known so far that would produce reliable trade signals. But - as with technical indicators - a neural net can be useful as an auxiliary part of a trade algorithm, such as a filter. You can use Zorro's advise function for experimenting with a simple one-neuron network.

Elliott waves. Ralph Nelson Elliott claimed in his 1938 published book that the prices of financial assets always move up and down in series of five waves. And indeed, you can see all sorts of waves when you stare at price curves long enough. Problem is that imagined waves are not well suited for predicting real prices - and that's true not only for Elliott's waves, but also for the countless other wave patterns invented by his many imitators. No research so far has found any theoretical basis or any statistical evidence of Elliott waves in price curves.

Gann lines. In the early 20th century, the trader William Delbert Gann was desperate as he could not support his family with his trading. But suddenly he discovered the way to success: promoting himself as a genius trader and selling esoteric trade systems and books. Gann was the ancestor of all scammers in the trading scene. No serious tests have ever confirmed any value of his lines, cycles, pyramids, or angles. But even today, many traders still believe in them, to the great joy of their brokers.

Astrology. It's hard to believe, but until recently astrology was widely accepted as a normal trade method and discussed in many trading books. Trading would indeed be a breeze if you could calculate tomorrow's prices just from the positions of sun, moon, and planets. Alas, celestial bodies stubbornly refuse to predict earthly events. A full moon has no correlation to the EUR/USD price, Saturn won't drag down the S&P500 index, and contrary to popular belief, even the sun is not responsible for the change of seasons. All this happens on earth.

Classical candle patterns. With names like "Three Stars in the South" or "Concealing Baby Swallow", they bring some poetry into trading. Candle patterns had been developed in the 18th century by Japanese traders for predicting the local rice market. Even today, many traders are still squinting at price charts, hoping for a lucky trade when a candle formation matches a profitable pattern in their "Get Rich with Candle Patterns" book. You can easily check if this hope is justified - just run a simple backtest with any of the supported classical candle patterns.

Fibonacci numbers. This simple number series - 1, 2, 3, 5, 8, 13, etc. - can be found in patterns of geometric growth, in mathematics as well as in nature. But there's no reason to expect it in price levels or time periods of financial assets. And indeed, it isn't there. Nevertheless traders like the word "Fibonacci", maybe due to its ring of serious math. If a system uses Fibonacci numbers for trade signals, you can be sure that it would also work, and most likely better, with any other numbers.

Harmonic trading. By connecting points on the price curve, you can produce polygonal figures such as diamonds, butterflies, crabs, or bats. Their shapes predict profitable trade entry points. Or do they? Harmonic trading is certainly profitable - for the tool and seminar vendors who invented it. But contrary to the claims of said vendors, there is absolutely no evidence that it ever helped any trader.

Scalping. Systems that trade in minutes or even seconds might have an edge or not - problem is that you'll never know. Due to the bad signal/noise ratio and the feed dependency of price curves at short time frames, backtest results of such systems are very unreliable. An additional problem are the trading costs - commission, spread, slippage - that explode on short time scales, while market inefficiencies disappear. Aside from high frequency trading systems that are an entirely different matter, automated systems work best with time frames in the hour or day range.

Your Trading Style. In trading books you'll often read advices like "place the stop loss at a distance that suits your trading style." This makes you wonder what "your trading style" might be. Do you prefer to trade risky, greedy, timidly, or miserly? And how should this affect the stop loss? In fact, not at all. Any parameter in a trade system has an optimal value, and any other value will produce a less than optimal result. As long as you prefer winning to losing, better select your trade methods and parameters not by your style, but by their robustness and performance.

The Holy Grail. On all trader forums you'll find some lengthy threads about systems with miraculous profits. The thread starter has discovered the ultimate trade method. He feeds the thread periodically with reports of his impressive trade results - such as, doubling his account every month - and vague hints about his miracle algorithm. His devotees eagerly absorb any droplet of information in their attempts to replicate the trade method - but alas, to no avail. Miracles have the nasty habit of disappearing at closer look. The thread will eventually dry out when the miraculist got broke or when the last follower has realized that he was following a Fata Morgana.

Martingale or d'Alembert methods. They are used by many trading robots, signal providers, and beginners in roulette: you bet on red or black and double your stake after every loss. Alternatively, you open two new positions for every lost trade. The theory is that a loss increases your win chance the next time. Unfortunately, it won't. On the contrary, market inefficiencies are often autocorrelated, so after losing a trade there's a good chance that you'll also lose the next one. Although martingale systems at first seem to make steady profits - even when trades are entered at random - they will encounter a long loss streak sooner or later* and wipe out the account. If that doesn't matter for you, workshop 8 describes a way to use a martingale system to your advantage.

High Win Ratio. 99% win rate is easy - just use a 5 pips profit target and a 500 pips stop loss distance. You'll then probably win the next 99 trades, regardless of your strategy. Unfortunately the 100th trade will hit the stop and eat up all profit. Even worse, that fatal trade can happen anytime, even right at the beginning. You can easily identify scammers that use a high win ratio for selling their systems: their published profit curve looks like a straight upwards slope, with any trade winning about the same small amount. They don't wait until the 100th trade, though.

Grid trading. Such a system is a special case of using a high win ratio, up to 100%. It opens many trades at a fixed price grid, and takes profit when the price crosses the next grid line. This method can indeed generate a stream of profits for a while when the prices move up and down, but don't move too far away from their initial position. Problem is that they eventually do, causing a fatal loss**. More capital and smaller trade sizes can delay, but not avoid that event. It's easy to tweak grid trading systems for surviving any backtest, so they are often found in trade robots and on trade copy services. There are few exceptions where grid trading can make sense - for instance when runaway prices are hedged with some method, or when the price movement is limited by external factors such as a price cap.
For your own experiments you can play around with martingale and grid trading systems with the code examples under Tips&Tricks.

---------------------------------
* After how many trades will a martingale system erase your account? Assume that you invest 1% of your equity per trade. After a loss you double your investment: 2%, 4%, 8%, 16%, 32%... that sums up to 63% after 5 losses, so the sixth loss will exceed 100% and cause a margin call. With 50% win rate and uncorrelated returns, the probability of 6 consecutive losses is 0.5^6 = 0.015625. The probability of this event in n trades is (1-0.015625)^n, so the number of trades until the margin call probability exceeds 50% is log(0.5)/log(1-0.015625) = 44. With one trade per day, your account will last about 2 months. A higher win rate, like 90%, won't help - the average loss is then normally also 9x higher, so the account lifetime is still the same 2 months. Investing only 0.1% instead - $10 per $10,000 capital - would extend the average account survival time to about 17 months.

** How much capital do you need for a grid trader to survive a straight price move? Assume that you have n open trades and the price moves by x pips, x being much larger than the grid size. The move will then increase the balance by x pips and reduce the open trade value by about n/2 * x pips, causing an overall equity drawdown of (n/2-1) * x pips. On a Forex account with 10 mini lots trade size, 1 $ pip cost, and an average of 20 open trades, a 500 pips (5 cents) price move produces a 9*10*500*1$ = 45,000 $ drawdown. Such moves can occur several times per year.

http://www.zorro-trader.com/manual/en/strategy.htm
2
Matthew Todorovski
Matthew Todorovski 2014.11.08
Crazy
Tobias Fedier
Tobias Fedier 2014.11.09
Thanks Matthew ^^
Tobias Fedier
Tobias Fedier
Ur a gambler right? NO im a TRADER! ^^ haha great

https://www.youtube.com/watch?v=Q0Hdujz7CcA
Tobias Fedier
Tobias Fedier
This is insane!!!! 10k deposit to 285k profit....
Tobias Fedier
Tobias Fedier 2014.11.06
Arbitrage EA
asaqaz
asaqaz 2014.11.06
could you put the link to take a look ?
Tobias Fedier
Tobias Fedier 2014.11.06
Link??
Osiris
Osiris
......
2
Tobias Fedier
Registered at MQL5.community