Mega Spike Boom Crash
- Indicators
- Cristofher Robles
- Version: 1.0
- Activations: 5
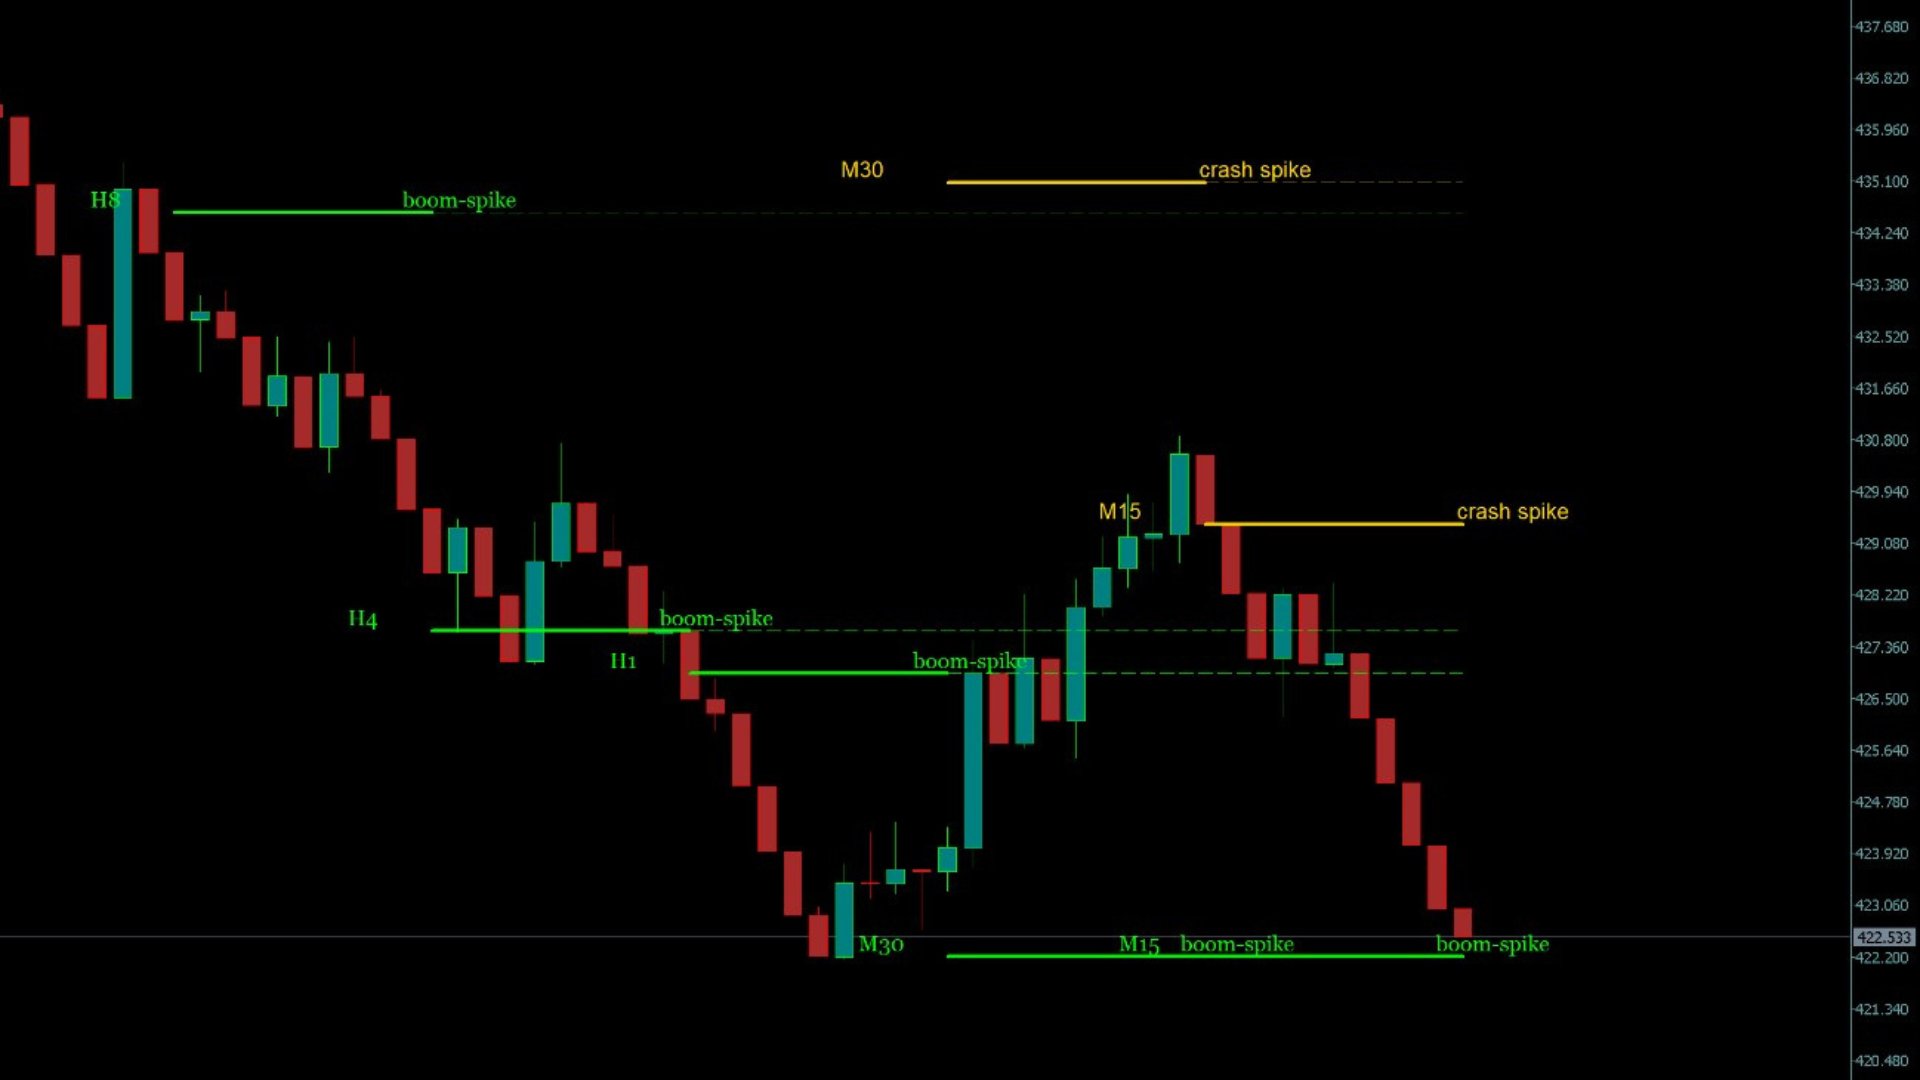
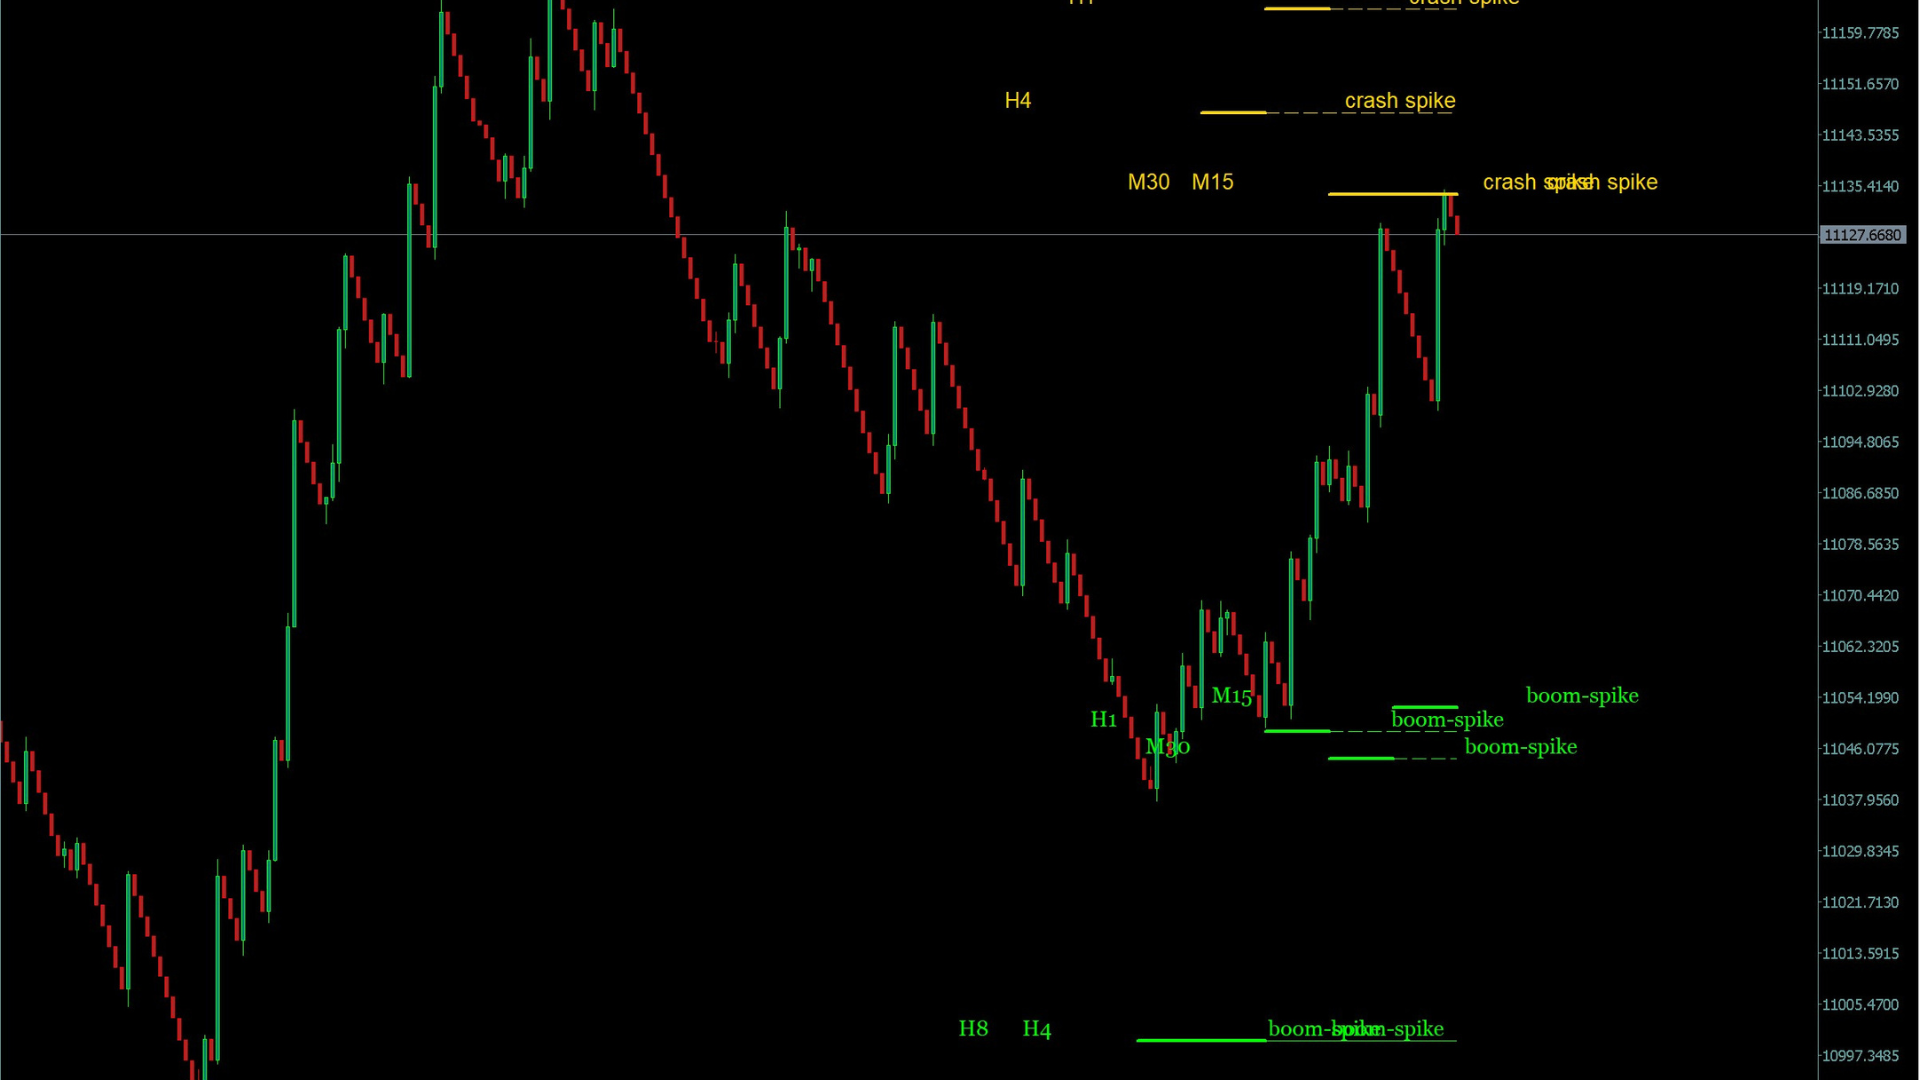
El indicador "Mega Spike Boom and Crash" es una herramienta diseñada para su uso en los índices sintéticos, específicamente en los pares Boom y Crash. Su propósito principal es identificar y trazar zonas que funcionan como niveles de soporte y resistencia en distintas temporalidades.
La temporalidad mas recomendada para usar este indicador es en el marco de tiempo de 5 minutos
El precio de apertura de ( 1 H , 15 M , 30M ) horas son los niveles de precios más importante del día. Representa el equilibrio entre la dirección alcista y bajista .