• Overview
  • Reviews
  • Comments
  • What's new

Patternist

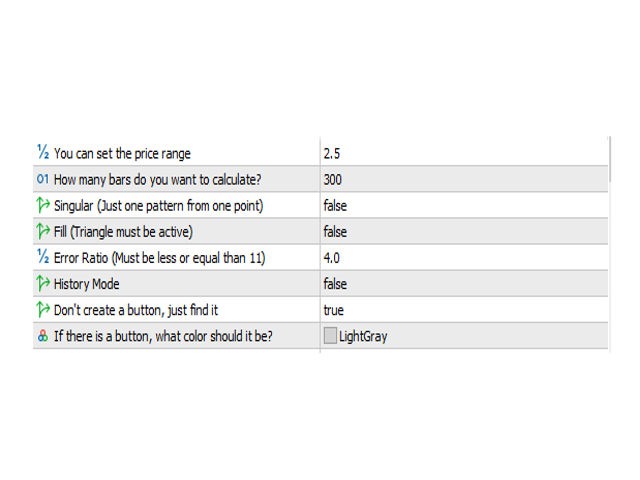
* Corrected and accelerated zigzag. (You can change the range)

* The zigzag is updated with each new candle/bar.

* If you want, by activating the button, only when you click the button, it searches for a pattern. If you do it automatically, it searches every time the chart is refreshed.

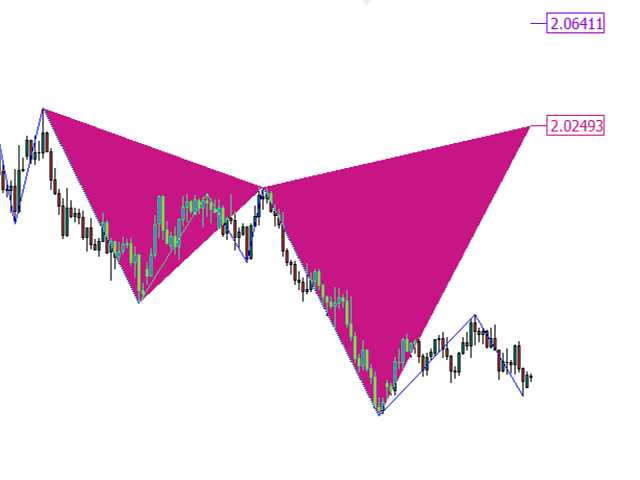
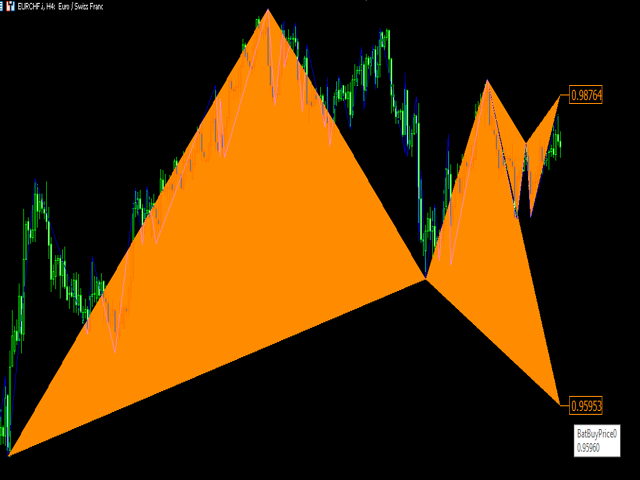
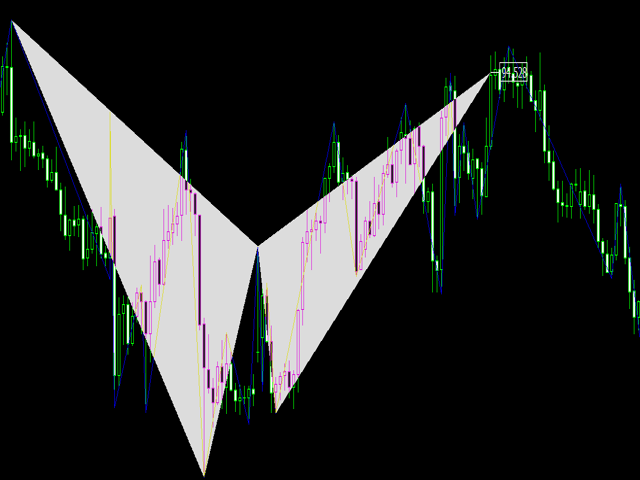
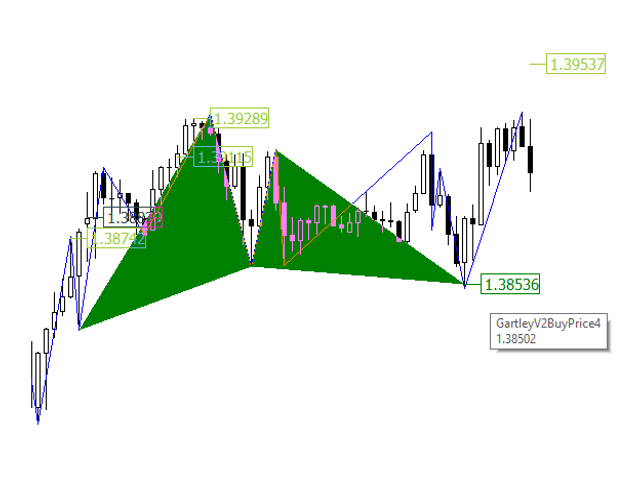
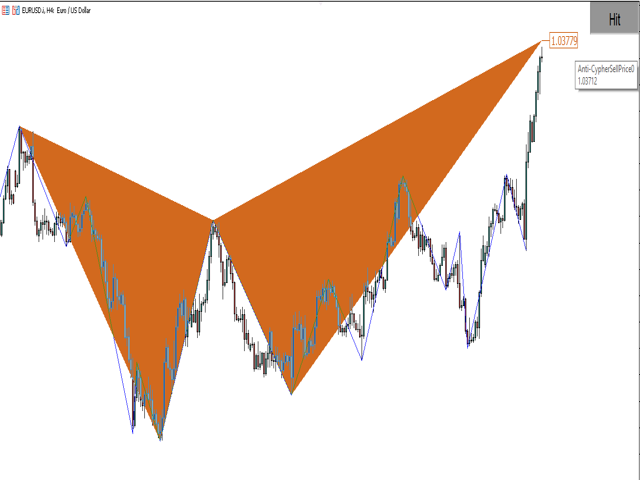
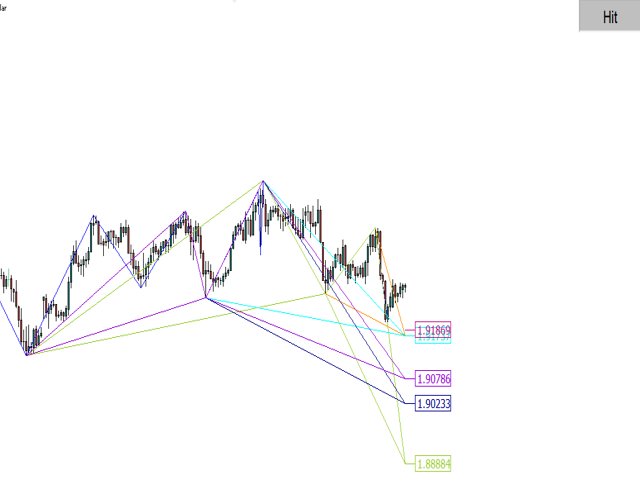
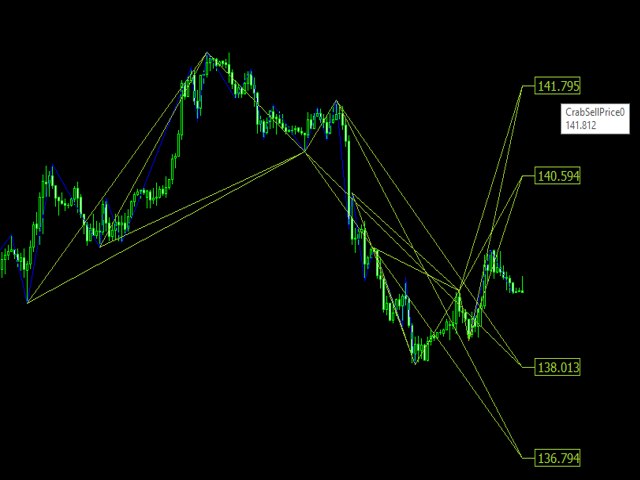
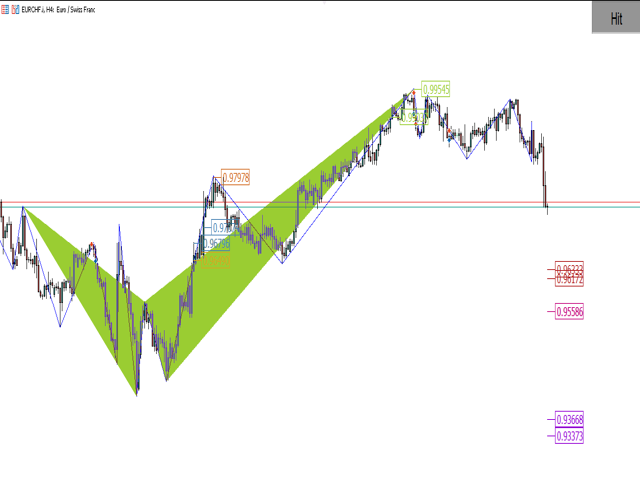
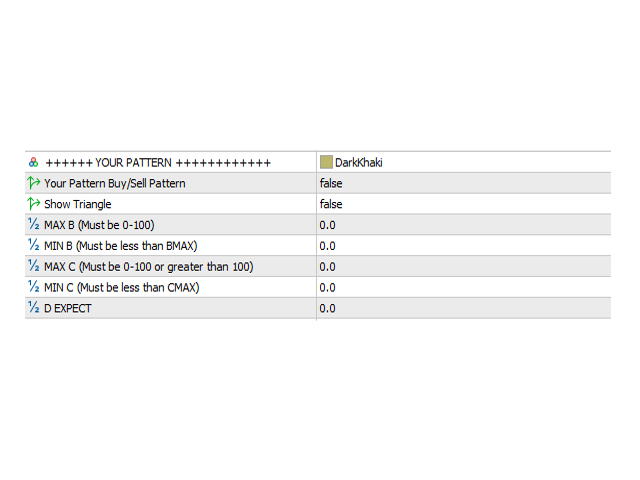
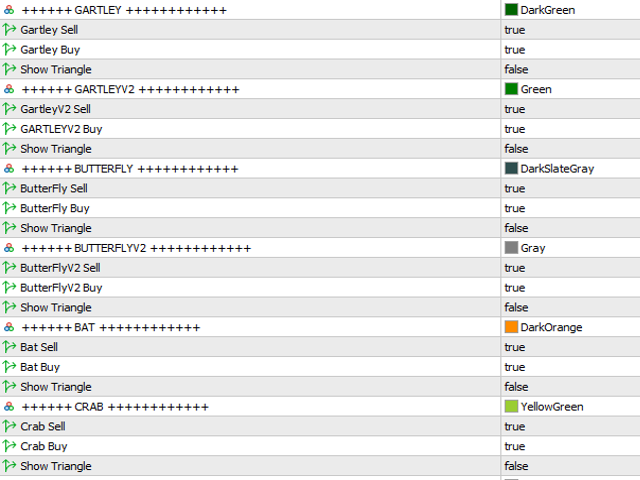
* 17 frequently used harmonic patterns and a special pattern that you can define your own proportions.

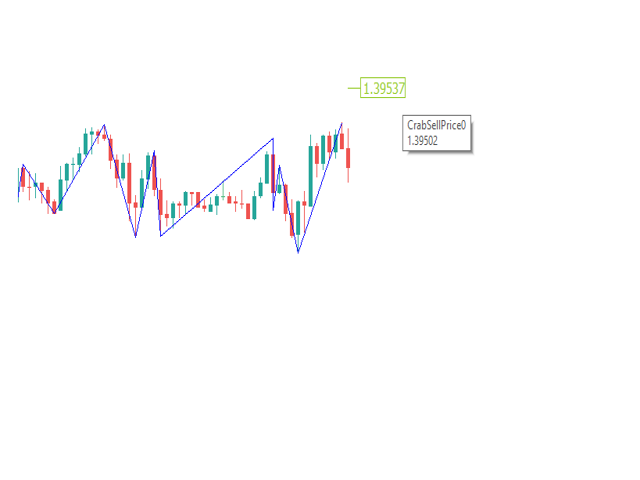
* You can keep the chart simple with the price display. You can make a triangle representation if you want.

* You can review past performances with "History Mode".

* Does not repaint.

* If the pattern rules are not valid, the pattern is deleted. If the price reaches the specified level, it is possible to buy/sell.

* Note: You can set all other patterns to "false" and set your own proportions. You can test your own pattern with history mode. If you are satisfied with the result, you can save it as a template.

* Patterns:

* Custon Pattern (Your Special Ratios)

* Gartley

* GarleyV2

* ButterFly

* ButterFlyV2

* Bat

* Crab

* Deep Crab

* Cypher

* Shark

* NenStar

* Anti ButterFly

* Anti Bat

* Anti Crab

* Anti Cypher

* Anti Gartley

* Anti AShark

* Anti NenStar

Recommended products
This indicator will show you the TP and SL Values (in that currency) that you already set  for every orders on the charts  ( closed to the transaction/order line)  that will help you a lot to estimated your profit and loss for every order.    And it also show you the PIPs values too.  the shown format  is      " Currency Values of our Profit or Loss /  PIPs values ".    The TP Value will be shown in Green Color and  the SL Value  will be shown in Red Color.  For any question or more information,
- This is the exact conversion from TradingView: "Support/Resistance" By "BarsStallone". - This indicator lets you read the buffers for R/S values. - This is a non-repaint and light processing load indicator. - This is not a multi time frame indicator If you want the multi time frame version you should create a personal order and I deliver two files that you need them both to have the multi time frame indicator running on your system. - The MT4 version of the indicator is not light load from pr
up down v6 for mt5 is no repaint all timeframe and all pairs indicator. red histogram cros trigger that is up point,and put a red point on histogram. and blue histogram cros trigger that is deep point.and put blue point on histogram. this indicator need to sometimes zoom out .for thise pres + button. if newly comes signal is too high makes before invisible.red and blue points are there.to see the signals. indicator is no repaint and can use all time frame and all pairs. only need minimum 500 bar
First of all Its worth emphasizing here that this Trading System is Non-Repainting, Non-Redrawing and Non-Lagging Indicator, Which makes it ideal for professional trading. Online course, user manual and demo. The "Smart Support and Resistance Trading System" is an advanced indicator tailored for  new  and  experienced  traders. It empowers traders with precision and confidence in the forex market. This comprehensive system combines 7+ strategies, 10 indicators, and various trading approaches,
Introducing the Order Block Indicator , the pinnacle of trading technology. Order blocks, the large cluster of buy or sell orders placed by institutional traders, significantly influence market direction. They form at critical price levels and can act as robust support and resistance zones. Our cutting-edge indicator allows you to harness the full potential of these influential market dynamics, providing a never-before-seen level of precision and customization. Here's why this tool stands apart:
Upgraded - Stars added to indentify Areas you can scale in to compound on your entry  when buying or selling version 2.4 Upgraded Notifications and alerts added version 2.3 *The indicator is suitable for all pairs fromm  Deriv pairs (Vix,jump,boom & crash indices) , Currencies, cryptos , stocks(USA100, USA30 ), and metals like gold etc. How does it work? Increasing the period make it more stable hence will only focus on important entry points However  lowering the period will mean the indica
OHLC Volume
Mahmoud Helmy Sedik Mohamed Mansour
OHLC Volume Histogram displays the difference between two streams of the  OHLC Volume volume indicator  as a colored histogram. There are no input parameters. Calculation: Histogram = StreamUP - StreamDN where: StreamUP = Volume * UP_Coeff / (UP_Coeff+DN_Coeff) StreamDN = Volume * DN_Coeff / (UP_Coeff+DN_Coeff) UP_Coeff = High-Open DN_Coeff = Close-Low Volume - tick volume
Fibonacci and RSI Demo version MQL5
Carlos Daniel Vazquez Rosas
4 (1)
Fibonacci and RSI. Demo versión only works with GBPUSD. For full version, please, visit visit https://www.mql5.com/en/market/product/52101 The indicator is a combination of the Fibonacci and RSI indicators. Every time the price touches one of the fibonacci levels and the rsi condition is met, an audible alert and a text alert are generated. Parameters number_of_candles : It is the number of candles that will be calculated. If you put 100, the indicator will give you the maximum and min
FREE
Double HMA MTF for MT5
Pavel Zamoshnikov
3.67 (3)
This is an advanced multi-timeframe version of the popular Hull Moving Average (HMA) Features Two lines of the Hull indicator of different timeframes on the same chart. The HMA line of the higher timeframe defines the trend, and the HMA line of the current timeframe defines the short-term price movements. A graphical panel with HMA indicator data from all timeframes at the same time . If the HMA switched its direction on any timeframe, the panel displays a question or exclamation mark with a tex
The rubdfx divergence indicator is a technical analysis tool that compares a security's price movement. It is used to identify potential changes in the price trend of a security. The indicator can be applied to any type of chart, including bar charts and candlestick charts. The algorithm is based on MACD, which has been modified to detect multiple positive and negative divergences. Settings  ___settings___ * fastEMA * slowEMA * signalSMA *Alerts:   True/False     #Indicator Usage B
Royal Wave Pro M5
Vahidreza Heidar Gholami
3.5 (4)
Royal Wave is a Trend-Power oscillator which has been programmed to locate and signal low-risk entry and exit zones. Its core algorithm statistically analyzes the market and generates trading signals for overbought, oversold and low volatile areas. By using a well-designed alerting system, this indicator makes it easier to make proper decisions regarding where to enter and where to exit trades. Features Trend-Power Algorithm Low risk Entry Zones and Exit Zones Predictions for Overbought and Over
KT Pin Bar MT5
KEENBASE SOFTWARE SOLUTIONS
KT Pin Bar identifies the pin bar formation which is a type of price action pattern which depicts a sign of reversal or rejection of the trend. When combined with support and resistance, BRN and other significant levels, Pin Bar pattern proved to be a very strong sign of reversal. Basically, a pin bar is characterized by a small body relative to the bar length which is closed either in upper or lower 50% part of its length. They have very large wicks and small candle body. A pin bar candlest
HiqIndi
Ratul Goswami
It is 1 Minute Strategy. When Indicator Gives Signal Then Put on Buy. It's Best Work on Crash 300 & Crash 500. If you want to know anything details please Contact Me on Telegram In this Link:  https://t.me/+mi_52VwFp3E4MGNl It is very nice for scalping & for who not gives enough time on market. N/B: Please be carefully it's only for scalping & not trade all the day. It's only 10 or maximum 15 trade per day. Thanks everyone.
The megaphone pattern is another chart pattern used for technical analysis. There is usually a lot of volatility happening when you spot it in the wild….and volatility equals opportunity in the world of trading. This pattern is famous for its “broadening formation” and the price action also warns of the increased risk ahead. The megaphone chart pattern provides unique entries and exits off different sides of its structure. [ Installation Guide | Update Guide | Troubleshooting | FAQ | All Pro
First of all Its worth emphasizing here that this Trading Tool is Non Repainting , Non Redrawing and Non Lagging Indicator , Which makes it ideal for professional trading . Online course, user manual and demo. The Smart Price Action Concepts Indicator is a very powerful tool for both new and experienced traders . It packs more than 20 useful indicators into one , combining advanced trading ideas like Inner Circle Trader Analysis and Smart Money Concepts Trading Strategies . This indicator focus
To download MT4 version please click here . - This is the exact conversion from TradingView: "Trend Direction Force Index - TDFI [wm]" By "causecelebre". - This indicator uses multiple levels of averaging to detect trend strength. - You can optimize filter low and filter high levels to achieve best results. - You have access to buffers to use in EAs. - This is a light-load processing and non-repaint indicator. - You can message in private chat for further changes you need.
This is the spike indicator , determining the highest high and lowest lows of price in the given period ,  it is also a zigzag indicator , to it may recalculate the values  or repaint if a new higher high or lower low forms in that given period,so beware How ever the indicator can be very powerful when used with other technical indicators for entry confirmation  Be sure to check out some of my other premium products   
Mini Chart Indicators
Flavio Javier Jarabeck
The Metatrader 5 has a hidden jewel called Chart Object, mostly unknown to the common users and hidden in a sub-menu within the platform. Called Mini Chart, this object is a miniature instance of a big/normal chart that could be added/attached to any normal chart, this way the Mini Chart will be bound to the main Chart in a very minimalist way saving a precious amount of real state on your screen. If you don't know the Mini Chart, give it a try - see the video and screenshots below. This is a gr
TrendDetect
Pavel Gotkevitch
The Trend Detect indicator combines the features of both trend indicators and oscillators. This indicator is a convenient tool for detecting short-term market cycles and identifying overbought and oversold levels. A long position can be opened when the indicator starts leaving the oversold area and breaks the zero level from below. A short position can be opened when the indicator starts leaving the overbought area and breaks the zero level from above. An opposite signal of the indicator can
KT Horizontal Lines MT5
KEENBASE SOFTWARE SOLUTIONS
In MetaTrader, plotting multiple   horizontal lines   and then tracking their respective price levels can be a hassle. This indicator automatically plots multiple horizontal lines at equal intervals for setting price alerts, plotting support and resistance levels, and other manual purposes. This indicator is suitable for Forex traders who are new and looking for chances to make quick profits from buying and selling. Horizontal lines can help traders find possible areas to start trading when the
KT Price Border MT5
KEENBASE SOFTWARE SOLUTIONS
KT Price Border creates a three-band price envelope that identifies potential swing high and low areas in the market. These levels can also be used as dynamic market support and resistance. The mid-band can also be used to identify the trend direction. As a result, it also functions as a trend-following indicator. In addition, its ease of use and more straightforward conveyance of trade signals significantly benefit new traders. Features It works well on most of the Forex currency pairs. It
This is an MTF indicator of support and resistance levels based on Advanced ZigZag Dynamic and/or Extended Fractals indicator extremums with price labels (can be disabled). More higher TFs can be selected for MTF mode. By default, the levels are generated based on ZigZag indicator dots. Fractals indicator dots can also be used together with ZigZag or instead of it. In order to simplify the use and save CPU time, calculation is performed once per each bar at its opening. Parameters: ForcedTF - ch
Your Trend Friend
Luigi Nunes Labigalini
5 (1)
The trend is your friend! Look at the color of the indicator and trade on that direction. It does not  repaint. After each candle is closed, that's the color of the trend. You can focus on shorter faster trends or major trends, just test what's most suitable for the symbol and timeframe you trade. Simply change the "Length" parameter and the indicator will automatically adapt. You can also change the color, thickness and style of the lines. Download and give it a try! There are big movements
How to use Pair Trading Station Pair Trading Station is recommended for H1 time frame and you can use it for any currency pairs. To generate buy and sell signal, follow few steps below to apply Pair Trading Station to your MetaTrader terminal. When you load Pair Trading Station on your chart, Pair Trading station will assess available historical data in your MetaTrader platforms for each currency pair. On your chart, the amount of historical data available will be displayed for each currency pai
The indicator determines the state of the market: trend or flat. The state of the market is determined by taking into account volatility. The flat (trading corridor)is displayed in yellow. The green color shows the upward trend. The red color shows the downward trend. The height of the label corresponds to the volatility in the market. The indicator does not redraw . Settings History_Size   - the amount of history for calculation. Period_Candles  - the number of candles to calculate the
Higher High Lower Low MT5
KEENBASE SOFTWARE SOLUTIONS
KT Higher High Lower Low marks the following swing points with their respective S/R levels: Higher High: The swing high made by the price that is higher than the previous high. Lower High: The swing high made by the price that is lower than the previous high. Lower Low: The swing low made by the price that is lower than the previous low.  Higher Low: The swing low made by the price that is higher than the previous low.   Features The intensity of swing high and swing low can be adjusted by cha
"Pattern 123" is an indicator-a trading system built on a popular pattern, pattern 123. This is the moment when we expect a reversal on the older trend and enter the continuation of the small trend, its 3rd impulse. The indicator displays signals and markings on an open chart. You can enable/disable graphical constructions in the settings. The indicator has a built-in notification system   (email, mobile terminal, standard terminal alert). "Pattern 123" has a table that displays signals fr
Pips On Candles
Giuseppe Nittoli
Pips on Candles shows the number of pips involved in each candle on the chart. It is possible to set 3 different ranges for counting on each single candle via the RangeType parameter: With "HighLow" you count the pips present between the minimum and the maximum. The number is shown under each candlestick on the chart. With "OpenClose" you count the pips present between the opening and closing price of the candle. The number is shown under each candlestick on the chart. With "HighDistAndLowDist"
To get access to MT4 version click   here . This is the exact conversion from TradingView: "Trendlines with Breaks" by LuxAlgo This is a REPAINT indicator. Buffers are available for processing.  However there are objects on chart to process also. All input fields are available.  Alerts are generated based on bars closure. You can message in private chat for further changes you need. Thanks for downloading
Trend Side - a technical indicator for determining the trend. It is a set of several full-fledged trading strategies. The indicator uses an advanced trend filtering system, has a statistical panel, calculates entry and exit levels, and calculates the dynamic Trailing Stop level. Suitable for any type of symbols, never redraws its signals and results. A comprehensive tool for professional trend trading. The set of the Trend Side indicator also includes Andrews Trend Scanner - a multi-currency
Buyers of this product also purchase
Atomic Analyst MT5
Issam Kassas
5 (14)
First of all Its worth emphasizing here that this Trading Indicator is   Non-Repainting   , Non Redrawing and Non Lagging Indicator   Indicator, Which makes it ideal from both manual and robot trading.  User manual: settings, inputs and strategy . The Atomic Analyst  is a PA Price Action Indicator that uses Strength and Momentum of the price to find a better edge in the market. Equipped with Advanced filters which help remove noises and false signals, and Increase Trading Potential. Using Mult
First of all Its worth emphasizing here that this Trading System is Non-Repainting   , Non Redrawing and Non Lagging Indicator Which makes it ideal from both manual and robot trading .  Online course, manual and download presets. The Smart Trend Trading System MT5 is a comprehensive trading solution tailored for new and experienced traders . It combines over 10 premium indicators and features more than 7 robust trading strategies , making it a versatile choice for diverse market conditions . Tre
Quantum Trend Sniper
Bogdan Ion Puscasu
5 (41)
Introducing   Quantum Trend Sniper Indicator , the groundbreaking MQL5 Indicator that's transforming the way you identify and trade trend reversals! Developed by a team of experienced traders with trading experience of over 13 years,   Quantum Trend Sniper Indicator   is designed to propel your trading journey to new heights with its innovative way of identifying trend reversals with extremely high accuracy. ***Buy Quantum Trend Sniper Indicator and you could get Quantum Breakout Indicator fo
Trend Screener Pro MT5
STE S.S.COMPANY
4.88 (64)
Unlock the Power of  Trends trading with Trend Screener Indicator: Your Ultimate Trend Trading Solution powered by fuzzy logic and Multi-currencies System ! Elevate your trend trading with Trend Screener, the revolutionary trend indicator powered by   fuzzy logic.  It is a powerful trend-following indicator that combines over  13 premium tools and features and 3 trading strategies  , making it a versatile choice to   make your Metatrader a Trend Analyzer. LIMITED TIME OFFER : Trend Screener Indi
Reversal First Impulse levels (RFI)      INSTRUCTIONS        RUS       -       ENG              R ecommended to use with an indicator   -   TREND PRO -  Version MT4                 A key element in trading is zones or levels from which decisions to buy or sell a trading instrument are made. Despite attempts by major players to conceal their presence in the market, they inevitably leave traces. Our task was to learn how to identify these traces and interpret them correctly. Main functions:: Di
Gold Stuff mt5
Vasiliy Strukov
4.89 (175)
Gold Stuff mt5 is a trend indicator designed specifically for gold and can also be used on any financial instrument. The indicator does not redraw and does not lag. Recommended time frame H1. Contact me immediately after the purchase to get   personal bonus!  You can get a free copy of our Strong Support and Trend Scanner indicator, please pm. me! Settings  and manual   here   SETTINGS Draw Arrow - on off. drawing arrows on the chart. Alerts -   on off audible alerts. E-mail notification - on of
FxaccurateLS
Shiv Raj Kumawat
WHY IS OUR FXACCCURATE LS MT5 THE PROFITABLE ? PROTECT YOUR CAPITAL WITH RISK MANAGEMENT Gives entry, stop and target levels from time to time. It finds Trading opportunities by analyzing what the price is doing during established trends. POWERFUL INDICATOR FOR A RELIABLE STRATEGIES We have made these indicators with a lot of years of hard work. It is made at a very advanced level. Established trends provide dozens of trading opportunities, but most trend indicators completely ignore them!
IVISTscalp5
Vadym Zhukovskyi
5 (4)
We present you the iVISTscalp5 indicator, which is not only unique, but also effective in the analysis of trading operations. This indicator is based on time data and is the result of many years of experience and deep analysis of financial markets. The iVISTscalp5 indicator is an excellent assistant for manual trading. Convenience, simplicity and visualization. All the most difficult is hidden inside. We have simplified the settings and use of the iVISTscalp5 indicator as much as possible. The i
Quantum Heiken Ashi PRO MT5
Bogdan Ion Puscasu
4.5 (8)
Introducing the Quantum Heiken Ashi PRO charts with integrated alerts Designed to provide clear insights into market trends, the Heiken Ashi candles are renowned for their ability to filter out noise and eliminate false signals. Say goodbye to confusing price fluctuations and hello to a smoother, more reliable chart representation. What makes the Quantum Heiken Ashi PRO truly unique is its innovative formula, which transforms traditional candlestick data into easy-to-read colored bars. Red and g
ICT, SMC, SMART MONEY CONCEPTS, SMART MONEY, Smart Money Concept, Support and Resistance, Trend Analysis, Price Action, Market Structure, Order Blocks, BOS/CHoCH,   Breaker Blocks ,  Momentum Shift,   Supply&Demand Zone/Order Blocks , Strong Imbalance, HH/LL/HL/LH,    Fair Value Gap, FVG,  Premium  &   Discount   Zones, Fibonacci Retracement, OTE, Buy Side Liquidity, Sell Side Liquidity, BSL/SSL Taken, Equal Highs & Lows, MTF Dashboard, Multiple Time Frame, BigBar, HTF OB, HTF Market Structure, 
FX Volume MT5
Daniel Stein
4.94 (17)
Visit our all-new   Stein Investments Welcome Page   to get the latest information, updates and trading strategies. FX Volume is the FIRST and ONLY volume indicator that provides a REAL insight into the market sentiment from a broker's point of view. It provides awesome insights into how institutional market participants, like brokers, are positioned in the Forex market, much faster than COT reports. Seeing this information directly on your chart is the real game-changer and breakthrough solut
Profit from market structure changes as price reverses and pulls back. The market structure reversal alert indicator identifies when a trend or price move is approaching exhaustion and ready to reverse. It alerts you to changes in market structure which typically occur when a reversal or major pullback are about to happen. The indicator identifies breakouts and price momentum initially, every time a new high or low is formed near a possible exhaustion point. The indicator draws in a rectangle on
Volume by Price MT5
Brian Collard
5 (4)
The Volume by Price Indicator for MetaTrader 5 features Volume Profile and Market Profile TPO (Time Price Opportunity). Volume and TPO histogram bar and line charts. Volume Footprint charts. TPO letter and block marker collapsed and split structure charts. Session filtering and grouping. Static, dynamic and flexible range segmentation and compositing methods with relative and absolute visualizations. Graphical layering, positioning and styling options to suit the user's analytic and aesthetic n
TPSproTREND PrO MT5
Roman Podpora
4.86 (7)
TPSpro TRENDPRO  - is a trend indicator that automatically analyzes the market and provides information about the trend and each of its changes, as well as giving signals for entering trades without redrawing! The indicator uses each candle, analyzing them separately. referring to different impulses - up or down impulse. Exact entry points into transactions for currencies, crypto, metals, stocks, indices!  -  Version MT4               DETAILED DESCRIPTION               R ecommended to use with
Introducing the Power Trade Plus indicator designed by a small group of traders with a few years of experience trading the market profitably.  The Power Trade Plus is derived from the Power Trade indicator,  the indicator strive in powerful sniper entries and take profit levels,  with an algorithm that's can determine the markets volatility and Provides entries based on the current market volatility. This indicator is much more effective in stock ,currencies and indices.
AW Trend Predictor MT5
AW Trading Software Limited
4.78 (58)
The combination of trend and breakdown levels in one system. An advanced indicator algorithm filters market noise, determines the trend, entry points, as well as possible exit levels. Indicator signals are recorded in a statistical module, which allows you to select the most suitable tools, showing the effectiveness of the signal history. The indicator calculates Take Profit and Stop Loss marks. Manual and instruction ->  HERE  / MT4 version ->  HERE How to trade with the indicator:  Trading wit
Introducing   Quantum Breakout PRO , the groundbreaking MQL5 Indicator that's transforming the way you trade Breakout Zones! Developed by a team of experienced traders with trading experience of over 13 years,   Quantum Breakout PRO   is designed to propel your trading journey to new heights with its innovative and dynamic breakout zone strategy. Quantum Breakout Indicator will give you signal arrows on breakout zones with 5 profit target zones and stop loss suggestion based on the breako
RelicusRoad Pro MT5
Relicus LLC
4.83 (23)
How many times have you bought a trading indicator with great back-tests, live account performance proof with fantastic numbers and stats all over the place but after using it, you end up blowing your account? You shouldn't trust a signal by itself, you need to know why it appeared in the first place, and that's what RelicusRoad Pro does best! NOW $147 (increasing to $499 after a few updates) - UNLIMITED ACCOUNTS (PCs or MACs) **  User Manual + Strategies + Training Videos + Private Group with
Advanced Supply Demand MT5
Bernhard Schweigert
4.53 (15)
Best Solution for any Newbie or Expert Trader! This indicator is a unique, high quality and affordable trading tool because we have incorporated a number of proprietary features and a new formula. With this update, you will be able to show double timeframe zones. You will not only be able to show a higher TF but to show both, the chart TF, PLUS the higher TF: SHOWING NESTED ZONES. All Supply Demand traders will love it. :) Important Information Revealed Maximize the potential of Advanced Suppl
TPA True Price Action indicator reveals the true price action of the market makers through 100% non-repainting signals strictly at the close of a candle! TPA shows entries and re-entries, every time the bulls are definitely stronger than the bears and vice versa. Not to confuse with red/green candles. The shift of power gets confirmed at the earliest stage and is ONE exit strategy of several. There are available now two free parts of the TPA User Guide for our customers. The first "The Basics"
Royal Scalping Indicator M5
Vahidreza Heidar Gholami
5 (8)
Royal Scalping Indicator is an advanced price adaptive indicator designed to generate high-quality trading signals. Built-in multi-timeframe and multi-currency capabilities make it even more powerful to have configurations based on different symbols and timeframes. This indicator is perfect for scalp trades as well as swing trades. Royal Scalping is not just an indicator, but a trading strategy itself. Features Price Adaptive Trend Detector Algorithm Multi-Timeframe and Multi-Currency Trend Low
Trend Line Map Pro MT5
STE S.S.COMPANY
4.67 (9)
Trend Line Map indicator is an addons for   Trend Screener Indicator . It's working as a scanner for all signals generated by Trend screener ( Trend Line Signals ) . It's a Trend Line Scanner based on Trend Screener Indicator.  If you don't have Trend Screener Pro Indicator,   the Trend Line Map Pro will not work.     LIMITED TIME OFFER : Trend Line Map Indicator is available for only 50 $ and lifetime. ( Original price 125$ ) By accessing to our MQL5 Blog,  you can find all our premium indica
Italo Trend Indicator MT5
Italo Santana Gomes
4.89 (9)
BUY INDICATOR AND GET EA FOR FREE AS A BONUS + SOME OTHER GIFTS! ITALO TREND INDICATOR  is the best trend indicator on the market, the Indicator works on all time-frames and assets, indicator built after 7 years of experience on forex and many other markets. You know many trend indicators around the internet are not complete, does not help, and it's difficult to trade, but the Italo Trend Indicator is different , the Italo Trend Indicator shows the signal to buy or sell, to confirm the signal t
Matrix Arrow Indicator MT5
Juvenille Emperor Limited
5 (14)
Matrix Arrow Indicator MT5  is a unique 10 in 1 trend following   100% non-repainting  multi-timeframe indicator that can be used on all symbols/instruments:   forex,   commodities,   cryptocurrencies,   indices,   stocks .  Matrix Arrow Indicator MT5  will determine the current trend at its early stages, gathering information and data from up to 10 standard indicators, which are: Average Directional Movement Index (ADX) Commodity Channel Index (CCI) Classic Heiken Ashi candles Moving Aver
The ADR Reversal Indicator shows you at a glance where price is currently trading in relation to it's normal average daily range. You will get instant alerts via pop-up, email or push when price exceeds it's average range and levels above it of your choosing so you can jump into pullbacks and reversals quickly. The indicator draws horizontal lines on the chart at the average daily range extremes and also extensions above those levels which have mathematical probabilities attached to them of pric
Auto Order Block with break of structure based on ICT and Smart Money Concepts (SMC) Futures Break of Structure ( BoS )             Order block ( OB )            Higher time frame Order block / Point of Interest ( POI )    shown on current chart           Fair value Gap ( FVG ) / Imbalance   -  MTF      ( Multi Time Frame )    HH/LL/HL/LH  -  MTF      ( Multi Time Frame )  Choch  MTF      ( Multi Time Frame )  Volume Imbalance     ,  MTF          vIMB Gap’s Power of 3  ( PO3) Equ
Bill Williams Advanced
Siarhei Vashchylka
5 (5)
Bill Williams Advanced is designed for automatic chart analysis using Bill Williams' "Profitunity" system. The indicator analyzes four timeframes at once. Manual (Be sure to read before purchasing) Advantages 1. Automatically analyzes the chart using the "Profitunity" system of Bill Williams. The found signals are placed in a table in the corner of the screen. 2. Equipped with a trend filter based on the Alligator indicator. Most of the system signals are recommended to be used only accordi
Owl Smart Levels MT5
Sergey Ermolov
4.43 (37)
MT4 version  |   FAQ The Owl Smart Levels Indicator is a complete trading system within the one indicator that includes such popular market analysis tools as Bill Williams' advanced fractals , Valable ZigZag which builds the correct wave structure of the market, and Fibonacci levels which mark the exact levels of entry into the market and places to take profits. Detailed description of the strategy Instructions for working with the indicator Advisor-assistant in trading Owl Helper Private User
This dashboard shows the latest available   harmonic patterns   for the selected symbols, so you will save time and be more efficient /   MT4 version . Free Indicator:   Basic Harmonic Pattern Indicator columns Symbol:  the selected symbols will appear Trend:   bullish or bearish Pattern:  type of pattern (gartley, butterfly, bat, crab, shark, cypher or ABCD) Entry:  entry price SL:  stop loss price TP1:   1st take profit price TP2:  2nd take profit price TP3:  3rd take profit price Current
MetaBands M5
Vahidreza Heidar Gholami
4.67 (3)
MetaBands uses powerful and unique algorithms to draw channels and detect trends so that it can provide traders with potential points for entering and exiting trades. It’s a channel indicator plus a powerful trend indicator. It includes different types of channels which can be merged to create new channels simply by using the input parameters. MetaBands uses all types of alerts to notify users about market events. Features Supports most of the channel algorithms Powerful trend detection algorith
Filter:
No reviews
Reply to review
Version 2.0 2022.11.27
Fixed some bugs related to History Mode.