• Overview
  • Reviews
  • Comments

Wapv Price and volume

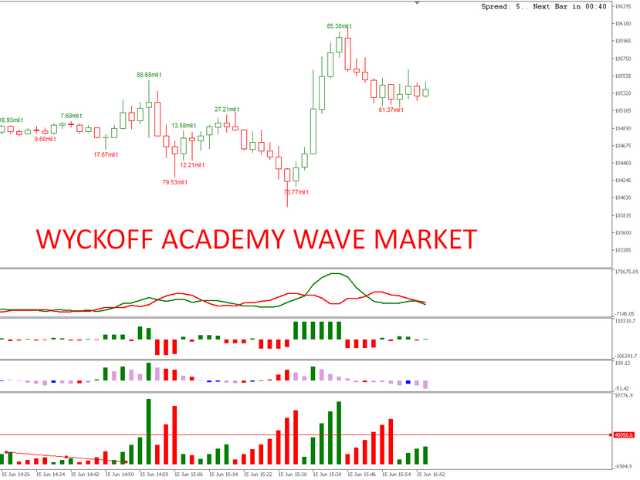
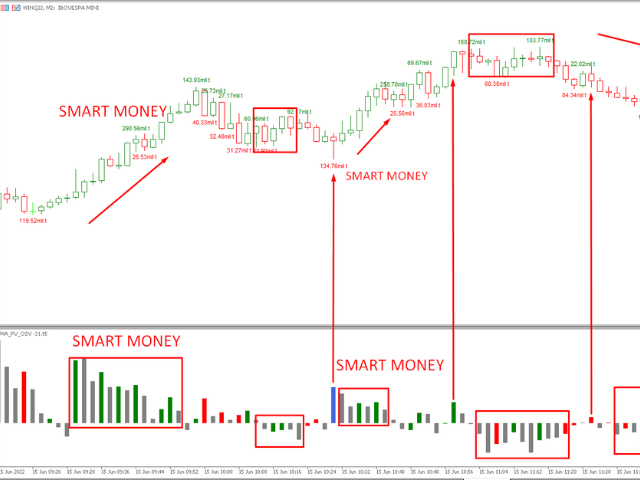
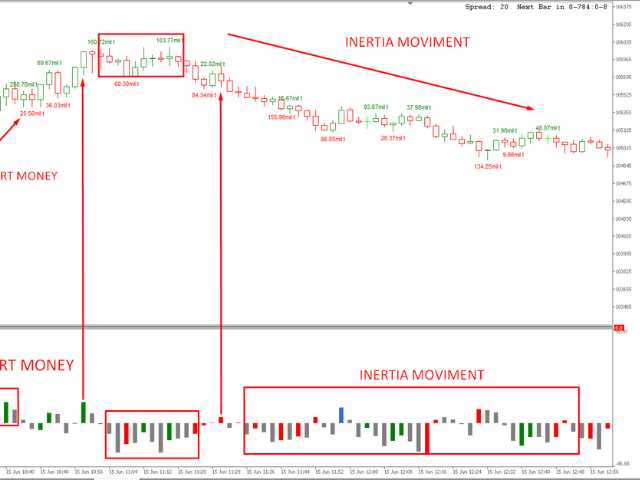
The WAPV Price and Volume Indicator for MT5 is part of the (Wyckoff Academy Wave Market) and (Wyckoff Academy Price and Volume) toolset. The WAPV Price and Volume Indicator for MT5 was created to make it easy to visualize the volume movement on the chart in an intuitive way. With it you can observe the moments of peak volume and moments when the market has no professional interest Identify moments when the market is moving by inertia and not by movement of "smart money". It consists of 4 colors that can be modified by the user. Red = Increase in Offer Green = Increase in demand Gray Candle = decrease in demand and supply Blue = Smart Money Acting Movements in an upward direction indicate strength. Downward movement Indicates weakness. Regardless of the direction of Price, the strongest Volume needs to be going up. indicator created based on the theory of R. Wyckoff


Recommended products
The Accumulation / Distribution is an indicator which was essentially designed to measure underlying supply and demand. It accomplishes this by trying to determine whether traders are actually accumulating (buying) or distributing (selling). This indicator should be more accurate than other default MT5 AD indicator for measuring buy/sell pressure by volume, identifying trend change through divergence and calculating Accumulation/Distribution (A/D) level. Application: - Buy/sell pressure: above
45 USD
Order Book, known also as Market Book, market depth, Level 2, - is a dynamically updated table with current volumes of orders to buy and to sell specific financial instument at price levels near Bid and Ask. MetaTrader 5 provides the means for receiving market book from your broker, but in real time only, without access to its history. The indicator OrderBook Cumulative Indicator accumulates market book data online and visualizes them on the chart. In addition, the indicator can show the market
49 USD
Trend Fibonacci is a unique indicator that combines a power of Fibonacci sequences and ranges. How to read: - There are three zones --> red, gold and green - Red candlestick = downtrend - Green candlestick = uptrend   - Gold candlestick = no established trend Inputs: Per = number of bars used for calculations FirstRatio = first Fibonacci ratio (Or use any ratio you want) SecondRatio = second Fibonacci ratio (Or use any ratio you want) !! IF YOU PURCHASE THE INDICATOR, CONTACT ME FOR
47 USD
Weis Waves
Flavio Jarabeck
3.3 (23)
The original author is David Weis, an expert in the Wyckoff Method. The Weis Wave is a modern adaptation of the 1930's Wyckoff Method, another expert in Tape Reading techniques and Chart Analysis. Weis Waves takes market volume and stacks it into waves according to price conditions giving the trader valuable insights about the market conditions. If you want to learn more about this subject you can find tons of videos in YouTube. Just look for "The Wickoff Method", "Weis Wave" and "Volume Spread
FREE
Volumes Direction MT5
William Oswaldo Mayorga Urduy
VOLUMES DIRECTION MT5 Normally the volume indicator has a default color change when the current volume is higher than the previous one, it is important but not very useful. For this reason, this indicator was created that in addition to the normal volume, when the candle is bullish or bearish, it paints them a different color, by default is blue for bullish and red for bearish, but these colors can be customized to the Trader's taste . Don't forget to check out my other indicators tha
38 USD
Weis Wave Result MT5
Sant Clear Ali Costa
Features 3 types of waves: bullish, bearish and unknown. The unknown tower comes when prices move in opposite the direction of the current tower. Label that shows the percentage remaining for the next tower. Allows you set the type of volume that will be accumulated in the towers, either real or tick volumes. Thus, the indicator works in any market, for example: stocks, futures, forex, commodities, etc. Allows you to set the required score for the tower exchange. Allows you to set the font size
60 USD
Developed by Smart Trader - Smart Reversion Pattern is an indicator capable of identifying reversal patterns , both bullish reversals and bearish reversals. It is designed to provide fast, real-time awareness of patterns. We also thought about the interface part, creating a clean and pleasant look to identify formation patterns on the chart. Note: If any pattern you need is not listed, just contact us and request inclusion - we usually respond within a few hours. Bearish Reversal P
30 USD
No Demand No Supply MT5
Trade The Volume Waves Single Member P.C.
No Demand No Supply   This indicator identifies   No Demand –No Supply candles  to your chart and plots volume bars colored according to the signal. It can be applied to all timeframes or to a specific one only. It can also be used as regular volume indicator  with exceptional future of WEIGHTED VOLUME. Furthermore is has an alert notification, sound and email when a signals occurs. The indicator does not repaint but the alert will come on two candles back due to the definition of No Demand No S
80 USD
The Metatrader 5 has a hidden jewel called Chart Object, mostly unknown to the common users and hidden in a sub-menu within the platform. Called Mini Chart, this object is a miniature instance of a big/normal chart that could be added/attached to any normal chart, this way the Mini Chart will be bound to the main Chart in a very minimalist way saving a precious amount of real state on your screen. If you don't know the Mini Chart, give it a try - see the video and screenshots below. This is a gr
30 USD
Segmented Volume MT5
Eduardo Da Costa Custodio Santos
The Segmented Volume MT5 indicator was created to facilitate those who trade using price and volume analysis, VSA, VPA, Wyckoff Method and Smart Money System . Segmented volume works on any Market ( Crypto, CFD, Forex, Futures, Stocks... ) and works on any Chart time. See how easy your interpretation is: #Green: Volume much higher than the market average #Dark pink: Larger than average volume #Blue: Positive normal volume #Red: Negative normal volume #Pink: Low volume #Yellow: Ultra Low Volume T
30 USD
MT5 indicators. Three levels of Fibonacci support and resistance levels are automatically drawn. They are: Month Level: Medium Orchid Weekly level: Orange Red Dayline level: Turquoise Color can be adjusted by parameters. This indicator is mainly used to analyze future support and resistance levels for better trade analysis. If the support level is effectively supported for many times, the market will break through the previous high point, and the effective trend breakout will be lon
40 USD
Renko Plus
Eadvisors Software Inc.
With Renko Plus you can use the features in the Indicator functionality, just add it to the Metatrader5 chart.             The Renko chart is a type of chart, developed by the Japanese, that is constructed using price movement rather than standardized prices and time intervals like most charts. It is believed to be named after the Japanese word for bricks, "renga", as the graphic looks like a series of bricks.             A new brick is created when the price moves a specified p
70 USD
True Weis Wave
Atila Goncalves Firmino
A version based on David Waves' description in his book 'Trade About to Happen' of his adaptation of the Wyckoff wave chart. The indicator directionally accumulates volume, adding to each brick or candle close, with color indication for up and down. it can be used it with tick or real volume, it also changes color when the accumulated value of the previous wave is exceeded, being the trade signal. Yellow color is used for doji candlestick, it will continue with accumulation without zero the sum
100 USD
Mini Panel Daytrade
PATRICK ANTONIO MORELO A.
Simple panel with Stop Loss (Loss), Stop Gain (Gain), Trailing Stop (TS) and Breakeven (BE-P). The End Chart button scrolls the chart to the last bar. The Opn/Cls button opens and closes the panel. The profit/loss value of the day's trades is shown in the yellow band next to the End Chart button. The Lot is the number of contracts to be traded. Gain is the number, in points, where the stop gain will be positioned. If you don't want to put a stop gain, just put 0 (zero) in its place and when you
30 USD
Do you use volume in your reading of the market? Certainly many traders use it, and do not imagine operating without it. The Color Histogram Volume Set indicator allows the user to choose the value that he considers interesting to monitor. When you pass this you will have visual confirmation and if you want you will also have the audible alert that is given by the indicator. Of course, there are other ways to try to find a high volume, such as assessing whether the volume
30 USD
BoxChart MT5
Evgeny Shevtsov
5 (6)
The market is unfair if only because 10% of participants manage 90% of funds. An ordinary trader has slim changes to stand against these "vultures". This problem can be solved. You just need to be among these 10%, learn to predict their intentions and move with them. Volume is the only preemptive factor that faultlessly works on any timeframe and symbol. First, the volume appears and is accumulated, and only then the price moves. The price moves from one volume to another. Areas of volume accumu
33 USD
The idea of a Value Chart indicator was presented in the very good book I read back in 2020 , " Dynamic Trading Indicators: Winning with Value Charts and Price Action Profile ", from the authors Mark Helweg and David Stendahl. The idea is simple and the result is pure genius: Present candlestick Price analysis in a detrended way! HOW TO READ THIS INDICATOR Look for Overbought and Oversold levels. Of course, you will need to test the settings a lot to find the "correct" one for your approach.
FREE
Blahtech Supply Demand MT5
Blahtech Limited
4.45 (11)
Supply Demand uses previous price action to identify potential imbalances between buyers and sellers. The key is to identify the better odds zones, not just the untouched ones. Blahtech Supply Demand indicator delivers functionality previously unavailable on any trading platform. This 4-in-1 indicator not only highlights the higher probability zones using a multi-criteria strength engine, but also combines it with multi-timeframe trend analysis, previously confirmed swings and engulfing detecto
99 USD
This is Gekko's Cutomized Cutomized Average Directional Index (ADX), a customized version of the famous ADX indicator. Use the regular ADX and take advantage two entry signals calculations and different ways of being alerted whenever there is potential entry or exit point. Inputs Period: Period for the ADX calculation; PlotSignalType: How will the indicator calculate entry (swing) signals: 1- ShowSwingsOnTrendLevel : Show Signals for Trend Confirmation Swings; 2- ShowSwingsOnTrendLevelDirectio
50 USD
This indicator allows you to enjoy the two most popular products for analyzing request volumes and market deals at a favorable price: Actual Depth of Market Chart Actual Tick Footprint Volume Chart This product combines the power of both indicators and is provided as a single file. The functionality of Actual COMBO Depth of Market AND Tick Volume Chart is fully identical to the original indicators. You will enjoy the power of these two products combined into the single super-indicator! Below is
40 USD
Volume by Price MT5
Brian Collard
5 (2)
The Volume by Price Indicator for MetaTrader 5 features Volume Profile and Market Profile TPO (Time Price Opportunity). Get valuable insights out of currencies, equities and commodities data. Gain an edge trading financial markets. Volume and TPO histogram bar, line and metric charts. TPO letter and block marker charts including split structures. Positioning and styling options to suit the user's needs and context. Volume Profile and Market Profile TPO Point of Control (VPOC and TPOC), Imbalanc
179.95 USD
This indicator will show you the TP and SL Values (in that currency) that you already set  for every orders on the charts  ( closed to the transaction/order line)  that will help you a lot to estimated your profit and loss for every order.    And it also show you the PIPs values too.  the shown format  is      " Currency Values of our Profit or Loss /  PIPs values ".    The TP Value will be shown in Green Color and  the SL Value  will be shown in Red Color.  For any question or more information,
99 USD
Delta Aggression Volume PRO is an indicator developed to monitor the strength and continuity of the aggression volume of sell and buy negotiations. Note: This indicator DOES NOT WORK for Brokers and/or Markets WITHOUT the type of aggression (BUY or SELL). Cryptocurrencies and Forex do not provide this type of data, that is, it does not work with them. O Delta Agrression Volume PRO has features that allow you to view beyond the delta volume of the day. Operation Multi symbols  (those who pro
77 USD
Cumulative delta indicator As most traders believe, the price moves under the pressure of market buying or selling. When someone redeems an offer standing in the cup, the deal is a "buy". If someone pours into the bid standing in the cup - the deal goes with the direction of "sale". The delta is the difference between purchases and sales. A cumulative delta - the difference between the cumulative sum of purchases and sales for a certain period of time. It allows you to see who is currently contr
50 USD
Follow The Line MT5
Oliver Gideon Amofa Appiah
4.26 (23)
This indicator obeys the popular maxim that: "THE TREND IS YOUR FRIEND" It paints a GREEN line for BUY and also paints a RED line for SELL. (you can change the colors). It gives alarms and alerts of all kinds. IT DOES NOT REPAINT and can be used for all currency pairs and timeframes. Yes, as easy and simple as that. Even a newbie can use it to make great and reliable trades. NB: For best results, get my other premium indicators for more powerful and reliable signals. Get them here: https://www.m
FREE
The indicator builds current quotes, which can be compared with historical ones and on this basis make a price movement forecast. The indicator has a text field for quick navigation to the desired date. Options: Symbol - selection of the symbol that the indicator will display; SymbolPeriod - selection of the period from which the indicator will take data; IndicatorColor - indicator color; Inverse - true reverses quotes, false - original view; Next are the settings of the te
55 USD
WAPV Weis Wave Chart Forex
Eduardo Da Costa Custodio Santos
The Weis Wave Chart Forex for MT5 is a Price and Volume indicator. The Price and Volume reading was widely disseminated through Richard Demille Wyckoff based on the three laws created by him: Supply and Demand, Cause and Effect and Effort vs. Result. In 1900 R.Wyckoff already used the wave chart in his analyses. Many years later, around 1990, David Weis Automated R. Wyckoff's wave chart and today we bring you the evolution of David Weis' wave chart. It shows the amount of Volume and the amount o
100 USD
An indicator of pattern #31 ("Long Island") from Encyclopedia of Chart Patterns by Thomas N. Bulkowski. The second gap is in the opposite direction. Parameters: Alerts - show alert when an arrow appears   Push - send a push notification when an arrow appears (requires configuration in the terminal) GapSize - minimum gap size in points ArrowType - a symbol from 1 to 17 ArrowVShift - vertical shift of arrows in points   ShowLevels - show levels ColUp - color of an upward line ColDn - color of a
30 USD
VolumeDeltaBars
Stanislav Korotky
This indicator is a conventional analytical tool for tick volumes changes. It calculates tick volumes for buys and sells separately, and their delta on every bar, and displays volumes by price clusters (cells) within a specified bar (usually the latest one). The algorithm used internally is the same as in the indicator VolumeDeltaMT5 , but results are shown as cumulative volume delta bars (candlesticks). Analogous indicator for MetaTrader 4 exists - CumulativeDeltaBars . This is a limited substi
30 USD
Market Profile 3 ForexArby com
Hussien Abdeltwab Hussien Ryad
3.8 (5)
Market Profile 3 MetaTrader 5 indicator  version 4.70— is a classic Market Profile implementation that can show the price density over time, outlining the most important price levels, value area, and control value of a given trading session. This indicator can be attached to timeframes between M1 and D1 and will show the Market Profile for daily, weekly, monthly, or even intraday sessions. Lower timeframes offer higher precision. Higher timeframes are recommended for better visibility. It is als
FREE
Buyers of this product also purchase
Top indicator for MT5   providing accurate signals to enter a trade without repainting! It can be applied to any financial assets: forex, cryptocurrencies, metals, stocks, indices .  MT4 version is here It will provide pretty accurate trading signals and tell you when it's best to open a trade and close it. Watch  the video  (6:22) with an example of processing only one signal that paid off the indicator! Most traders improve their trading results during the first trading week with the help of
125 USD
Gold Stuff mt5
Vasiliy Strukov
4.97 (110)
Gold Stuff mt5 is a trend indicator designed specifically for gold and can also be used on any financial instrument. The indicator does not redraw and does not lag. Recommended time frame H1. Contact me immediately after the purchase to get   personal bonus! Settings  and manual   here   SETTINGS Draw Arrow - on off. drawing arrows on the chart. Alerts -   on off audible alerts. E-mail notification - on off. email notifications. Puch-notification - on off. Push notifications. Next, adjust the co
50 USD
Trend Screener Pro MT5
STE S.S.COMPANY
4.87 (38)
Trend Indicator, Breakthrough  unique Solution For Trend Trading And Filtering With All Important trend Features Built Inside One Tool!   It's 100% non-repainting multi-timeframe and Multi-currencies indicator that can be used on all symbols/instruments: forex, commodities, cryptocurrencies, indices and stocks. LIMITED TIME OFFER : Trend Screener Indicator is available for only 50 $ and lifetime. ( Original price 125$ )  (offer extended) Trend Screener is an efficient indicator trend following
50 USD
ICT, SMC, SMART MONEY CONCEPTS, SMART MONEY, Smart Money Concept, Support and Resistance, Trend Analysis, Price Action, Market Structure, Order Blocks, BOS/CHoCH,   Breaker Blocks ,  Momentum Shift,   Supply&Demand Zone/Order Blocks , Strong Imbalance,   HH/LL/HL/LH,    Fair Value Gap, FVG,  Premium  &   Discount   Zones, Fibonacci Retracement, OTE, Buy Side Liquidity, Sell Side Liquidity, BSL/SSL Taken, Equal Highs & Lows, MTF Dashboard, Multiple Time Frame, BigBar, HTF OB, HTF Market Structur
65 USD
Matrix Arrow Indicator MT5
Juvenille Emperor Limited
5 (11)
Matrix Arrow Indicator MT5  is a unique 10 in 1 trend following   100% non-repainting  multi-timeframe indicator that can be used on all symbols/instruments:   forex,   commodities,   cryptocurrencies,   indices,   stocks .  Matrix Arrow Indicator MT5  will determine the current trend at its early stages, gathering information and data from up to 10 standard indicators, which are: Average Directional Movement Index (ADX) Commodity Channel Index (CCI) Classic Heiken Ashi candles Moving Aver
75 USD
This is arguably the most complete harmonic price formation auto-recognition indicator you can find for the MetaTrader Platform. It detects 19 different patterns, takes fibonacci projections as seriously as you do, displays the Potential Reversal Zone (PRZ) and finds suitable stop-loss and take-profit levels. [ Installation Guide | Update Guide | Troubleshooting | FAQ | All Products ] It detects 19 different harmonic price formations It plots primary, derived and complementary Fibonacci p
249 USD
AW Trend Predictor MT5
Alexander Nechaev
5 (34)
The combination of trend and breakdown levels in one system. An advanced indicator algorithm filters market noise, determines the trend, entry points, as well as possible exit levels. Indicator signals are recorded in a statistical module, which allows you to select the most suitable tools, showing the effectiveness of the signal history. The indicator calculates Take Profit and Stop Loss marks. Manual and instruction ->  HERE  / MT4 version ->  HERE How to trade with the indicator:  Trading wit
55 USD
Owl Smart Levels MT5
Sergey Ermolov
5 (7)
Indicator Guide   |   Owl Smart Levels Strategy   |   MT4 version  |  How to install?   |   FAQ The Owl Smart Levels Indicator is a complete trading system within the one indicator that includes such popular market analysis tools as Bill Williams' advanced fractals , Valable ZigZag which builds the correct wave structure of the market, and Fibonacci levels which mark the exact levels of entry into the market and places to take profits. For a detailed description of the trading system, see the a
97 USD
Advanced Supply Demand MT5
Bernhard Schweigert
4.42 (12)
Best Solution for any Newbie or Expert Trader! This indicator is a unique, high quality and affordable trading tool because we have incorporated a number of proprietary features and a new formula. With this update, you will be able to show double timeframe zones. You will not only be able to show a higher TF but to show both, the chart TF, PLUS the higher TF: SHOWING NESTED ZONES. All Supply Demand traders will love it. :) Important Information Revealed Maximize the potential of Advanced Suppl
199 USD
Auto Order Block with break of structure Detect Break of Structure , Mark Order Block and draw Entry / Stop and Risk to Reward lines when Order block is touch by price with Alert. Trend is Manually set to filter signals in a direction by a button on the chart. Entry / Stop and Risk to Reward lines can also be switch on / off by button on chart. Futures Auto Mark Break of Structure Auto Mark Order block Auto Mark higher time frame Point Of  Interest ( POI ) Popup Alert when BoS , Order block
55 USD
PZ Swing Trading MT5
PZ TRADING SLU
5 (4)
Swing Trading is the first indicator designed to detect swings in the direction of the trend and possible reversal swings. It uses the baseline swing trading approach, widely described in trading literature. The indicator studies several price and time vectors to track the aggregate trend direction and detects situations in which the market is oversold or overbought and ready to correct. [ Installation Guide | Update Guide | Troubleshooting | FAQ | All Products ] Profit for market swings with
175 USD
Profit from market structure changes as price reverses and pulls back. The market structure reversal alert indicator identifies when a trend or price move is approaching exhaustion and ready to reverse. It alerts you to changes in market structure which typically occur when a reversal or major pullback are about to happen. The indicator identifies breakouts and price momentum initially, every time a new high or low is formed near a possible exhaustion point. The indicator draws in a rectangle on
49 USD
MetaBands M5
Vahidreza Heidar Gholami
5 (2)
MetaBands uses powerful and unique algorithms to draw channels and detect trends so that it can provide traders with potential points for entering and exiting trades. It’s a channel indicator plus a powerful trend indicator. It includes different types of channels which can be merged to create new channels simply by using the input parameters. MetaBands uses all types of alerts to notify users about market events. Features Supports most of the channel algorithms Powerful trend detection algorith
129 USD
Trend Scanner mt5 GS
Vasiliy Strukov
5 (11)
Trend Scanner mt5 scans market trends from Multi-Symbols and Multi-Time frames and displays it on a movable panel on the chart. It uses  Gold stuff indicator   for analysis .The trader can select multiple pairs of his choice for display.   Trend Scanner is a great tool to see the direction of the trend and can be used for manual trading or EA trading by allowing only buy or sell orders according to the trend. Real-time results can be viewed  here . Contact me immediately after the purchase to g
50 USD
Trend Line Map Pro MT5
STE S.S.COMPANY
4.8 (5)
Trend Line Map indicator is an addons for   Trend Screener Indicator . It's working as a scanner for all signals generated by Trend screener ( Trend Line Signals ) . It's a Trend Line Scanner based on Trend Screener Indicator.  If you don't have Trend Screener Pro Indicator,   the Trend Line Map Pro will not work.     LIMITED TIME OFFER : Trend Line Map Indicator is available for only 50 $ and lifetime. ( Original price 125$ ) By accessing to our MQL5 Blog,  you can find all our premium indica
50 USD
Legacy of Gann for MT5
Pavel Zamoshnikov
5 (2)
The indicator very accurately determines the levels of the possible end of the trend and profit fixing. The method of determining levels is based on the ideas of W.D.Gann, using an algorithm developed by his follower Kirill Borovsky. Extremely high reliability of reaching levels (according to K. Borovsky  - 80-90%) Indispensable for any trading strategy – every trader needs to determine the exit point from the market! Precisely determines targets on any timeframes and any instruments (forex, met
65 USD
Stargogs Spike Catcher
Lorenzo Edward Beukes
5 (6)
Stargogs Spike Catcher V3.11 This Indicator is Developed To milk the BOOM and CRASH indices . Send me Message if you need any help with the indicator.  CHECK OUT THE STARGOGS SPIKE CATCHER EA/ROBOT V3: CLICK HERE ALSO CHECK OUT SECOND TO NONEFX SPIKE CATCHER:   CLICK HERE STARGOGS SPIKE CATCHER V3.11 WHATS NEW! Brand New Strategy. This is the Indicator you need for 2023. The Indicator Gives you an Entry at a time when conditions are met and you should use TP & SL. New Trendline that changes col
100 USD
TPA True Price Action indicator reveals the true price action of the market makers through 100% non-repainting signals strictly at the close of a candle! TPA shows entries and re-entries, every time the bulls are definitely stronger than the bears and vice versa. Not to confuse with red/green candles. The shift of power gets confirmed at the earliest stage and is ONE exit strategy of several. There are available now two free parts of the TPA User Guide for our customers. The first "The Basics"
168 USD
Blahtech VWAP - Volume Weighted Average Price (VWAP) is the ratio of price to total volume. It provides an average price over a specified time interval.  Links [  Install  |  Update  |  Documentation   ] Feature Highlights Configurable VWAP Line Sessions, intervals, anchored or continuous Previous day settlement line Standard Deviation bands Alerts at bar close or real time Automatic Broker or Tick volumes Significantly reduced CPU usage Input Parameters Expert Advisor Mode  - Reserved for
49 USD
Market Profile defines a number of day types that can help the trader to determine market behaviour. A key feature is the Value Area, representing the range of price action where 70% of trading took place. Understanding the Value Area can give traders valuable insight into market direction and establish the higher odds trade. It is an excellent addition to any system you may be using. Blahtech Limited presents their Market Profile indicator for the MetaTrader community. Inspired by Jim Dalton’s
99 USD
Support And Resistance Screener Breakthrough unique Solution With All Important levels analyzer and Markets Structures Feature Built Inside One Tool ! Our indicator has been developed by traders for traders and with one Indicator you will find all Imporant market levels with one click. LIMITED TIME OFFER : Support and Resistance Screener Indicator is available for only 50 $ and lifetime. ( Original price 125$ ) (offer extended) The available tools ( Features ) in our Indicator are :  1. HH-LL
50 USD
Strong Support mt5
Vasiliy Strukov
5 (7)
Support and resistance levels have long been a powerful tool for market analysis. The Strong Support indicator plots support levels based on local price minima, and resistance levels based on local price maxima. My other developments can be viewed   here It is recommended to use together with a trend indicator, for example, Gold Stuff - this will allow you to trade according to the trend and simultaneously determine the zones of consolidation or trend reversal, as well as set stop loss and
50 USD
Royal Wave Pro M5
Vahidreza Heidar Gholami
3.67 (3)
Royal Wave is a Trend-Power oscillator which has been programmed to locate and signal low-risk entry and exit zones. Its core algorithm statistically analyzes the market and generates trading signals for overbought, oversold and low volatile areas. By using a well-designed alerting system, this indicator makes it easier to make proper decisions regarding where to enter and where to exit trades. Features Trend-Power Algorithm Low risk Entry Zones and Exit Zones Predictions for Overbought and Over
129 USD
The RSI / TDI alert dashboard allows you to monitor RSIs at once (selectable by you) on every major pair you trade. You can use it in two ways: 1.   Select multiple time frames and the dash will show you when there are multiple time frames extended beyond normal trading conditions. A great indicator that price has pushed hard recently as it has achieved an overbought or oversold level across multiple time frames so a pullback or reversal is due soon. 2.   Use one time frame (your favourite to tr
49 USD
Automatically draw support and resistance levels   PLUS   propulsion candle gaps on your chart, so you can see where price is likely to head next and/or potentially reverse. This indicator is designed to be used as part of the position trading methodology taught on my website (The Market Structure Trader) and displays key information for targeting and potential entries. MT4 Version:  https://www.mql5.com/en/market/product/97246/ There are 2 CORE features in the indicator and 4 additional ones:
49 USD
Italo Volume Indicator MT5
Italo Santana Gomes
4.69 (13)
BUY INDICATOR AND GET EA FOR FREE AS A BONUS + SOME OTHER GIFTS! ITALO VOLUME INDICATOR  is the best volume indicator ever created, and why is that? The Indicator works on all time-frames and assets, indicator built after 6 years of experience on forex and many other markets. You know many volume indicators around the internet are not complete, does not help, and it's difficult to trade, but the Italo Volume Indicator is different , the Italo Volume Indicator shows the wave volume, when market
65 USD
AW Breakout Catcher MT5
Alexander Nechaev
5 (7)
Breakdowns of price levels, advanced statistics, TakeProfit calculation and 3 types of notifications. Benefits:  Do not redraw your results Signal strictly at the close of the candle False Breakdown Filtering Algorithm It goes well with any trending strategy. Works on all tools and timeseries Manual and instruction ->  HERE  / Problem solving ->  HERE  / MT4 version ->  HERE How to trade with the indicator  Trading with AW Breakout Catcher in just three easy steps: Step 1 - Opening a position A
55 USD
The ADR Alert Dashboard shows you at a glance where price is currently trading in relation to it's normal average daily range. You will get instant alerts via pop-up, email or push when price exceeds it's average range and levels above it of your choosing so you can jump into pullbacks and reversals quickly. The dash is designed to be placed on a blank chart and just sit in the background and alert you when levels are hit so you do not need to sit and watch it or even look at all! MT4 VERSION AV
49 USD
Traders know that paying attention to volume can make the crucial difference in understanding how the market will move. Information such as the traded volume, frequency of executed trades and the correlation of buyers and sellers at a certain time period expand our understanding of volume and can significantly improve the accuracy of our trading forecast. The Volume at Price (or VAP) indicator displays the cumulative traded volume for each price level during a time period, as well as the corr
180 USD
ACB Breakout Arrows MT5
KEENBASE SOFTWARE SOLUTIONS
5 (1)
The ACB Breakout Arrows indicator provides a crucial entry signal in the market by detecting a special breakout pattern. The indicator constantly scans the chart for a settling momentum in one direction and provide the accurate entry signal right before the major move. Get multi-symbol and multi-timeframe scanner from here - Scanner for ACB Breakout Arrows MT 5 Key features Stoploss   and Take Profit levels are provided by the indicator. Comes with a MTF Scanner dashboard which tracks the br
145 USD
More from author
WAPV Full MT5
Eduardo Da Costa Custodio Santos
## If you are unable to use the demo version, please contact us by message. ## Operate professionally using WAPV Full and be able to track where is the big players money Imagine you have in your hands a tool that alone does the reading of the major Market Players, showing the best trading regions based on Price and Volume analysis. WAPV Full is a complete tool, 100% focused on R. Wyckoff's operational In addition to mapping market movements in trading waves, it also maps the Market by reading P
199 USD
Force and Weakness Trading
Eduardo Da Costa Custodio Santos
The Force and Weakness Indicator for MT5 Forex is part of the (Wyckoff Academy Price and Volume) Toolkit The Force and Weakness Indicator for MT5 Forex was developed to identify the Strength and Weakness of volume in an accumulated way. Enabling the vision of a panorama between price and volume. The Indicator can be used as an oscillator and as a histogram. As usual it has all the premises of R. Wyckoff's three laws when put together with the price: Cause and Effect, Effort x Result and Supply a
40 USD
HLC bar MT5 Wyckoff
Eduardo Da Costa Custodio Santos
The indicator "HLC_bar_MT5 Wyckoff" for MT5 has been created to facilitate analysis at trade time. The HLC Bar was used by Richard Wyckoff and is currently widely used in "VSA" operations. Wyckoff found that using High, Low, and Close made the graph much cleaner and easier to analyze. The Indicator "HLC_bar_MT5 Wyckoff" allows: # Change the bar width; # Leave the bar the same color; # And highlight the bar that opened and closed at the same price. Colors and width is easily modified in settings
30 USD
WA Order Block FVG bos MT5
Eduardo Da Costa Custodio Santos
O  WA Order Block FVG bos MT5  é um indicador com base no estudo de SMC (Smart Money Concepts) criado pelo ICT Inner Circle Trader, eleplota no seu gráfico as informações de Order Blocks em 3 tempos gráficos diferentes, fair Value Gaps e Regiões de Liquidez além do BOS ( Break os Structures), tudo em um só indicador. Dessa forma você não precisa colocar essas informações de forma manual. Agora você tem tudo isso de forma automática em seu gráfico.
55 USD
Weis Wave Double Side
Eduardo Da Costa Custodio Santos
The Weis Wave Bouble Side Indicator for MT5 is part of the toolkit (Wyckoff Academy Wave Market) The Weis Wave Bouble side Indicator for MT5 was created based on the already established Weis Wave created by David Weis. The Weis Wave Double Side indicator reads the market in waves as it was done by R. Wyckoff in 1900. It helps in the identification of effort x result, cause and effect, and Supply and demand Its differential is that it can be used below the zero axis, further improving plus operat
30 USD
Segmented Volume MT5
Eduardo Da Costa Custodio Santos
The Segmented Volume MT5 indicator was created to facilitate those who trade using price and volume analysis, VSA, VPA, Wyckoff Method and Smart Money System . Segmented volume works on any Market ( Crypto, CFD, Forex, Futures, Stocks... ) and works on any Chart time. See how easy your interpretation is: #Green: Volume much higher than the market average #Dark pink: Larger than average volume #Blue: Positive normal volume #Red: Negative normal volume #Pink: Low volume #Yellow: Ultra Low Volume T
30 USD
Volume Zone Fractal
Eduardo Da Costa Custodio Santos
VZO Plus is an indicator that shows overbought and oversold regions based on traded volume. #When the indicator line is between -40 and -60 it is oversold #When the indicator line is between 40 and 60 it is overbought. Outside these regions, the market is following its natural path by inertia. Above the green line, it means that the market is positive, Another way to analyze the indicator is through divergence regions. When we have the bottom higher than the other in a downtrend or One botto
30 USD
VSA Smart Money
Eduardo Da Costa Custodio Santos
The VSA Smart Money indicator tracks the movement of professional traders, institutional trades and all compound man movements. The VSA Smart money Indicator reads bar by bar, being an excellent tool for those who use VSA, Wyckoff, PVA and Any other analysis that uses price and volume. There are 10 indications that you will find in your Chart: *On Demand *Climax *UT Thrust *Top Reversal bar *Stop Volume *No Supply *Spring *Reversal Bottom *Shakeout *Bag Holding Using this indicator you will be o
30 USD
Jac Trend
Eduardo Da Costa Custodio Santos
The JAC Trend Indicator for MT5 was created to facilitate the identification of the market trend in an easy and agile way. # When JAC Trend indicator is green , we have a pre-trend to uptrend market. # When JAC Trend indicator is Red we have a pre-trend to downtrend market. # When JAC Trend indicator is gray , we have a sideways market without strength. That way you have all the sides that the Market can go to in a clear and objective way.
30 USD
Z Score Plus MT5
Eduardo Da Costa Custodio Santos
In finance, Z Scores are measures of the variability of an observation and can be used by traders to help determine market volatility. Z scores tell Traders whether a score is typical for a specified dataset or is atypical. Z scores also enable analysts to adapt scores from multiple datasets to make scores that can be more accurately compared to each other. # In practice, we have the ZScore with zero point and oscillations between 2 and 3 for ultra high high points and oscillations between -2 an
30 USD
Trend Everest
Eduardo Da Costa Custodio Santos
Trend Everest MT5 indicator is a trend following indicator that aids in decision making. It is based on the calculation of ATR that assist and the average hull. A key issue is that the Trend Everest MT5 nominee does not repaint, so you can backtest with greater confidence. When it is Green, UpTrend When it is a Red downtrend. Not that the Market is fractal, so the longer the graphic time, the greater its degree of assertiveness.
30 USD
JAC Trend Color Candle
Eduardo Da Costa Custodio Santos
The indicator "JAC Trend Color Candle" for Meta Trader 5, was created to visually facilitate the trend for the trader. It is based on three parameters, which identifies the uptrend, downtrend and non-trending market. The colors are trader-configurable, and the average trader-configurable as well. trend parameters cannot be configured as they are the indicator's differential.
30 USD
WAPV adh Supply and Demand
Eduardo Da Costa Custodio Santos
The WAPV ADH Supply and Demand indicator is part of a set of indicators called (Wyckoff Academy Wave Market) The WAPV ADH Supply and Demand indicator for MT5 is intended to identify the winning side between buyers and sellers. Its reading is very simple, when the green line is above the red line the demand is in charge, when the red line is above the green line the supply is in charge. The more positive the green and red lines, the greater the volume input, the closer to zero or negative,
40 USD
WAPV adh Supply and Demand Forex
Eduardo Da Costa Custodio Santos
The WAPV ADH Supply and Demand Forex Indicator is part of a set of Indicators called (Wyckoff Academy Wave Market) The WAPV ADH Forex Supply and Demand Indicator for MT5 is intended to identify the winning side between buyers and sellers. Its reading is very simple, when the green line is above the red line demand is in command, when the red line is above the green line supply is in command. The more positive the green and red lines, the higher the volume input, the closer to zero or negative, t
40 USD
WAPV Box Effort x Result
Eduardo Da Costa Custodio Santos
WA_PV_BOX_EFFORT X RESULT for MT5 The WAPV Box Effort x Result Indicator is part of the Package Indicators group (Wyckoff Academy Wave Market). The WAPV Box Effort x Result Indicator for MT5 helps you in reading price and volume. Its reading consists of assisting in the identification of effort x result in waves created by the graph. The WAPV Box Effort x Result Indicator for MT5 when the box is green means that the volume is in favor of the demand and when the box is red volume is in favor of s
40 USD
Weis Wave Double Side Alert
Eduardo Da Costa Custodio Santos
The Weis Wave Bouble Side Indicator for MT5 is part of the toolkit (Wyckoff Academy Wave Market) The Weis Wave Bouble side Indicator for MT5 was created based on the already established Weis Wave created by David Weis. The Weis Wave Double Side indicator reads the market in waves as R. Wyckoff did in 1900. It helps in the identification of effort x result, cause and effect, and Supply and demand Its differential is that it can be used below the zero axis and has a breakout alert showing Who is s
60 USD
VSA Candle Signal
Eduardo Da Costa Custodio Santos
The VSA Candle Signal for MT5 is part of the toolset (Wyckoff Academy Price and Volume). Its function is to identify the correlation of Price and Volume in the formation of the candle. Its creation is based on the premises of R.Wyckoff , a precursor in the analysis of Price and Volume. VSA Candle Signal for MT5 assists in decision making, leaving your reading clearer and more fluid. See the images below.
40 USD
WAPV Force and Weakness MT5
Eduardo Da Costa Custodio Santos
The Force and Weakness Indicator for MT5 Real Volume is part of the (Wyckoff Academy Price and Volume) toolset The Force and Weakness Indicator for MT5 Real Volume was developed to identify the Strength and Weakness of volume in an accumulated way. Enabling the vision of a panorama between price and volume. The Indicator can be used as an oscillator and as a histogram. As a fantasy it has all the premises of R. Wyckoff's three laws when put together with the price: Cause and Effect, Effort x Res
40 USD
WAPV Weis Wave Chart Forex
Eduardo Da Costa Custodio Santos
The Weis Wave Chart Forex for MT5 is a Price and Volume indicator. The Price and Volume reading was widely disseminated through Richard Demille Wyckoff based on the three laws created by him: Supply and Demand, Cause and Effect and Effort vs. Result. In 1900 R.Wyckoff already used the wave chart in his analyses. Many years later, around 1990, David Weis Automated R. Wyckoff's wave chart and today we bring you the evolution of David Weis' wave chart. It shows the amount of Volume and the amount o
100 USD
WAPV Weis Wave Chart MT5
Eduardo Da Costa Custodio Santos
The Weis Wave Chart for MT5 is a Price and Volume indicator. The Price and Volume reading was widely disseminated through Richard Demille Wyckoff based on the three laws created by him: Supply and Demand, Cause and Effect and Effort vs. Result. In 1900 R.Wyckoff already used the wave chart in his analyses. Many years later, around 1990, David Weis Automated R. Wyckoff's wave chart and today we bring you the evolution of David Weis' wave chart. It shows the amount of Volume and the amount of pips
100 USD
Filter:
No reviews
Reply to review