• Overview
  • Reviews (3)
  • Comments

Cybertrade Keltner Channels

4.67
Cybertrade Keltner Channels - MT5
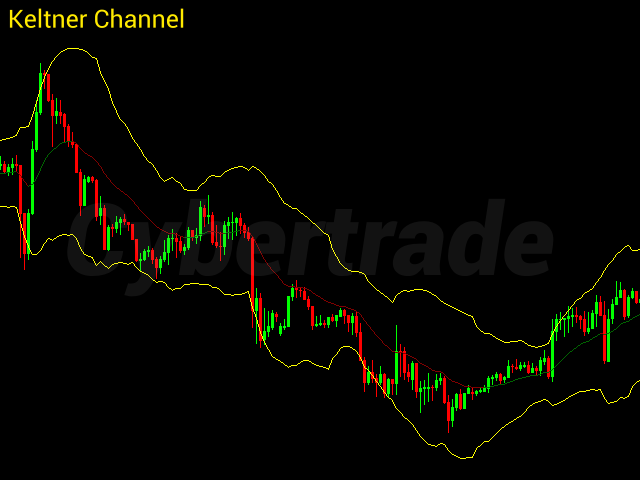
Created by Chester Keltner, this is a volatility indicator used by technical analysis.
It is possible to follow the trend of financial asset prices and generate support and resistance patterns. In addition, envelopes are a way of tracking volatility in order to identify opportunities to buy and sell these assets.

It works on periods longer than the period visible on the chart.
All values ​​are available in the form of buffers to simplify possible automations.
This indicator is the same one we use in our EA.
Also check out our other products.
Reviews 3
HOGJoerch63
224
HOGJoerch63 2023.02.03 07:52 
 

Very usefull. I like it. Thanks

ONK3R D:
46
ONK3R D: 2022.09.26 12:42 
 

Love it, helps with low volume trade

Matias Bossio
66
Matias Bossio 2022.07.22 06:08 
 

no he tenido aún la posibilidad de probarlo en profundidad pero parece que se desempeña bien

Recommended products
Free automatic Fibonacci is an indicator that automatically plots a Fibonacci retracement based on the number of bars you select on the BarsToScan setting in the indicator. The Fibonacci is automatically updated in real time as new highest and lowest values appears amongst the selected bars. You can select which level values to be displayed in the indicator settings. You can also select the color of the levels thus enabling the trader to be able to attach the indicator several times with differe
FREE
Santa Donchian
Marco Aurelio Cestari
4.2 (5)
Santa Donchian Indicator  is an efficient way to detect support, resistence and break outs in any market. The Donchian channel measures the high and the low of a previously defined range.  Typically, a trader would look for a well-defined range and then wait for the price to break out to either one side for a trade entry trigger. Advantages Never repaints, never backpaints, never recalculates. Works in all symbols and all timeframes. Perfect trend filter for any strategy or expert advisor. Fu
FREE
Value Chart Candlesticks
Flavio Javier Jarabeck
4.8 (5)
The idea of a Value Chart indicator was presented in the very good book I read back in 2020 , " Dynamic Trading Indicators: Winning with Value Charts and Price Action Profile ", from the authors Mark Helweg and David Stendahl. The idea is simple and the result is pure genius: Present candlestick Price analysis in a detrended way! HOW TO READ THIS INDICATOR Look for Overbought and Oversold levels. Of course, you will need to test the settings a lot to find the "correct" one for your approach.
FREE
Donchian Pro
Paulo Henrique Faquineli Garcia
5 (1)
The Donchian Channel Channels are among the most popular tools of technical analysis, as they visually convey to the analyst the limits within which most price movement tends to occur. Channel users know that valuable information can be obtained at any time, whether prices are in the central region of a band or close to one of the border lines. One of the best known techniques to explore these concepts is Bollinger Bands. However, John Bollinger was not the only one to research the applicatio
FREE
Pivot Point Fibo RSJ is an indicator that traces the support and resistance lines of the day using Fibonacci rates. This spectacular indicator creates up to 7 levels of support and resistance through Pivot Point using Fibonacci rates. It is fantastic how the prices respect each level of this support and resistance, where it is possible to perceive possible entry/exit points of an operation. Features Up to 7 levels of support and 7 levels of resistance Set the colors of the levels individual
FREE
LT Donchian Channel
Thiago Duarte
5 (1)
Donchian Channel is an indicator created by Richard Donchian. It is formed by taking the highest high and the lowest low of the last specified period in candles. The area between high and low is the channel for the chosen period. Its configuration is simple. It is possible to have the average between the upper and lower lines, plus you have alerts when price hits one side. If you have any questions or find any bugs, please contact me. Enjoy! This is a free indicator, but it took hours to develo
FREE
Follow The Line MT5
Oliver Gideon Amofa Appiah
4.36 (28)
This indicator obeys the popular maxim that: "THE TREND IS YOUR FRIEND" It paints a GREEN line for BUY and also paints a RED line for SELL. (you can change the colors). It gives alarms and alerts of all kinds. IT DOES NOT REPAINT and can be used for all currency pairs and timeframes. Yes, as easy and simple as that. Even a newbie can use it to make great and reliable trades. NB: For best results, get my other premium indicators for more powerful and reliable signals. Get them here: https://www.m
FREE
PZ Penta O MT5
PZ TRADING SLU
3.8 (5)
The Penta-O is a 6-point retracement harmonacci pattern which usually precedes big market movements. Penta-O patterns can expand and repaint quite a bit. To make things easier this indicator implements a twist: it waits for a donchian breakout in the right direction before signaling the trade. The end result is an otherwise repainting indicator with a very reliable trading signal. The donchian breakout period is entered as an input. [ Installation Guide | Update Guide | Troubleshooting | FAQ | A
FREE
MIDAS Super VWAP
Flavio Javier Jarabeck
4.23 (13)
Imagine VWAP, MVWAP and MIDAS in one place... Well, you found it! Now you can track the movement of Big Players in various ways, as they in general pursue the benchmarks related to this measuring, gauging if they had good execution or poor execution on their orders. Traders and analysts use the VWAP to eliminate the noise that occurs throughout the day, so they can measure what prices buyers and sellers are really trading. VWAP gives traders insight into how a stock trades for that day and deter
FREE
Bar Color Trend
Germano Chagas
4.5 (10)
Combining the best of Price Action , Directional Movement , and Divergence/Convergence analysis, Candle Color Trend is a easy and reliable way to identify trend direction. The indicator automatically paints the candles according to the assumption that an uptrend is defined by prices that form a series of higher highs and higher lows. In contrast, a downtrend is defined by prices that form a series of lower highs and lower lows. Additionally, ADX Wilder indicator is used to measure trend weakness
FREE
Bounce Zone MT5
Nguyen Thanh Cong
4 (2)
Introduction The Bounce Zone indicator is a cutting-edge non-repainting technical tool built to identify key areas on the price chart where market sentiment is likely to cause a significant price reversal. Using advanced algorithms and historical price data analysis, this indicator pinpoints potential bounce zones. Combined with other entry signal, this indicator can help forex traders place the best trades possible Signal A possible buy signal is generated when price is in the green zo
FREE
Are you tired of drawing trendlines every time you're analyzing charts? Or perhaps you would like more consistency in your technical analysis. Then this is for you. This indicator will draw trend lines automatically when dropped on a chart. How it works Works similar to standard deviation channel found on mt4 and mt5. It has 2 parameters: 1. Starting Bar 2. Number of bars for calculation The   starting bar   is the bar which drawing of the trend lines will begin, while the   number of bars for c
FREE
Important Lines
Terence Gronowski
4.88 (25)
This indicator displays Pivot-Lines, preday high and low, preday close and the minimum and maximum of the previous hour. You just have to put this single indicator to the chart to have all these important lines, no need to setup many single indicators. Why certain lines are important Preday high and low : These are watched by traders who trade in a daily chart. Very often, if price climbs over or falls under a preday low/high there is an acceleration in buying/selling. It is a breakout out of
FREE
This is a buyer and seller aggression indicator that analyzes the shape of each candle and project this data in a histogram form. There are 4 histograms in one. On the front we have two: Upper - Buyer force. Lower - Seller force. At the background we also have two histogram, both with same color. They measure the combined strenght of buyers and sellers. This histograms can be turned off in Input Parameters. It is also possible to have the real or tick volume to help on this force measurement. IN
FREE
Spike Catch Pro
Amani Fungo
4.67 (3)
Spike Catch Pro 22:03 release updates Advanced engine for searching trade entries in all Boom and Crash pairs (300,500 and 1000) Programmed strategies improvements Mx_Spikes (to combine Mxd,Mxc and Mxe), Tx_Spikes,   RegularSpikes,   Litho_System,   Dx_System,   Md_System,   MaCross,   Omx_Entry(OP),  Atx1_Spikes(OP),   Oxc_Retracement (AT),M_PullBack(AT) we have added an arrow on strategy identification, this will help also in the visual manual backtesting of the included strategies and see h
FREE
Weis Waves
Flavio Javier Jarabeck
3.24 (25)
The original author is David Weis, an expert in the Wyckoff Method. The Weis Wave is a modern adaptation of the 1930's Wyckoff Method, another expert in Tape Reading techniques and Chart Analysis. Weis Waves takes market volume and stacks it into waves according to price conditions giving the trader valuable insights about the market conditions. If you want to learn more about this subject you can find tons of videos in YouTube. Just look for "The Wickoff Method", "Weis Wave" and "Volume Spread
FREE
Bollinger Bands B
Flavio Javier Jarabeck
5 (1)
John Bollinger created this indicator in 2010 as a way to read the original indicator (Bollinger Bands) in a more "technical" way, shown as an oscillator. The typical range of the Bollinger Bands %B is 0 - 0.5 - 1.0, where "0" represents the lower band, the "0.5" the middle band, and "1" the upper band. The line on the indicator represents the Closing prices. As simple as that. SETTINGS Bollinger Bands period of analysis Standard Deviation multiplier Shift Price type to be analyzed If you
FREE
Reversal Composite Candles
MetaQuotes Ltd.
3.33 (21)
The idea of the system is to indentify the reversal patterns using the calculation of the composite candle. The reversal patterns is similar to the "Hammer" and "Hanging Man" patterns in Japanese candlestick analysis. But it uses the composite candle instead the single candle and doesn't need the small body of the composite candle to confirm the reversal. Input parameters: Range - maximal number of bars, used in the calculation of the composite candle. Minimum - minimal size of the composite can
FREE
PZ Pivot Points MT5
PZ TRADING SLU
4.95 (21)
This indicator displays pivot points in the chart, including historical vales, and supports many calculation modes for Pivot Points and S/R levels. [ Installation Guide | Update Guide | Troubleshooting | FAQ | All Products ] It plots historical levels for backtesting purposes It allows you to select the reference timeframe It implements different Pivot Point calculation modes It implements different SR calculation modes It implements customizable colors and sizes Calculation Modes The indi
FREE
PZ Trendlines MT5
PZ TRADING SLU
4.8 (5)
Tired of plotting trendlines? The PZ TrendLines MT5 indicator applies a mechanical approach to the construction of trend lines for you!  [ Installation Guide | Update Guide | Troubleshooting | FAQ | All Products ] It can draw up to 18 trendlines Trendlines can be optionally based on fractals Each line represents a breakout level Each trendline can be broken or rejected Configurable amount of lines Configurable colors Support I am happy to provide free products but given my limited time, they com
FREE
Tabajara V5
Flavio Javier Jarabeck
4.88 (33)
Metatrader 5 version of the famous Andre Machado's Tabajara indicator. If you don't know Andre Machado's Technical Analysis work you don't need this indicator... For those who need it and for those several friend traders who asked this porting from other platforms, here it is... FEATURES 8-period Moving Average 20-period Moving Average 50-period Moving Average 200-period Moving Average Colored candles according to the inflexion of the 20-period MA SETTINGS You can change the Period of all M
FREE
Aggression Volume
Flavio Javier Jarabeck
3.79 (19)
Aggression Volume Indicator is the kind of indicator that is rarely found in the MQL5 community because it is not based on the standard Volume data provided by the Metatrader 5 platform. It requires the scrutiny of all traffic Ticks requested on the platform... That said, Aggression Volume indicator requests all Tick Data from your Broker and processes it to build a very special version of a Volume Indicator, where Buyers and Sellers aggressions are plotted in a form of Histogram. Additionally,
FREE
Functional in the Forex market. Functional in the B3 market - Bolsa Brasil Balcão. Motivation The technical Fibonacci retraction indicator for many is essential and the basis for all market movement forecasts. The name of the tool comes from the Italian mathematician Leonardo de Pisa (13th century). This DEMO version will work in Meta Trader with Demo and Strategy Tester. To purchase the Full version that works on a Real account, click on: https://www.mql5.com/en/market/product/38089
FREE
Indicator and Expert Adviser  EA Available in the comments section of this product. Download with Indicator must have indicator installed for EA to work. Mt5 indicator alerts for bollinger band and envelope extremes occurring at the same time. Buy signal alerts occur when A bullish candle has formed below both the lower bollinger band and the lower envelope  Bar must open and close below both these indicators. Sell signal occur when A bear bar is formed above the upper bollinger band and upp
FREE
WH Price Wave Pattern MT5
Wissam Hussein
3.83 (6)
Welcome to our Price Wave Pattern MT5 --(ABCD Pattern)-- The ABCD pattern is a powerful and widely used trading pattern in the world of technical analysis. It is a harmonic price pattern that traders use to identify potential buy and sell opportunities in the market. With the ABCD pattern, traders can anticipate potential price movements and make informed decisions on when to enter and exit trades. EA Version:    Price Wave EA MT5 MT4 Version : Price Wave Pattern MT4  Features :  Auto
FREE
Supports And Resistances Lines
Francisco Gomes Da Silva
4.83 (24)
Support and Resistance zones Indicator MT5 this indicator knows how to identify tops and bottoms automaticly. This support and resistance indicator creates support lines and resistance lines based on tops and bottoms. how to make support and resistance lines. this is an indicator to make automatic support and resistance lines. how to find support level with indicator. this indicator finds tops and bottoms automaticly. The Indicator automatically creates support lines every time “Fractals” create
FREE
Sweet VWAP MT5
Francisco Gomes Da Silva
4.11 (9)
Discover where big institutions are trading and optimize your investments with the Free Anchored VWAP Indicator Discover the price where big institutions are trading with our Free Anchored VWAP Indicator ! Now you can save your valuable time by automating the plotting of your anchored VWAPs at market tops and bottoms. Our free version allows you to easily view the VWAP in real time by following the movement of the mouse pointer on the chart. With this, you can instantly discover where the price
FREE
MACD 2Line MT5
ALFA S.R.L.
5 (3)
The MACD 2 Line Indicator is a powerful, upgraded version of the classic Moving Average Convergence Divergence (MACD) indicator, now available for the MetaTrader 5 platform. This tool is the embodiment of versatility and functionality, capable of delivering comprehensive market insights to both beginner and advanced traders. The MACD 2 Line Indicator for MQL5 offers a dynamic perspective of market momentum and direction, through clear, visually compelling charts and real-time analysis. How
FREE
Super Trend eu
Emin Ulucanli
5 (2)
SUPERTREND; It is a trend following indicator based on the SuperTrend ATR created by Olivier Seban. It can be used to detect changes in trend direction and locate stops. When the price falls below the indicator curve, it turns red and indicates a downtrend. Conversely, when the price moves above the curve, the indicator turns green, indicating an uptrend. Like other indicators, it works well on SuperTrend when used in conjunction with other indicators such as MACD, parabolik SAR, Bollinger Band
FREE
Time Spaced Moving Averages
Flavio Javier Jarabeck
4.8 (5)
The concept is simple: Plotting Price behavior within several periods of time. Some Symbols behave very well during the trading day - with this I mean Intraday trading - and this behavior ends up plotting effectively well with the proposed Exponential Moving Averages in this indicator... Obviously that this behavior could not be seen in all Symbols, but you can give it a try... Just drop this indicator in a chart and you will see for yourself... This indicator is intended for "Feeling the Trend
FREE
Buyers of this product also purchase
How many times have you bought a trading indicator with great back-tests, live account performance proof with fantastic numbers and stats all over the place but after using it, you end up blowing your account? You shouldn't trust a signal by itself, you need to know why it appeared in the first place, and that's what RelicusRoad Pro does best! NOW $50 (MT5 RELEASE DISCOUNT $699) -  UNLIMITED ACCOUNTS (10 PCs or MACs LICENSE) **  User Manual + Strategies + Training Videos + Private Group with V
50 USD
Gold Stuff mt5
Vasiliy Strukov
4.97 (124)
Gold Stuff mt5 is a trend indicator designed specifically for gold and can also be used on any financial instrument. The indicator does not redraw and does not lag. Recommended time frame H1. Contact me immediately after the purchase to get   personal bonus! Settings  and manual   here   SETTINGS Draw Arrow - on off. drawing arrows on the chart. Alerts -   on off audible alerts. E-mail notification - on off. email notifications. Puch-notification - on off. Push notifications. Next, adjust the co
50 USD
Top indicator for MT5   providing accurate signals to enter a trade without repainting! It can be applied to any financial assets: forex, cryptocurrencies, metals, stocks, indices .  MT4 version is here It will provide pretty accurate trading signals and tell you when it's best to open a trade and close it. Watch  the video  (6:22) with an example of processing only one signal that paid off the indicator! Most traders improve their trading results during the first trading week with the help of
125 USD
Owl Smart Levels MT5
Sergey Ermolov
4.39 (31)
MT4 version  |  How to install?   |   FAQ The Owl Smart Levels Indicator is a complete trading system within the one indicator that includes such popular market analysis tools as Bill Williams' advanced fractals , Valable ZigZag which builds the correct wave structure of the market, and Fibonacci levels which mark the exact levels of entry into the market and places to take profits. Detailed description of the strategy Instructions for working with the indicator Advisor-assistant in trading Owl
97 USD
Price action trading, Trend trading strategies, Trend following indicators, Trend detection, Range identification, Smart Trend Trading System Indicator, Comprehensive trading system, Multi-indicator approach, Trend following strategy, Range reversal strategy, Smart Trend Cloud, Smart Reversal Zones, Trend Breakout Catcher, Smart Trailing Stop, Multi-timeframe trend finder, Complete trading toolkit, Market trend analysis, Range-bound market signals, Confident trading decisions, Price movement in
100 USD
AW Trend Predictor MT5
Alexander Nechaev
4.8 (45)
The combination of trend and breakdown levels in one system. An advanced indicator algorithm filters market noise, determines the trend, entry points, as well as possible exit levels. Indicator signals are recorded in a statistical module, which allows you to select the most suitable tools, showing the effectiveness of the signal history. The indicator calculates Take Profit and Stop Loss marks. Manual and instruction ->  HERE  / MT4 version ->  HERE How to trade with the indicator:  Trading wit
55 USD
ICT, SMC, SMART MONEY CONCEPTS, SMART MONEY, Smart Money Concept, Support and Resistance, Trend Analysis, Price Action, Market Structure, Order Blocks, BOS/CHoCH,   Breaker Blocks ,  Momentum Shift,   Supply&Demand Zone/Order Blocks , Strong Imbalance,   HH/LL/HL/LH,    Fair Value Gap, FVG,  Premium  &   Discount   Zones, Fibonacci Retracement, OTE, Buy Side Liquidity, Sell Side Liquidity, BSL/SSL Taken, Equal Highs & Lows, MTF Dashboard, Multiple Time Frame, BigBar, HTF OB, HTF Market Structur
65 USD
Trend Screener Pro MT5
STE S.S.COMPANY
4.88 (49)
Unlock the Power of Trends with Trend Screener Indicator: Your Ultimate Trend Trading Solution! Are you ready to take your trend trading to the next level? Introducing Trend Screener, the breakthrough trend indicator that combines all the essential features you need into a single, powerful Indicator. With 100% non-repainting accuracy, multi-timeframe capabilities, and compatibility across various instruments, Trend Screener Indicator is your key to improve your trading in the world of forex, com
50 USD
Matrix Arrow Indicator MT5
Juvenille Emperor Limited
5 (13)
Matrix Arrow Indicator MT5  is a unique 10 in 1 trend following   100% non-repainting  multi-timeframe indicator that can be used on all symbols/instruments:   forex,   commodities,   cryptocurrencies,   indices,   stocks .  Matrix Arrow Indicator MT5  will determine the current trend at its early stages, gathering information and data from up to 10 standard indicators, which are: Average Directional Movement Index (ADX) Commodity Channel Index (CCI) Classic Heiken Ashi candles Moving Aver
75 USD
ICT Silver Bullet MT5
Haidar, Lionel Haj Ali
5 (13)
ICT Silver Bullet If you are searching for a reliable indicator to trade the ICT Silver Bullet concept, or ICT concepts, Smart Money Concepts, or SMC, this indicator will respond to your need!  Before version 2.2, this indicator was focused only on ICT Silver Bullet, but moving forward, we will include the different elements for smart money concept trading. This indicator will help you identify the following: FVG - fair value gaps Market structure: BOS and CHOCH. It is based on ZIGZAG as it is
39 USD
ICT, SMC, Smart Money Concept, Support and Resistance, Trend Analysis, Price Action, Market Structure, Order Blocks,   Breaker Blocks ,  Momentum Shift, Strong Imbalance,   HH/LL/HL/LH,    Fair Value Gap, FVG,  Premium  &   Discount   Zones, Fibonacci Retracement, OTE, Buyside Liquidity, Sellside Liquidity,  Liquidity Voids, Market Sessions ,Market Time,   , NDOG, NWOG,Silver Bullet,ict template  In the financial market, accurate market analysis is crucial for investors. To help investors better
39 USD
Profit from market structure changes as price reverses and pulls back. The market structure reversal alert indicator identifies when a trend or price move is approaching exhaustion and ready to reverse. It alerts you to changes in market structure which typically occur when a reversal or major pullback are about to happen. The indicator identifies breakouts and price momentum initially, every time a new high or low is formed near a possible exhaustion point. The indicator draws in a rectangle on
49 USD
Blahtech Supply Demand MT5
Blahtech Limited
4.54 (13)
Was: $299    Now: $149   Supply Demand uses previous price action to identify potential imbalances between buyers and sellers. The key is to identify the better odds zones, not just the untouched ones. Blahtech Supply Demand indicator delivers functionality previously unavailable on any trading platform. This 4-in-1 indicator not only highlights the higher probability zones using a multi-criteria strength engine, but also combines it with multi-timeframe trend analysis, previously confirmed swi
149 USD
FX Volume MT5
Daniel Stein
4.8 (15)
Get your daily market update with details and screenshots via our Morning Briefing  here on mql5  and  on Telegram ! FX Volume is the FIRST and ONLY volume indicator that provides a REAL insight into the market sentiment from a broker's point of view. It provides awesome insights into how institutional market participants, like brokers, are positioned in the Forex market, much faster than COT reports. Seeing this information directly on your chart is the real game-changer and breakthrough solu
99 USD
Auto Order Block with break of structure Detect Break of Structure , Mark Order Block and draw Entry / Stop and Risk to Reward lines when Order block is touch by price with Alert. Trend is Manually set to filter signals in a direction by a button on the chart. Entry / Stop and Risk to Reward lines can also be switch on / off by button on chart. Futures Auto Mark Break of Structure Auto Mark Order block Auto Mark higher time frame Point Of  Interest ( POI ) Popup Alert when BoS , Order block
65 USD
Market Structure Patterns
Samuel Manoel De Souza
4.93 (14)
Market Structure Patterns is an indicator based on smart money concepts that displays structures and zones on the chart, can send alerts of any type, have his values accessed through global variables what makes easy create Expert Advisors based on it. This is the only one of this type in the market that allows the control of the transparency of the zones on the chart. The indicator also paints the   candlesticks   depending on the trend. This feature can be enabled in the parameter "Color Candle
30 USD
Quantum Trend Sniper
Bogdan Ion Puscasu
5 (7)
Introducing   Quantum Trend Sniper Indicator , the groundbreaking MQL5 Indicator that's transforming the way you identify and trade trend reversals! Developed by a team of experienced traders with trading experience of over 13 years,   Quantum Trend Sniper Indicator   is designed to propel your trading journey to new heights with its innovative way of identifying trend reversals with extremely high accuracy. ***Buy Quantum Trend Sniper Indicator and you could get Quantum Breakout Indicator fo
99.99 USD
FX Power MT5 NG
Daniel Stein
5 (1)
Trading GOLD, and currencies, with the dog walk strategy Get your daily market update with details and screenshots via our Morning Briefing  here on mql5  and  on Telegram ! FX Power MT5 NG  is the next generation of our long-time very popular currency strength meter, FX Power.  And what does this next-generation strength meter offer? Everything you have loved about the original FX Power  PLUS GOLD/XAU strength analysis Even more precise calculation results Individually configurable analysis pe
99 USD
Welcome to Propsense, the best solution for new and veteran traders with a simple   FREE   strategy! NEW to MT5! This indicator is a unique and affordable trading tool built on the teachings of a former bank trader. With this tool, you will be able to see inefficient points with ease. Additionally, traders will have a clean Heads Up Display which will show your running and closed P/L in pips AND currency units. As a highly requested option, a candle timer has been added which will allow you to j
50 USD
Black Dragon indicator mt5
Ramil Minniakhmetov
4.79 (48)
The trend detection indicator will compliment any strategy and can also be used as an independent tool. IMPORTANT! Contact me immediately after the purchase to get instructions and a bonus!  Benefits  Easy to use; does not overload the graphic wih unnecessary information. The ability to use as filter for any strategy. Contains bult -in dynamic levels of cupport and resistange,  which can be used both, for profit taking, and for settings up stop-losses. The indicator does not change color after t
30 USD
Introducing   Quantum Breakout PRO , the groundbreaking MQL5 Indicator that's transforming the way you trade Breakout Zones! Developed by a team of experienced traders with trading experience of over 13 years,   Quantum Breakout PRO   is designed to propel your trading journey to new heights with its innovative and dynamic breakout zone strategy. Quantum Breakout Indicator will give you signal arrows on breakout zones with 5 profit target zones and stop loss suggestion based on the breako
99.99 USD
The ADR Reversal Indicator shows you at a glance where price is currently trading in relation to it's normal average daily range. You will get instant alerts via pop-up, email or push when price exceeds it's average range and levels above it of your choosing so you can jump into pullbacks and reversals quickly. The indicator draws horizontal lines on the chart at the average daily range extremes and also extensions above those levels which have mathematical probabilities attached to them of pric
49 USD
Support and Resistance, Trading System, Indicator, Candlestick Patterns, VWAP, Trend Catcher, Multi-Timeframe Trend, Support Levels, Resistance Levels, Trading Strategies, Complete Trading System, Technical Analysis, Forex Trading, Price Action, Market Trends, Trading Signals, Trend Identification, Swing Trading, Day Trading, Swing Trading Strategies, Technical Indicators, Trading Tools, Trend Confirmation, Entry and Exit Points, Trading Panel, Forex Signals, Trend Reversals, Trading Algorithms
100 USD
IVISTscalp5
Vadym Zhukovskyi
5 (1)
We present you the iVISTscalp5 indicator, which is not only unique, but also effective in the analysis of trading operations. This indicator is based on time data and is the result of many years of experience and deep analysis of financial markets. The iVISTscalp5 indicator is an excellent assistant for manual trading. Convenience, simplicity and visualization. All the most difficult is hidden inside. We have simplified the settings and use of the iVISTscalp5 indicator as much as possible. The i
500 USD
Strong Support mt5
Vasiliy Strukov
5 (9)
Support and resistance levels have long been a powerful tool for market analysis. The Strong Support indicator plots support levels based on local price minima, and resistance levels based on local price maxima. My other developments can be viewed   here It is recommended to use together with a trend indicator, for example, Gold Stuff - this will allow you to trade according to the trend and simultaneously determine the zones of consolidation or trend reversal, as well as set stop loss and
50 USD
The ADR Alert Dashboard shows you at a glance where price is currently trading in relation to it's normal average daily range. You will get instant alerts via pop-up, email or push when price exceeds it's average range and levels above it of your choosing so you can jump into pullbacks and reversals quickly. The dash is designed to be placed on a blank chart and just sit in the background and alert you when levels are hit so you do not need to sit and watch it or even look at all! MT4 VERSION AV
49 USD
The RSI / TDI alert dashboard allows you to monitor RSIs at once (selectable by you) on every major pair you trade. You can use it in two ways: 1.   Select multiple time frames and the dash will show you when there are multiple time frames extended beyond normal trading conditions. A great indicator that price has pushed hard recently as it has achieved an overbought or oversold level across multiple time frames so a pullback or reversal is due soon. 2.   Use one time frame (your favourite to tr
49 USD
Trend Scanner mt5 GS
Vasiliy Strukov
5 (14)
Trend Scanner mt5 scans market trends from Multi-Symbols and Multi-Time frames and displays it on a movable panel on the chart. It uses  Gold stuff indicator   for analysis .The trader can select multiple pairs of his choice for display.   Trend Scanner is a great tool to see the direction of the trend and can be used for manual trading or EA trading by allowing only buy or sell orders according to the trend. Real-time results can be viewed  here . Contact me immediately after the purchase to g
50 USD
Introducing the Quantum Heiken Ashi PRO charts with integrated alerts Designed to provide clear insights into market trends, the Heiken Ashi candles are renowned for their ability to filter out noise and eliminate false signals. Say goodbye to confusing price fluctuations and hello to a smoother, more reliable chart representation. What makes the Quantum Heiken Ashi PRO truly unique is its innovative formula, which transforms traditional candlestick data into easy-to-read colored bars. Red and g
99.99 USD
Forex Master Pattern
Alberto Gauer Borrego
4.89 (9)
The Forex Master Pattern  is an alternative form of technical analysis that provides a framework which will help you to find and follow the hidden price pattern that reveals the true intentions of financial markets. This algorithm here does a good job detecting the Phase 1 of the Forex Master Pattern cycle, which is the contraction point (or Value).  On Phase 2 we get higher timeframe activation (also called Expansion), which is where price oscillates above and below the average price defined
49 USD
More from author
Cybertrade Auto Fibonacci retraction and projection  - MT5 ##### Free indicator for an indefinite period. ##### Auto Fibonacci is an indicator that automatically plots the Fibonacci retracement and projection based on the number of bars you select in the indicator setting. You can customize nine different levels of retraction and three levels of projection. It works on periods longer than the period visible on the chart. All values ​​are available in the form of buffers to simplify possible au
FREE
Cybertrade ATR Trend Zone - MT5 The indicator shows, by calculating the ATR (Average True Range), the zone of probable price resistance. Indicated to be used as a probable exit point of an operation. It works on periods longer than the period visible on the chart. All values ​​are available in the form of buffers to simplify possible automations. This indicator is the same one we use in our EA. Also check out our other products.
FREE
Cybertrade Double Bollinger Bands - MT5  The Bollinger Bands indicator shows the levels of different highs and lows that a security price has reached in a given duration and also their relative strength, where the highs are close to the upper line and the lows are close to the lower line. Our differential is to present this indicator in a double form, with the availability of its values ​​to simplify automation. It works on periods longer than the period visible on the chart. All values ​​are
FREE
Cybertrade
Emanuel Andriato
Cybertrade Agile and Flexible - MT5 (Your strategy in any market) *** PROMOTIONAL LAUNCH PRICE *** Flexible EA regarding parameterization, where the trader can configure his own setup, risk management and trading plan. Our EA is an advanced, high quality solution, always developed with attention focused on performance and flexibility of use and also always attentive to the need of traders to work in different ways. With the diversity of indicators and parameters available, it is possible to de
300 USD
Filter:
HOGJoerch63
224
HOGJoerch63 2023.02.03 07:52 
 

Very usefull. I like it. Thanks

ONK3R D:
46
ONK3R D: 2022.09.26 12:42 
 

Love it, helps with low volume trade

Matias Bossio
66
Matias Bossio 2022.07.22 06:08 
 

no he tenido aún la posibilidad de probarlo en profundidad pero parece que se desempeña bien

Reply to review