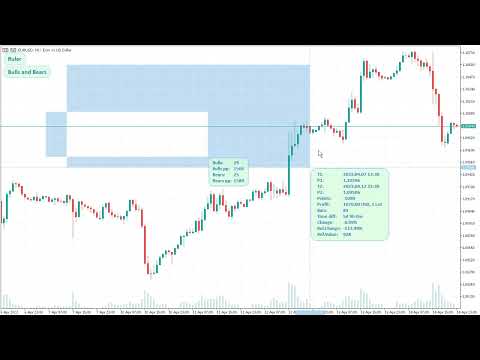
Smart Ruler MT5
- Utilities
- Version: 2.25
- Updated: 22 April 2023

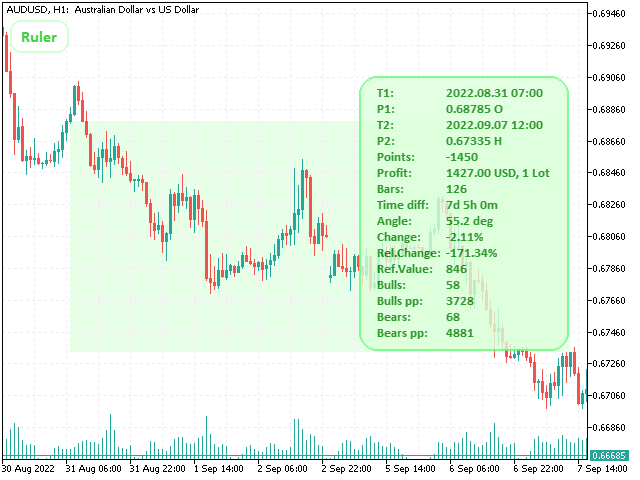
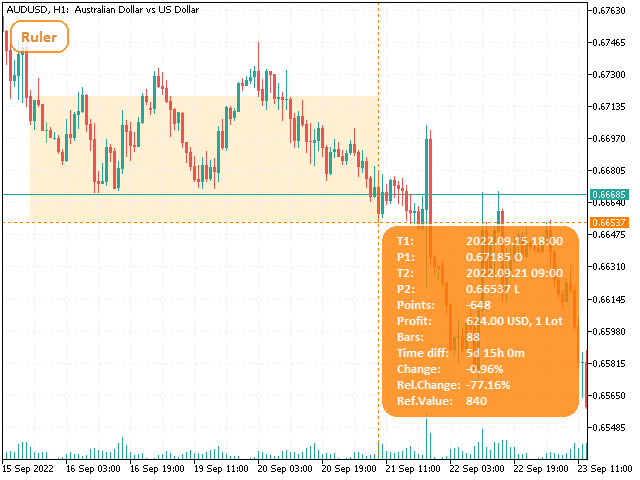
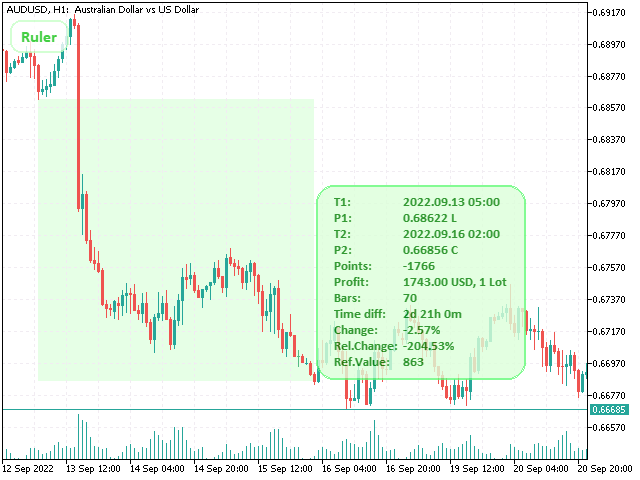
This tool is designed to measure the distance between two points on a chart and much more.
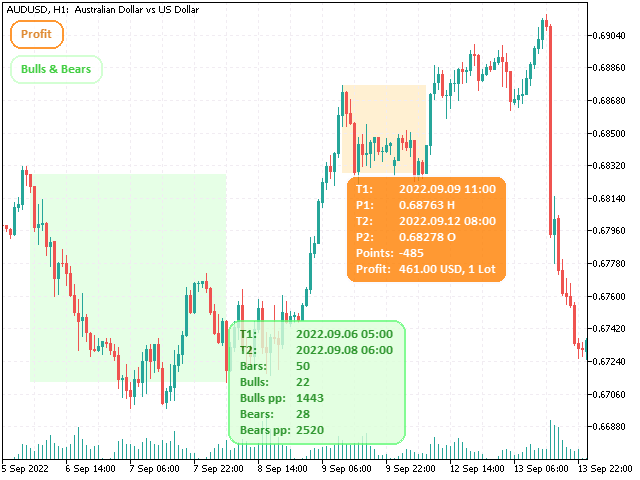
List of measured values:
List of measured values:
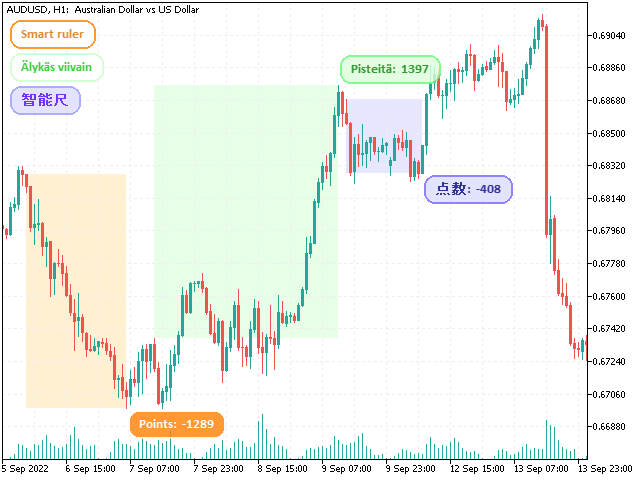
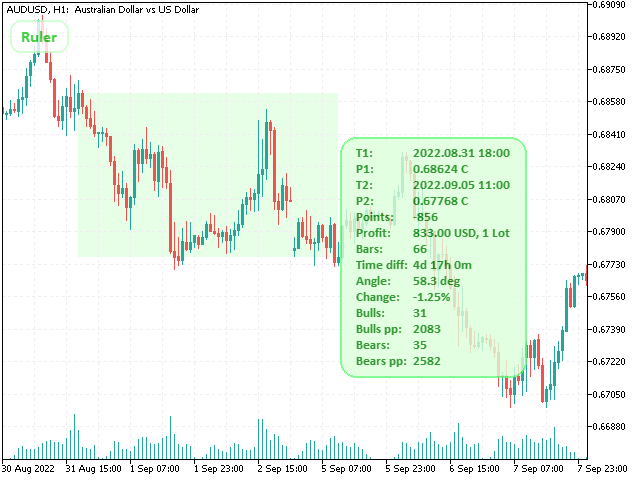
- Distance in points
- Profit (with and without spread)
- Time difference
- Percentage price change
- Slope angle
- Number of bars (various variations)
- Ratio of distance in points to the reference value
- Snap to OHLC prices
- Automatic color profile setting based on chart background color
- Various types of pointers to choose from
- Display of values of selected points on the chart
- Various types of display of the measurement area
- Double-click and keyboard control
- Flexible font and color settings
- Invisible mode (when idle, the indicator does not display anything on the screen)
- Switch the indicator to measurement mode. This can be done in three ways: press the button, double-click the left mouse button on the chart, or press the corresponding key.
- Set the first point by clicking the left mouse button in the desired location on the chart.
- Set the second point. The meter window will display the values selected in the input parameters. You can display the measurement results in the "Experts" tab by pressing the corresponding key.


Have been using "Smart ruler" for a couple of years. Am honestly surprised there are so few activations on what i have found to be a crucial trading instrument, for both manual and algo trading. Simple, but does what is supposed to.