ATR Monitor
- Indicators
- Flavio Javier Jarabeck
- Version: 1.2
- Updated: 10 August 2020
ATR is a measure of volatility introduced by market technician J. Welles Wilder Jr. in his book, "New Concepts in Technical Trading Systems".
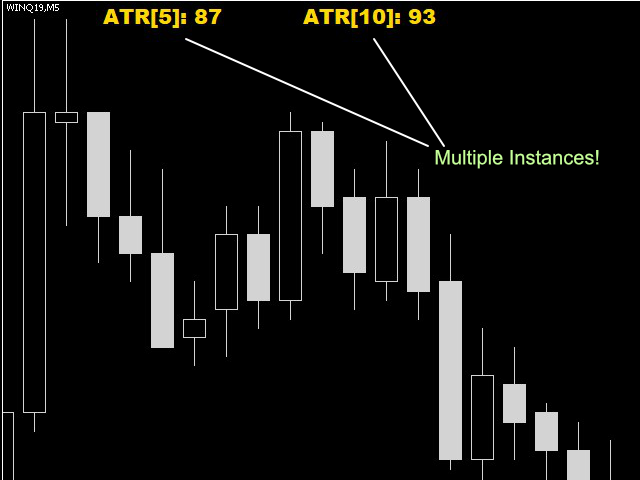
In general, traders are accustomed to seeing the ATR in the form of a sub-window indicator. What I am presenting here is a simplified version of ATR - just the current ATR number - very useful for monitoring just the very moment of the current chart.
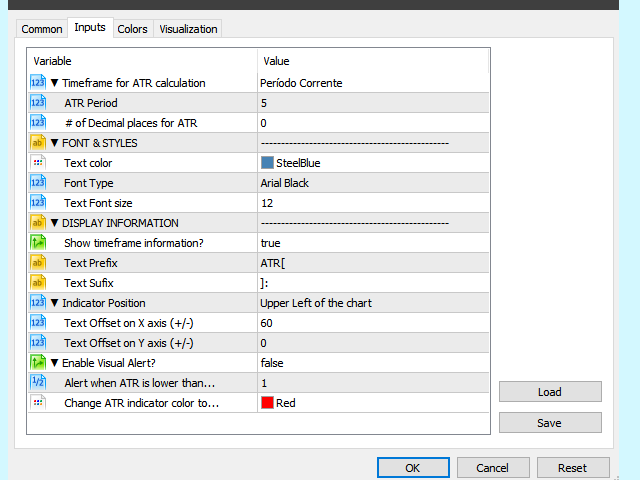
If you want to monitor several timeframes in the same chart, just add the ATR Monitor indicator several times, each with its specific timeframe (see the settings screen below).
FEATURES
- Timeframe to monitor (number in brackets)
- ATR period
- Font size of the ATR Monitor
- Number of decimal places (if applicable)
- Font Type
- Font Color
- Font Size
- Text anchor position
- Position on screen (X,Y padding)
- Preffix and Suffix setting
- Ability to hide the timeframe on the text shown on Chart.
- Ability to set a Visual "Alarm", changing the text color when the ATR is below a certain range.
If you like this indicator, all I am asking is a little Review (not a Comment, but a REVIEW!)...
This will mean A LOT to me... And this way I can continue to give away Cool Stuff for Free...
With No Strings Attached! Ever!
Live Long and Prosper!
;)


Great item, very simple and convenient! But it can be improved by adding the value of how much the price has already passed today. These two values are important together (so you don't have to worry about how far you have to go from the average). But overall great!