Candlestick Pattern Teller
- Indicators
- Flavio Javier Jarabeck
- Version: 1.2
- Updated: 6 June 2020
- Activations: 20
Minions Labs' Candlestick Pattern Teller
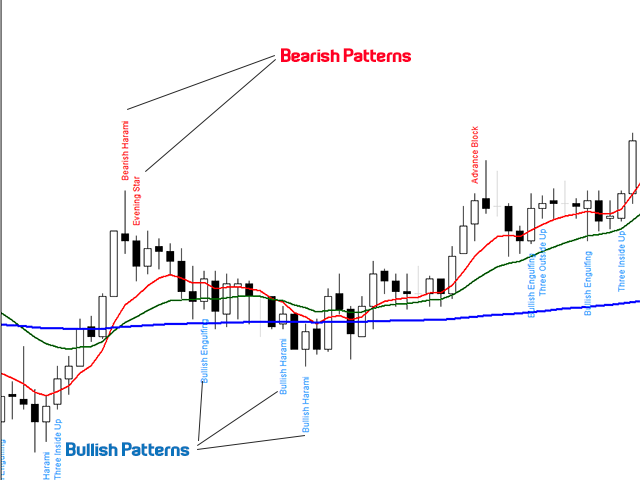
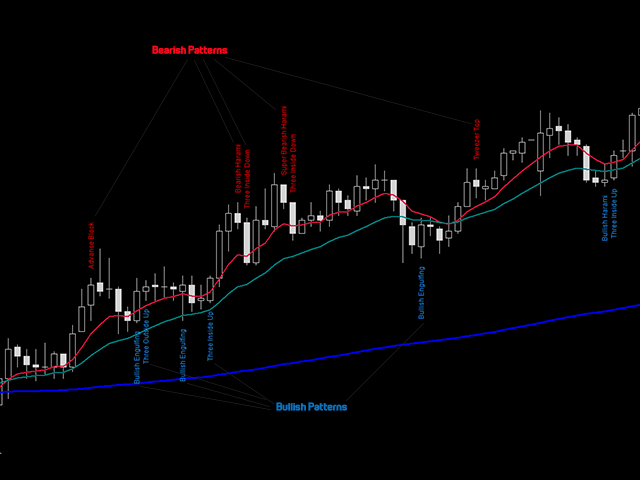
It shows on your chart the names of the famous Candlesticks Patterns formations as soon as they are created and confirmed. No repainting.
That way beginners and also professional traders who have difficulties in visually identifying candlestick patterns will have their analysis in a much easier format. Did you know that in general there are 3 types of individuals: Visual, Auditory, and Kinesthetic? Don't be ashamed if you cannot easily recognize Candlestick patterns. We get you covered!
Pattern List
The Candlestick Pattern Teller was created for the *Day Trader*. That's why our patterns don't include those with gaps in price. So this indicator is recommended for Liquid Symbols, and using in liquid Symbols also will benefit you with more reliable patterns. The list:
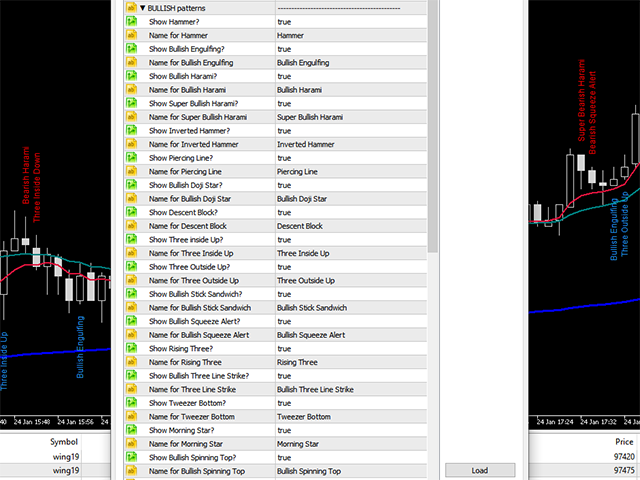
Bullish Patterns
- Bullish Engulfing :: Tsutsumi
- Hammer :: Kanazuchi
- Bullish Harami :: Harami
- Super Bullish Harami :: (Minions Labs' creation)
- Inverted Hammer :: Tohba
- Piercing Line :: Kirikomi
- Bullish Doji Star :: Doji Bike
- Descent Block :: Saki Zumari Kudari
- Three Inside Up :: Harami Age
- Three Outside Up :: Tutsumi Aga
- Bullish Stick Sandwich :: Gyakusashi Niten Zoko
- Bullish Squeeze Alert :: Tsukami
- Rising Three :: Uwa Banare Sanpoo Ohdatekomi
- Bullish Three Line Strike :: Sante Uchi Karasu No Bake Sen
- Tweezer Bottom :: Kenukizoko
- Morning Star :: Sankawa Ake No Myojyo
- Bullish Spinning Top
- Above The Stomach
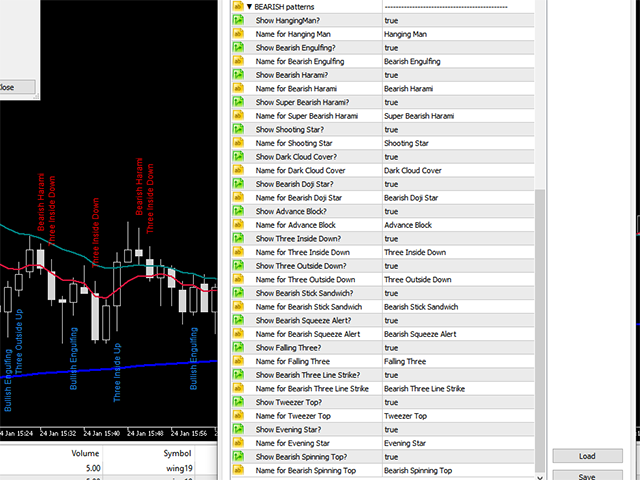
Bearish Patterns
- Bearish Engulfing :: Tsutsumi
- Hanging Man :: Kubitsuri
- Bearish Harami :: Harami
- Super Bearish Harami :: (Minions Labs' creation)
- Shooting Star :: Nagare Boshi
- Dark Cloud Cover :: Kabuse
- Bearish Doji Star :: Doji Bike
- Advance Block :: Saki Zumari
- Three Inside Down :: Harami Sage
- Three Outside Down :: Tutsumi Sage
- Bearish Stick Sandwich :: Gyakusashi Niten Zoko
- Bearish Squeeze Alert :: Tsukami
- Falling Three :: Uwa Banare Sanpoo Ohdatekomi
- Bearish Three Line Strike :: Sante Uchi Karasu No Bake Sen
- Tweezer Top :: Kenukitenjo
- Evening Star :: Sankawa Ake No Myojyo
- Bearish Spinning Top
- Below The Stomach
We named the "Super Bullish Harami" to a variation pattern that is more powerfull, or at least, have more probability of a reversal than the traditional Bullish and Bearish Harami. It consists of the whole candle (high,Low, Open, Close) being engulfed by just (and only) the body of the previous candle.
Features
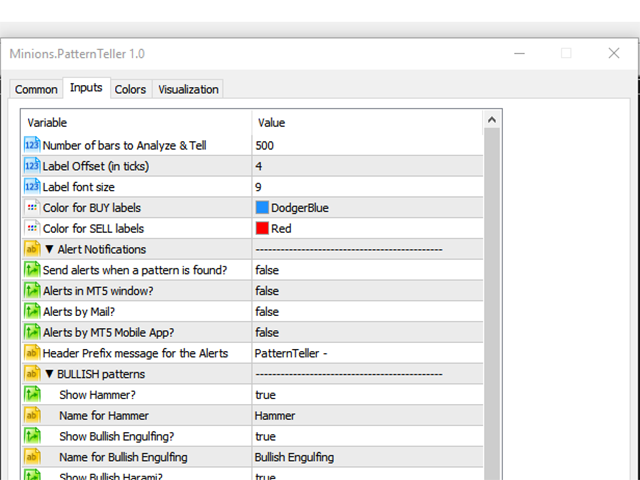
- You can set the past number of Bars to analyze, so you can save resources of your MT5.
- Set the distance (offset) of the labels from the candlesticks, as close or as far as you want.
- Control the Font size.
- Set the color of the Bullish and Bearish labels.
- Enable/Disable each candlestick pattern on the chart.
- Ability to change the Name of each pattern, so you can use your preferred names of your study/methodology within your chart.
- Alerts through: Window Popup, e-mail, MT5 Mobile App. All individually customizable (On/Off).
| If you want to try this indicator on a Live or Demo account, see the instructions on our Blog: https://www.mql5.com/pt/blogs/post/746804 |
|---|
Didn't Find a Feature You Need?
No product is perfect for everyone. If you think you need a missing feature from our product just send us a message. We love feedback!
About Us
Flavio Jarabeck is the owner of MinionsLabs.com, an entrepreneurship focused on leveraging the knowledge and experience of professional traders through automated trading robots, freeing them to seek new opportunities and strategies in new markets and assets.
;)

Very good, free forever 1000 activations, recommended!