Gekko Heiken Ashi Plus
- Indicators
- Rodrigo Galeote
- Version: 1.12
- Updated: 17 February 2023
- Activations: 5
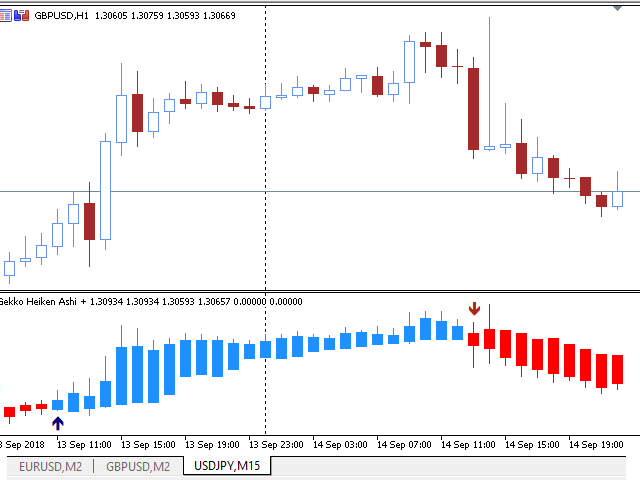
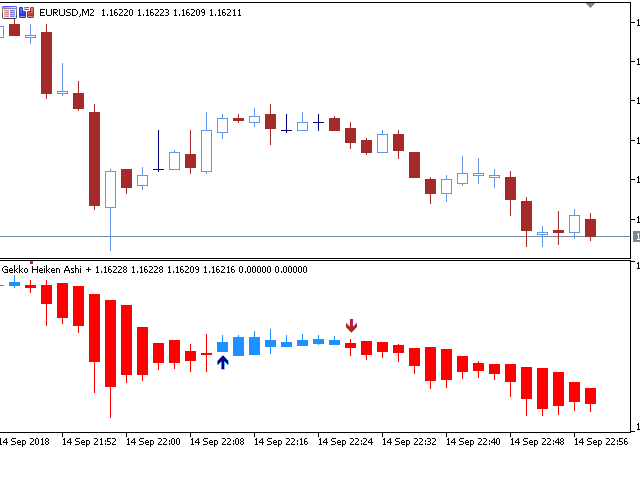
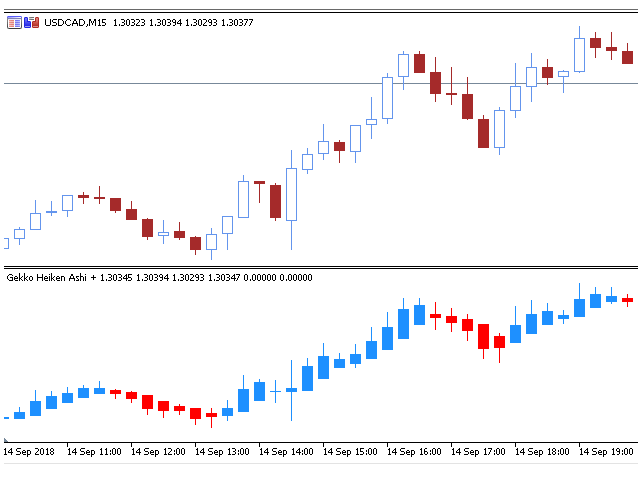
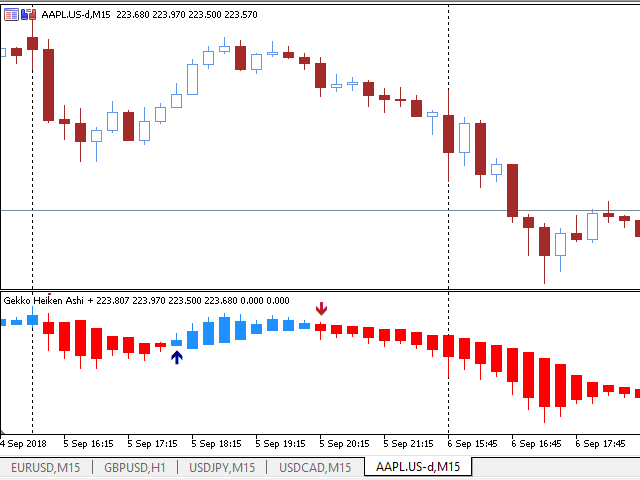
This is Gekko's customizable version of the famous Heiken Ashi indicator. It extends the use of the famous Heiken Ashi and calculates strong entry and exit signals.
Inputs
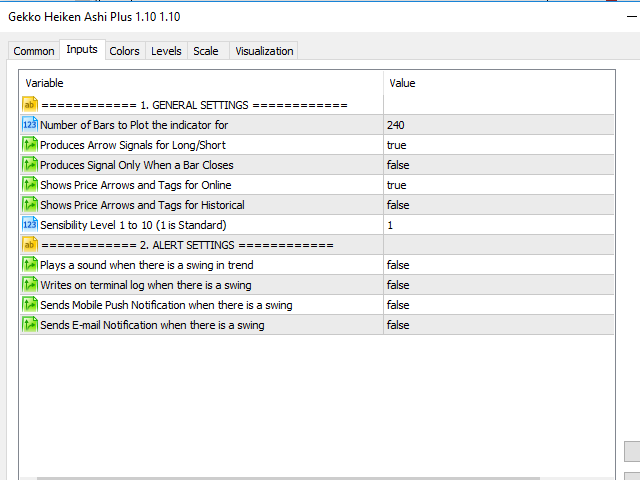
- Number of Bars to Plot Indicator: number of historical bars to plot the indicator, keep it low for better performance;
- Produce Arrow Signals: determine if the indicator will plot arrow signal for long/short;
- Produces Signal Only When a Bar Closes: wait for a bar to close to produce a signal (more accurate, by delayed entry) or produces signal online (could trigger false signals);
- Show Price Tags: if indicator will show price tags when there's an entry signal;
- Sensibility: configure different sensibility levels to smooth indicator and get better entry/exit signals
- Plays a sound when there is a swing: set it as true and it will play a sound on the MetaTrader terminal every time there is a new signal produced indicating entry or exit points.
- Write Logs On Terminal Window: set it as true if you want the indicator to write logs on the terminal's Experts tab every time a new signal is produced indicating entry or exit points
- Send Mobile Push Notifications: set it as true if you desire to receive push notifications on the MetaTrader app on your mobile when a new signal is produced indicating entry or exit points
- Send E-Mail Alerts: set it as true if you desire to receive e-mail alerts at the e-mail address configured on the terminal when a new signal is produced indicating entry or exit points
Good trades!
Donate part of your profit to good causes and humanitarian entities of your choice. "Money only comes if there's a purpose for you to earn it".