• Overview
  • Reviews (43)
  • Comments (576)
  • What's new

ClusterSecond

4.77

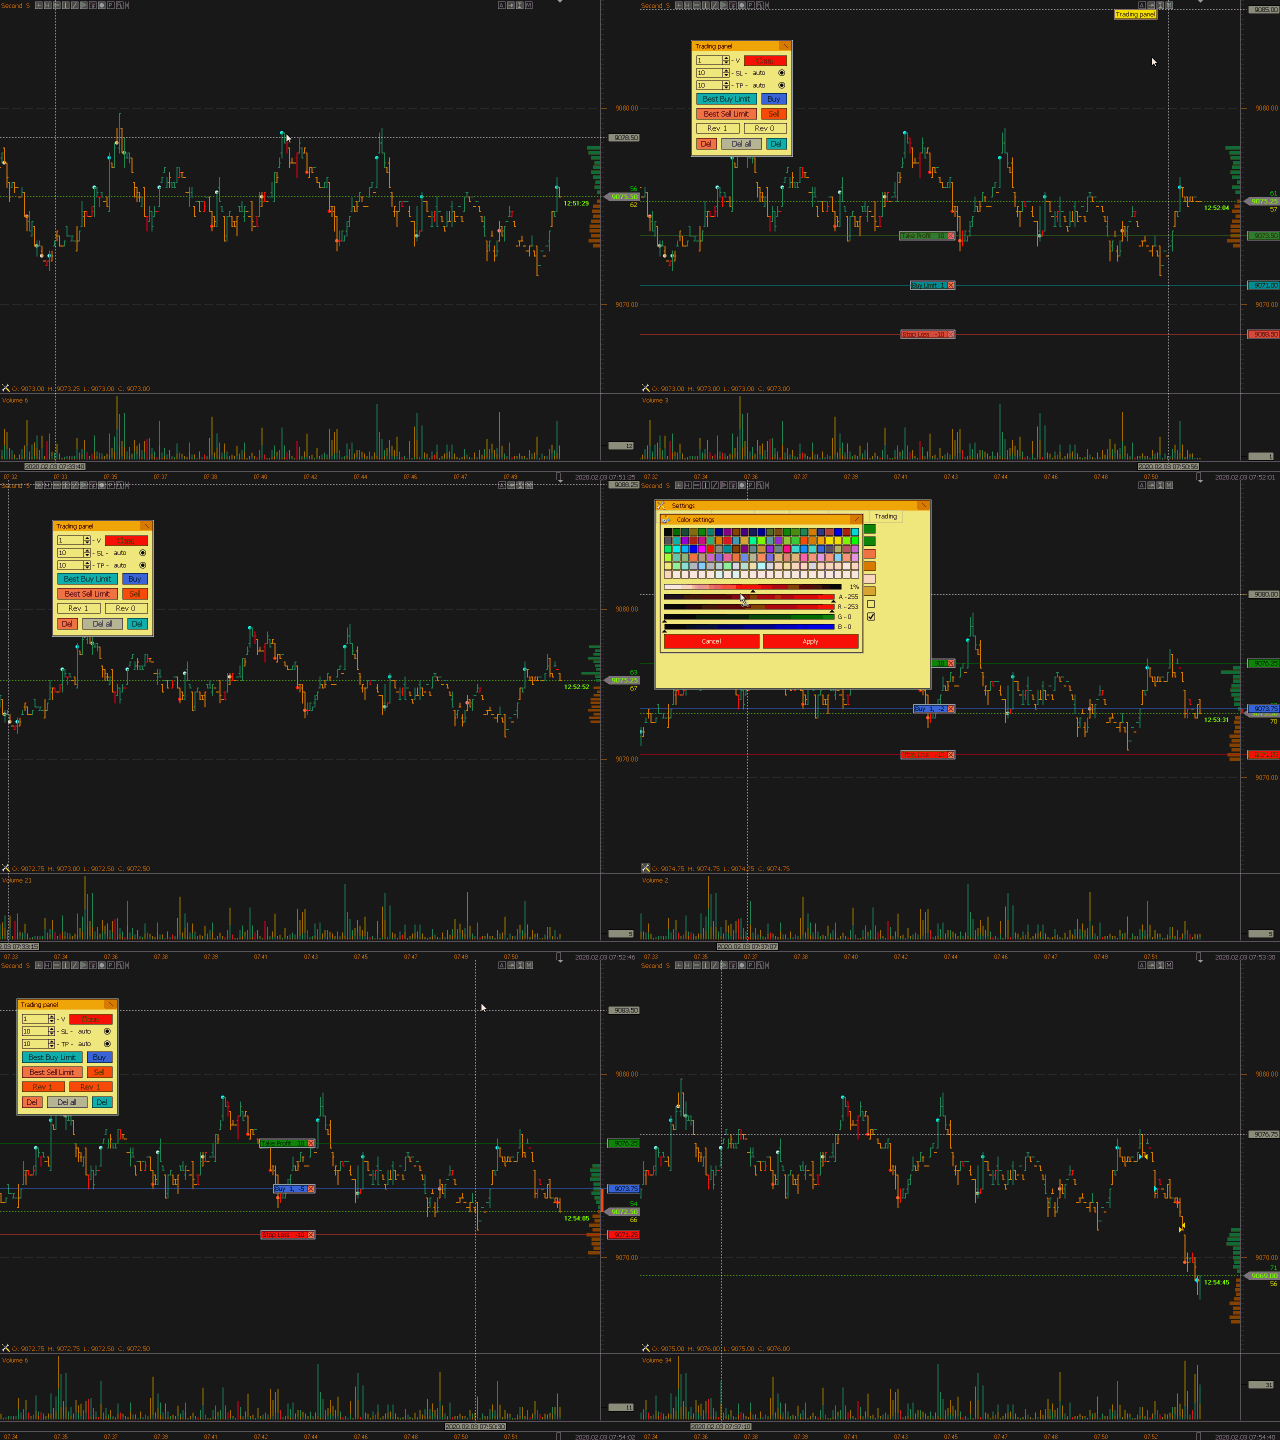
The utility allows you to build different types of graphs:

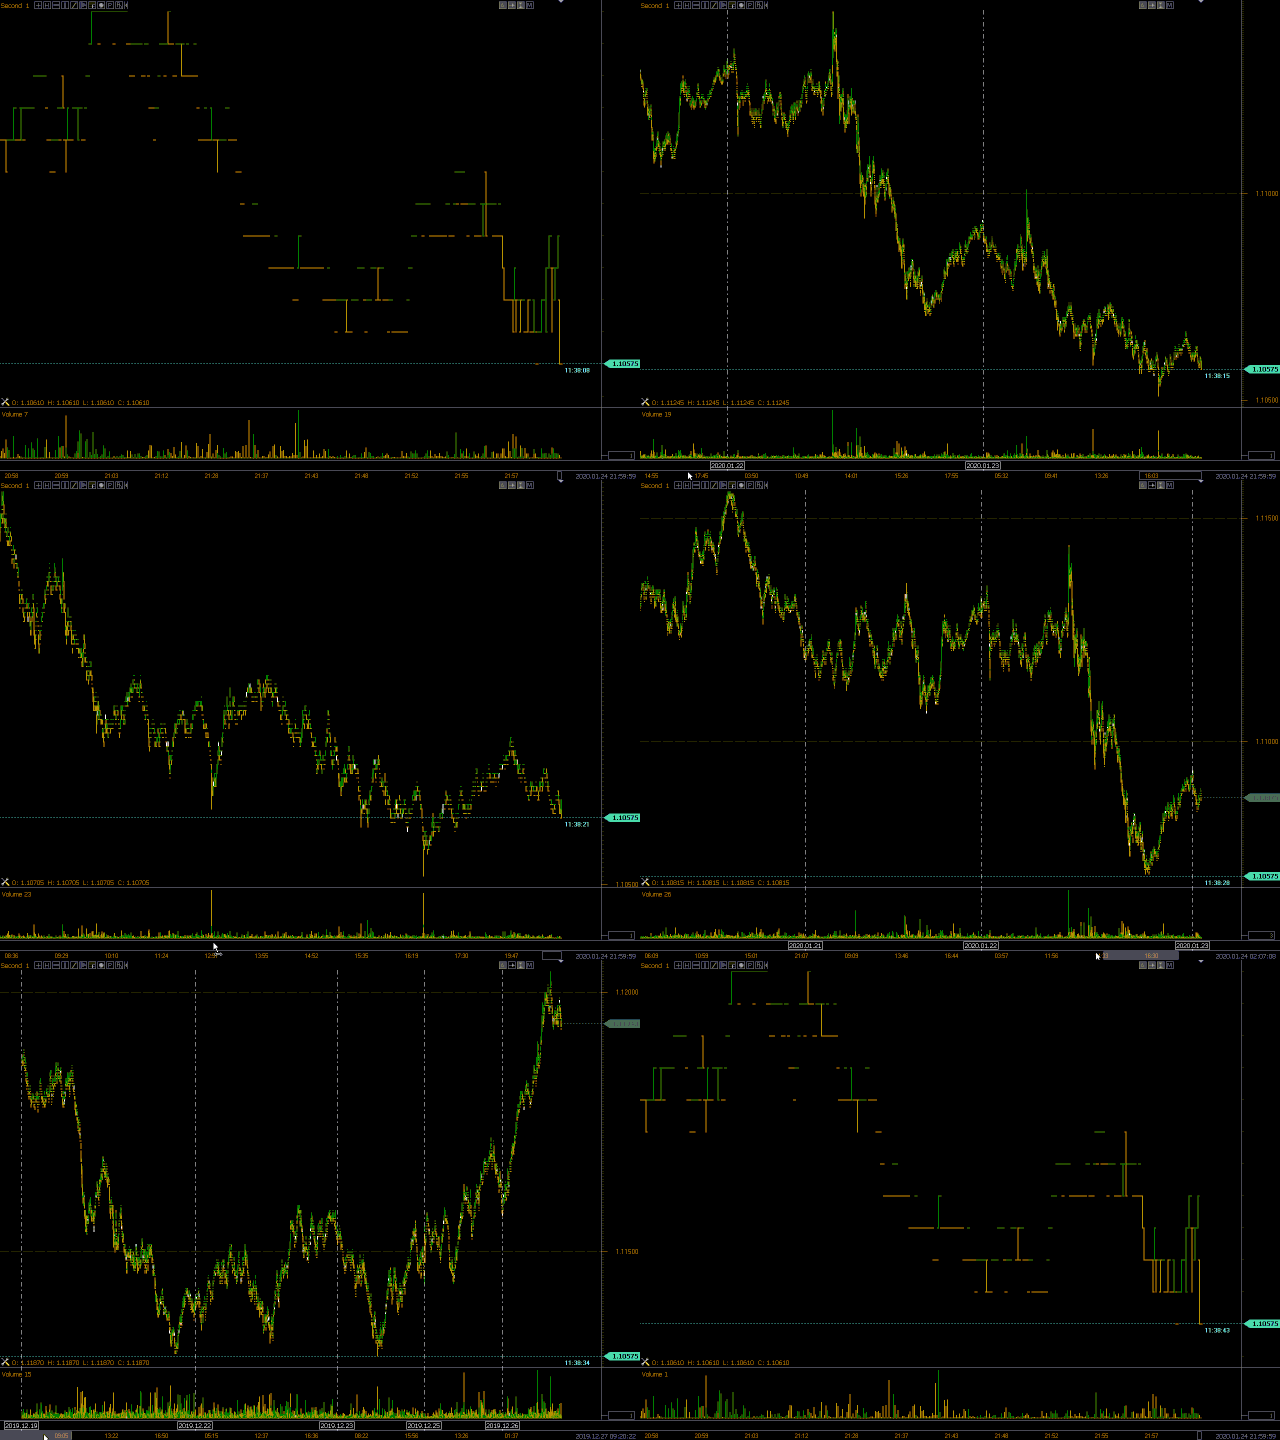
  1. Seconds chart from 1 second to 86400 seconds
  2. Tick chart from 1 tick and above
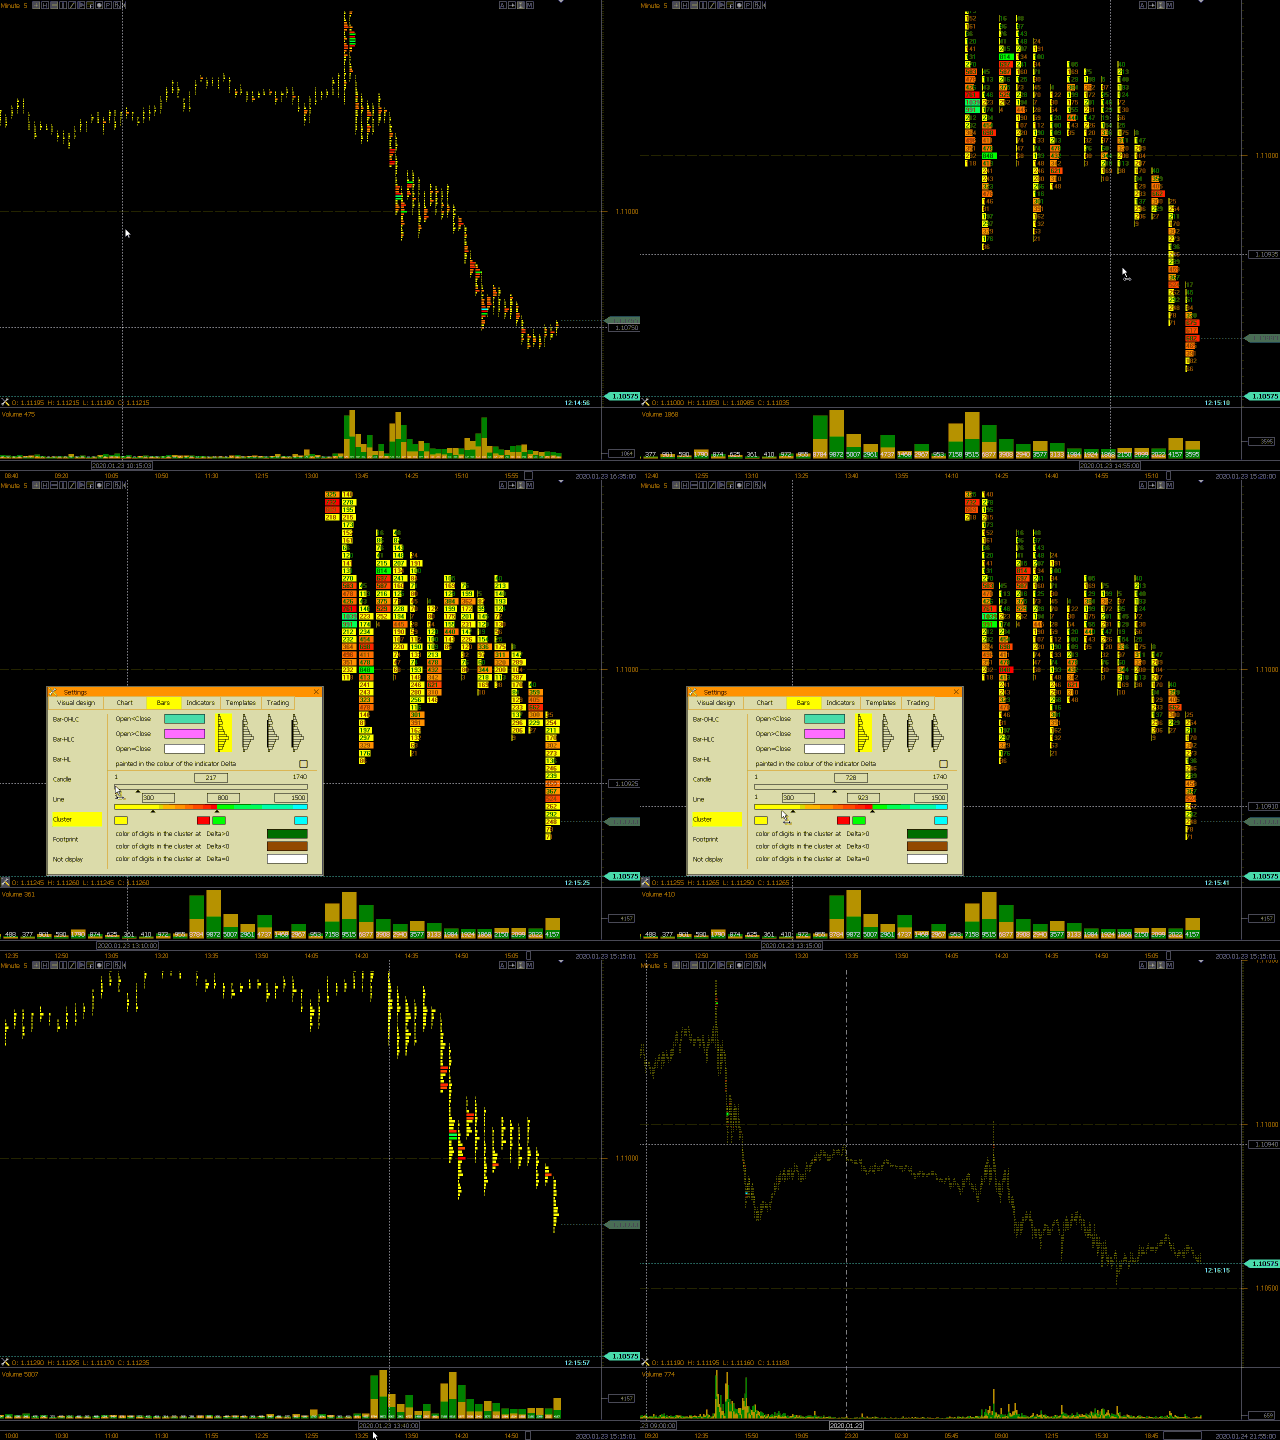
  3. The volume chart
  4. Delta chart
  5. Renko chart
  6. Range chart

Demo version of the utility https://www.mql5.com/ru/channels/clustersecond

Built-in indicators for volumetric analysis:

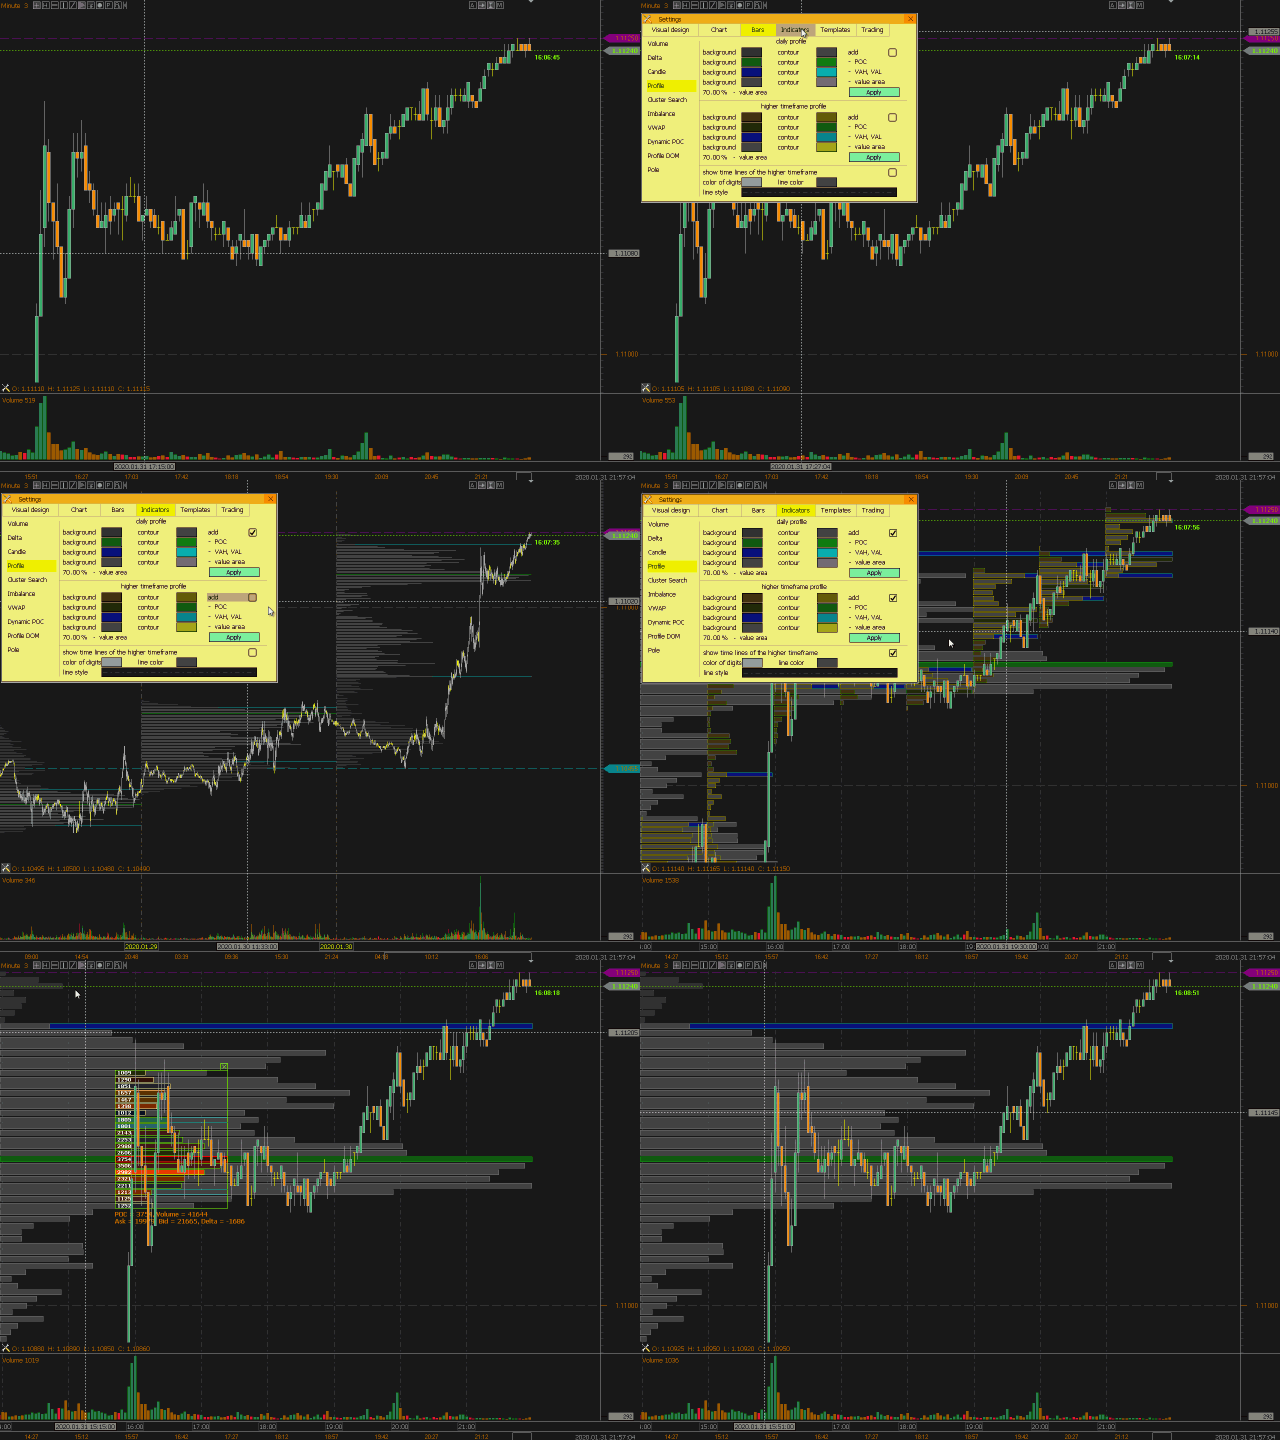
  • daily market profile and market profile of the selected timeframe,
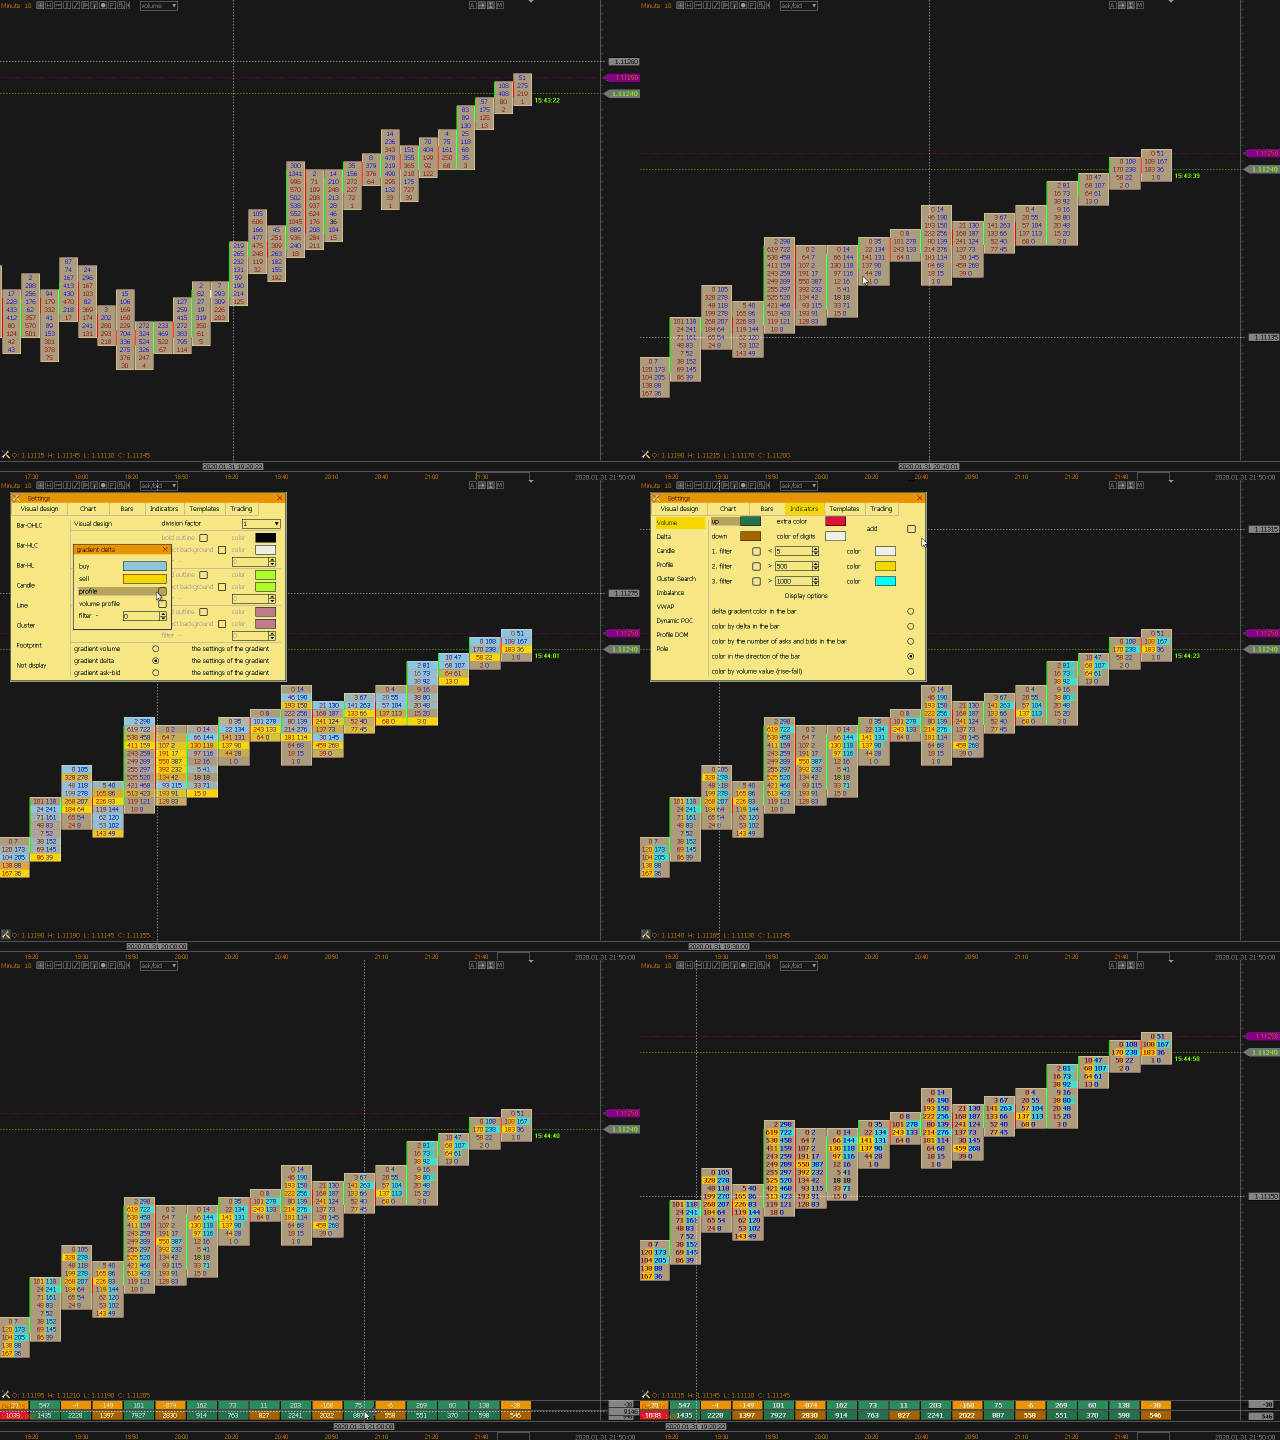
  • Cluster Search
  • Imbalance
  • VWAP
  • Dynamic POC, VAH, VAL
  • the profile depth of the market
  • vertical volume with various display options,
  • delta with various display options,
  • pole of the current and higher timeframe
  • basement candle display indicator

It is also possible to trade from the chart.

Note : the utility is intended for markets with real (exchange) volumes.  Not for the forex market. Doesn't work in the strategy tester.

To manage the schedule are used:

  • Left mouse button - moving the graph, selecting various modes in the settings, calling up the main settings window, located under the icon with a screwdriver in the lower left corner of the screen;
  • Right mouse button - used to enter the settings of graphical constructions located under the icons in the upper left corner of the screen, as well as the individual settings of drawn vertical, horizontal, trend lines and rectangles.
  • Rotating the mouse wheel in the chart area - moving the chart left-right, while holding the Ctrl key - moving the chart up and down, in the price scale area - scaling by price, in the timeline area - scaling with time;
  • Key H - set the horizontal line on the chart or in the volume area (the "horizontal line drawing" icon should be turned on), Shift + H - delete all horizontal lines;
  • Key V - set the vertical line (the "vertical line drawing" icon should be turned on), Shift + V - delete all vertical lines;
  • Key T - set a trend line (the icon "drawing a trend line and a rectangle" should be turned on), Shift + T - delete all trend lines and rectangles;
  • Key- set the rectangle (the icon "drawing a trend line and a rectangle" must be enabled), Shift + R - delete all trend lines and rectangles;
  • Key P - set the market profile (the icon "drawing a market profile" must be enabled), Shift + P - delete all built profiles;
  • Key F- set Fibonacci levels ( the icon "drawing Fibo levels " must be enabled), Shift + F- delete all built Fibo levels;
  • Keys Q and W- enable/disable profile display of the senior and daytime timeframe;
  • Keys A, S, D- enable/disable display of ClusterSearch indicator (volume, delta, askbid);
  • Spacebar - call the "ruler" mode to measure the number of points;
  • Arrow keys to the left and arrow to the right - one-way movement of the graph;
  • Up arrow and down arrow keys - move the graph up and down;
  • ESC key or wheel on/off button for "Mouth" function;
  • A right click in the lower right corner of the window returns the chart to the current bar with auto-scaling by price and sets the default time scale;
  • A right click in the upper right corner of the window updates the data without initializing other parameters;
  • Click the right mouse button in the upper left corner of the window to call the menu with the "Chart" tab opened.

To open orders:

  • Buy_Limit - in the chart area below the current price, press Ctrl + left mouse button;
  • Sell_Limit - in the chart area above the current price, press Ctrl + left mouse button;
  • Buy_Stop - in the chart area above the current price, press Shift + left mouse button;
  • Sell_Stop - in the chart area below the current price, press Shift + left mouse button;
  • Buy_Market - in the price scale area above the current price, press Shift + left mouse button;
  • Sell_Market - in the price scale area below the current price, press Shift + left mouse button.


Input parameters

  • Depth of Market add? - If the broker does not translate data in the price bucket, this parameter should be disabled.


    Orders Buy_Stop_Limit and Sell_Stop_Limit are not installed by this utility, use the standard terminal features to install them.

    The Open Interest indicator is intended only for the Moscow exchange.

    Custom indicators are not used in the utility and it is not possible to install them!!!

    Reviews 20
    saiberia
    21
    saiberia 2023.12.03 14:22 
     

    Здравствуйте. Сразу видно работа выполнена мастером своего дела, в ней нет мелочей, которые бы остались без внимания, все четко и со вкусом. Когда такая вещь попадает в руки это всегда праздник. Большое вам спасибо, торговать одно удовольствие.

    taka
    22
    taka 2023.04.27 13:21 
     

    I used the demo version for a while and then decided to purchase it. Thank you for the wonderful indicator. It has the functions I need to make profits.

    Andrzej Maksecki
    28
    Andrzej Maksecki 2021.12.28 12:09 
     

    Пользовался демо год. Купил полную версию. Очень доволен. Все информативно, без глюков работает. Восемь окон открыто с утилитой СS. Четыре РТС и 4 окна Брент, разные таймы, футпринт и кластера. Все работает четко без глюков на 6 Гб оперативки. Да и еще параллельно второй терминал MT5 c АМР запучен, тоже с утилитой, там Сиплый и золото. Проц i3 2700 Мгц .

    Recommended products
    This indicator allows you to enjoy the two most popular products for analyzing request volumes and market deals at a favorable price: Actual Depth of Market Chart Actual Tick Footprint Volume Chart This product combines the power of both indicators and is provided as a single file. The functionality of Actual COMBO Depth of Market AND Tick Volume Chart is fully identical to the original indicators. You will enjoy the power of these two products combined into the single super-indicator! Below is
    40 USD
    ClusterSecondForex
    Rafil Nurmukhametov
    4.67 (3)
    The utility allows you to build different types of graphs: Seconds chart from 1 second to 86400 seconds Tick chart from 1 tick and above The volume chart Delta chart Renko chart Range chart Product demo https://www.mql5.com/ru/channels/clustersecondforex Built-in indicators for volumetric analysis: daily market profile and market profile of the selected timeframe, Cluster Search Imbalance VWAP Dynamic POC, VAH, VAL the profile depth of the market vertical volume with various display options, del
    170 USD
    The indicator builds current quotes, which can be compared with historical ones and on this basis make a price movement forecast. The indicator has a text field for quick navigation to the desired date. Options: Symbol - selection of the symbol that the indicator will display; SymbolPeriod - selection of the period from which the indicator will take data; IndicatorColor - indicator color; Inverse - true reverses quotes, false - original view; Next are the settings of the te
    55 USD
    VolumeProfile MT5
    Robert Hess
    3.75 (8)
    Description: The Volume Profile displays detailed informations of historical trading activities at certain price levels (Market Profile). Locate the areas with the best prices in the market and get an advantage over other market participants. Support: The indicator is constantly being developed and improved. Please do not hesitate to contact me via the MQL5 Platform. I am very grateful about any Bug report, so that i can constantly improve the indicator. I appreciate any public review for this
    140 USD
    Tick Chart — full-featured chart for MetaTrader 5. A utility for creating and working with a tick chart in the MetaTrader 5 terminal. You can create a tick chart that works exactly the same as a regular chart. You can apply indicators, Expert Advisors and scripts to the tick chart. You get a fully functional tick chart on which you can work just as well as on a regular chart. You can enable the output of the Ask price data. The data are generated in the form of the upper shadow of a tick bar. Fr
    30 USD
    Volume by Price MT5
    Brian Collard
    5 (2)
    The Volume by Price Indicator for MetaTrader 5 features Volume Profile and Market Profile TPO (Time Price Opportunity). Get valuable insights out of currencies, equities and commodities data. Gain an edge trading financial markets. Volume and TPO histogram bar and line charts. Volume Footprint charts. TPO letter and block marker charts including split structures. Positioning and styling options to suit the user's needs and context. Highlight Volume Profile and Market Profile TPO Point of Contro
    259 USD
    The uniqueness of this indicator lies in the volume accounting algorithm: accumulation occurs directly for the selected period without reference to the beginning of the day. The last bars can be excluded from the calculation, then the current data will have less influence on the significant levels (volumes) formed earlier. For a more accurate calculation, data from the M1 graph is used by default. The step of distribution of price volumes is regulated. By default, the right border of the display
    35 USD
    This is visualization tool based on the Depth of Market. It works with the symbols that have the Depth of Market available. It's a visual indicator that shows the volume of each Bid/Ask price and ratio of total volume of Bids/Asks. Note: check if your broker supports DOM before purchasing. 。。。。。。。。。。。。。。。。。。。。。。。。。。。。。。。。。。。。。。。。。。。。。。。。。。。 。。。。。。。。。。。。。。。。。。。。。。。。。。。。。。。。。。。。。。。。。。。。。。。。。。。
    30 USD
    Trading Utility for Forex Currency Pairs Only not for Gold  Functions Auto Lot Calculation based on Risk Auto stoploss  Auto TakeProfit Breakeven Auto Close Half % Close in percentage with respect to the PIPs Pending Orders BuyLimit Sell Limit with distances BuyStop Sell Stop    with distances Trading Informations Risk in percentage For Multiple trades Combine Takeprofit and Combine Stoplosses
    30 USD
    BoxChart MT5
    Evgeny Shevtsov
    5 (6)
    The market is unfair if only because 10% of participants manage 90% of funds. An ordinary trader has slim changes to stand against these "vultures". This problem can be solved. You just need to be among these 10%, learn to predict their intentions and move with them. Volume is the only preemptive factor that faultlessly works on any timeframe and symbol. First, the volume appears and is accumulated, and only then the price moves. The price moves from one volume to another. Areas of volume accumu
    33 USD
    VolumeDeltaBars
    Stanislav Korotky
    This indicator is a conventional analytical tool for tick volumes changes. It calculates tick volumes for buys and sells separately, and their delta on every bar, and displays volumes by price clusters (cells) within a specified bar (usually the latest one). The algorithm used internally is the same as in the indicator VolumeDeltaMT5 , but results are shown as cumulative volume delta bars (candlesticks). Analogous indicator for MetaTrader 4 exists - CumulativeDeltaBars . This is a limited substi
    30 USD
    Before installing the HeatMap indicator make sure you are using a broker that gives you access to the Depth of market (DOM) !! This indicator creates a heatmap on your chart allowing you to see the buy or sell limit orders easily and in real time. You have the possibility to change the setting and the colors of the HeatMap in order to adapt to all markets and all charts. Here is an example of a setting you can use with the NASDAQ100 on the AMPGlobal broker :  https://www.youtube.com/watch?v=x0
    80 USD
    Blahtech Supply Demand MT5
    Blahtech Limited
    4.57 (14)
    Was: $299  Now: $99   Supply Demand uses previous price action to identify potential imbalances between buyers and sellers. The key is to identify the better odds zones, not just the untouched ones. Blahtech Supply Demand indicator delivers functionality previously unavailable on any trading platform. This 4-in-1 indicator not only highlights the higher probability zones using a multi-criteria strength engine, but also combines it with multi-timeframe trend analysis, previously confirmed swings
    99 USD
    Was: $249  Now: $99   Market Profile defines a number of day types that can help the trader to determine market behaviour. A key feature is the Value Area, representing the range of price action where 70% of trading took place. Understanding the Value Area can give traders valuable insight into market direction and establish the higher odds trade. It is an excellent addition to any system you may be using. Blahtech Limited presents their Market Profile indicator for the MetaTrader community. Ins
    99 USD
    Order Book, known also as Market Book, market depth, Level 2, - is a dynamically updated table with current volumes of orders to buy and to sell specific financial instument at price levels near Bid and Ask. MetaTrader 5 provides the means for receiving market book from your broker, but in real time only, without access to its history. The indicator OrderBook Cumulative Indicator accumulates market book data online and visualizes them on the chart. In addition, the indicator can show the market
    49 USD
    VWAP Daily
    Anton Polkovnikov
    Weighted average price indicator or VWAP. The well-known standard VWAP with the beginning of the day is added with the function of selecting the periodization. It can be calculated both every day and on other periods. Also the indicator allows to exclude the volume from the calculation, which will allow using it on the cryptocurrencies and forex. There is an alert for a VWAP price crossing. There are 1 and 2 standard deviation. Settings: Volume: turning volume on and off in the calculation mecha
    50 USD
    Wapv Price and volume
    Eduardo Da Costa Custodio Santos
    The WAPV Price and Volume Indicator for MT5 is part of the ( Wyckoff Academy Wave Market ) and (Wyckoff Academy Price and Volume) toolset. The WAPV Price and Volume Indicator for MT5 was created to make it easy to visualize the volume movement on the chart in an intuitive way. With it you can observe the moments of peak volume and moments when the market has no professional interest Identify moments when the market is moving by inertia and not by movement of "smart money". It consists of 4 color
    40 USD
    Noize Absorption Index - is the manual trading system that measures the difference of pressure between bears forces and bulls forces. Green line - is a noize free index that showing curent situation. Zero value of index shows totally choppy/flat market.Values above zero level shows how powerfull bullish wave is and values below zero measures bearish forces.Up arrow appears on bearish market when it's ready to reverse, dn arrow appears on weak bullish market, as a result of reverse expectation.
    199 USD
    The VWAP indicator is our version of the popular Volume-Weighted Average Price indicator. The VWAP is the ratio between the value traded (price multiplied by the number of volume traded) and the total volume traded over a specific time period. As a result, it measures the average price of the instrument much better than the simple moving average. Although there are many ways to use the VWAP, most investors use it to calculate the daily average.  The indicator works in five modes: Moving  - In
    69 USD
    This indicator is designed to determine the time of the greatest trading activity within a day. After this calculation, the indicator builds the most significant trading levels. Comparing these levels with actual price action can provide information about the strength and direction of market trends. Features of the indicator Timeframe must be below D1. Recommended timeframes: M15, M30 and H1. Timeframes above H1 can give a very rough picture. And the use of timeframes below M15 can lead to sh
    30 USD
    This indicator stamps any customized number at any point on the chart. To stamp any number, press the hotkey (0–9) and then click at any point on the chart. You can also stamp a series of numbers to indicate a chart pattern. (Each number synchronizes modification) How to stamp any number: Press the hotkey (0–9) to enter stamping mode. Click any point to stamp. How to stamp a double top/bottom pattern: Press the hotkey to enter stamping mode. Click any points to stamp. (If needed, press the bac
    50 USD
    PZ Trend Trading MT5
    PZ TRADING SLU
    3.67 (3)
    Trend Trading is an indicator designed to profit as much as possible from trends taking place in the market, by timing pullbacks and breakouts. It finds trading opportunities by analyzing what the price is doing during established trends. [ Installation Guide | Update Guide | Troubleshooting | FAQ | All Products ] Trade financial markets with confidence and efficiency Profit from established trends without getting whipsawed Recognize profitable pullbacks, breakouts and early reversals The ind
    249 USD
    Strong Support mt5
    Vasiliy Strukov
    5 (9)
    Support and resistance levels have long been a powerful tool for market analysis. The Strong Support indicator plots support levels based on local price minima, and resistance levels based on local price maxima. My other developments can be viewed   here It is recommended to use together with a trend indicator, for example, Gold Stuff - this will allow you to trade according to the trend and simultaneously determine the zones of consolidation or trend reversal, as well as set stop loss and
    149 USD
    VPO Profile MT5
    Kyra Nickaline Watson-gordon
    5 (1)
    Definition : VPO is a Volume Price Opportunity. Instead of using bars or candles with an Open, High, Low, and Close price, each "bar" in a Market Profile is represented by horizontal bars against the price It is called Market Profile terminology. In other words volume-price-opportunity (VPO) profiles are histograms of how many volumes were traded at each price within the span of the profile. By using a VPO chart, you are able to analyze the amount of trading activity, based on volume, for eac
    60 USD
    Delta Aggression Volume PRO is an indicator developed to monitor the strength and continuity of the aggression volume of sell and buy negotiations. Note: This indicator DOES NOT WORK for Brokers and/or Markets WITHOUT the type of aggression (BUY or SELL). Cryptocurrencies and Forex do not provide this type of data, that is, it does not work with them. O Delta Agrression Volume PRO has features that allow you to view beyond the delta volume of the day. Operation Multi symbols  (those who pro
    47 USD
    This indicator displays filtered price information in the form of three colored histograms and one common colored line. This is a very colorful and beautiful indicator. Great for determining the strength and direction of price movement. This indicator has very simple settings: 1) choice of three options for calculating the indicator: - original, - demarker, - balance volume. 2) selection of five different periods. 3) selection of the displayed color. 4) choice of accuracy. /////////////////////
    30 USD
    Pipfinite creates unique, high quality and affordable trading tools. Our tools may or may not work for you, so we strongly suggest to try the Demo Version for MT4 first. Please test the indicator prior to purchasing to determine if it works for you. We want your good reviews, so hurry up and test it for free...we hope you will find it useful. Combo Energy Beam with Swing Control Strategy: Confirm swing pullback signals Watch Video: (Click Here) Energy Beam with Trend Laser Strategy: Confirm Tr
    88 USD
    Predictor PRO MT5
    Evgenii Aksenov
    5 (1)
    A new generation progressive indicator from INFINITY. Predictor PRO uses its own entry and exit calculation strategy. Indicator without redrawing signals! This is very important for real trading. The indicator can be used for any currency pairs, metals, cryptocurrencies or indices. The best time of the H1 chart. Unlike other indicators, Predictor PRO shows shows the Buy/Sell entry point and the Close exit point. Calculating the profit of all signals in points on the panel helps to choose th
    49 USD
    This indicator provides an original mix of WPR, VSA, and volume delta. It shows ratio of buy/sell volumes scaled on 100% range based on total volume change for a selected period. The convetional VSA (Volume Spread Analysis) studies interconnections of price action and volume change in absolute values, whereas WPR (Williams Percent Range) offers a convenient approach of price moves normalization into the fixed percentage metric: 0 - 100%. Hence overbough and oversold states are easily spotted. N
    30 USD
    Your Trend Friend
    Luigi Nunes Labigalini
    The trend is your friend! Look at the color of the indicator and trade on that direction. It does not  repaint. After each candle is closed, that's the color of the trend. You can focus on shorter faster trends or major trends, just test what's most suitable for the symbol and timeframe you trade. Simply change the "Length" parameter and the indicator will automatically adapt. You can also change the color, thickness and style of the lines. Download and give it a try! There are big movements
    99 USD
    Buyers of this product also purchase
    Mentfx Mmanage mt5
    Anton Jere Calmes
    4.33 (6)
    The added video will showcase all functionality, effectiveness, and uses of the trade manager. Drag and Drop Trade Manager. Draw your entry and have the tool calculate the rest. Advanced targeting and close portions of a trade directly available in tool (manage trades while you sleep). Market order or limit order on either side with factored spread. Just draw the entry, the tool does the rest. Hotkey setup to make it simple. Draw where you want to enter, and the stop loss, the tool calculates al
    300 USD
    Unlimited Trade Copier Pro MT5 is a tool to copy trade remotely between multiple MT4/MT5 accounts at different computers/locations over internet. This is an ideal solution for signal provider, who want to share his trade with the others globally on his own rules. One provider can copy trades to multiple receivers and one receiver can get trade from multiple providers as well. The provider can even set the subscription expiry for each receiver, so that receiver will not be able to receive the sig
    299 USD
    YuClusters
    Yury Kulikov
    4.93 (42)
    Attention: You can view the program operation in the free version  YuClusters DEMO .  YuClusters is a professional market analysis system. The trader has unique opportunities to analyze the flow of orders, trade volumes, price movements using various charts, profiles, indicators, and graphical objects. YuClusters operates on data based on Time&Sales or ticks information, depending on what is available in the quotes of a financial instrument. YuClusters allows you to build graphs by combining da
    285 USD
    Mt5 bot for Binance Future (Expert) The system is running on Binance Future market. You can easily integrate it into your own code to automate operations. Manual operation panel is available. Hedge mod compatible. All operations can be done manually from the screen. It is the most effective way to control many cryptocurrencies at the same time. The screen is template type with binance screen. You can download the template file from the link. https://drive.google.com/file/d/1WHqGhy
    300 USD
    CAP RSI Trade EA MT4 trades using the RSI Indicator. It offers many customizable RSI trading scenarios and flexible position management settings, plus many useful features like customizable trading sessions, a martingale and inverse martingale mode.  Functions Easy to use and customizable RSI setting. Customizable indicator settings Built-in money management Grid trading when trade in Loss Customizable break-even, SL, TP and trailing-stop Filter trading by multiple forex sessions Built-in news
    299 USD
    FTMO Sniper 7
    Vyacheslav Izvarin
    Dedicated for FTMO and other Prop Firms Challenges 2020-2023 Trade only GOOD and checked PROP FIRMS  Default parameters for Challenge $100,000 Best results on GOLD and US100  Use any Time Frame Close all deals and Auto-trading  before  US HIGH NEWS, reopen 2 minutes after Close all deals and Auto-trading  before Weekend at 12:00 GMT+3  Friday Recommended time to trade 09:00-21:00 GMT+3 For Prop Firms MUST use special  Protector  https://www.mql5.com/en/market/product/94362 ------------------
    3 500 USD
    GRat Crypto
    Ivan Titov
    5 (1)
    Trade on crypto exchanges in MT5! GRat_Crypto is a tool for manual and automated trading , including ANY available EA, ANY  cryptocurrency  on most popular crypto exchanges in the familiar MT5 environment 24/7. Features 1. ALL instruments of the 5 most popular crypto exchanges are available: Binance , Bybit , Kraken , KuCoin and OKX . 2. The ability to place ANY type of order available in MT5, both market and pending, to modify orders and positions, to delete orders and close positions (even pa
    399 USD
    Oracle
    Denis Sotnikov
    5 (2)
    Эксперт - торговый помощник, созданный по одноимённой торговой стратегии Оракул в сотрудничестве с ее автором Нео. Определяет на графиках в автоматическом режиме разворотные импульсные модели и строит по ним Вилки Нео - авторский инструмент, позволяющий определять циклы движения цены и указывающий на ожидаемую цель TakeProfit . Поиск ведется на всех заданных периодах графиков одновременно с фильтрацией совпадений. Осуществляется фильтрация неверных Вилок с указанием кода ошибки. Утилита имеет
    299 USD
    Introduction   This trade copier for 'MT5 -> NinjaTrader NT8' consists of two parts: Trade signal transmit utility EA 'MT5ToNinjaTrader' as you will purchase here. Trade copier strategy app 'MTNT8Copier' at NinjaTrader NT8. > MetaQuotes Market demo *cannot* be used for utility/copier evaluation. If you need evaluation, please download the evaluation version "MT5ToNinjaTrader_Eval" (limited to USDJPY, BTUSD trades)  from comment section link here   User manual and NT8 Copier 'MTNT8Cop
    300 USD
    Hedge Ninja
    Robert Mathias Bernt Larsson
    Make sure to join our Discord community over at www.Robertsfx.com , you can also buy the EA at robertsfx.com WIN NO MATTER IN WHICH DIRECTION THE PRICE MOVES This robot wins no matter in which direction the price moves by following changing direction depending on in which direction price moves. This is the most free way of trading to this date. So you win no matter which direction it moves (when price moves to either of the red lines as seen on the screenshot, it wins with the profit target yo
    3 582 USD
    Latency arbitrage is a trading strategy that allows traders to make instant profits by acting fast on opportunities presented by pricing inefficiencies between two or more brokers: it entails trading against a lagging broker knowing the future price in advance, received from other price feed, fractions of a second earlier. These inefficiencies can be caused by liquidity providers or network issues on the broker's side. Under ideal trading conditions, latency arbitrage is a zero-risk strategy tha
    499 USD
    Fimathe Tool for Semi-Automatic Trading. This tool serves as a support for trading using the Fimathe strategy, the same one used by Trader Marcelo Ferreira in his negotiations. Features: Button to set/change Trend chosen by Trader. Adjustment of Buy Zone and Neutral Zone Level Lines. Adjustment of Sell Zone and Neutral Zone Level Lines Subcycle Levels, R1, R2, R3, R4 and S1, S2, S3, S4. Automatic Trailling Stop for previous level with each new (Subcycle) level reached. Trading stop at
    300 USD
    FiboPlusWaves MT5
    Sergey Malysh
    5 (1)
    FiboPlusWave Series products Ready-made trading system based on Elliott waves and Fibonacci retracement levels . It is simple and affordable. Display of the marking of Elliott waves (main or alternative option) on the chart. Construction of horizontal levels, support and resistance lines, a channel. Superposition of Fibonacci levels on waves 1, 3, 5, A Alert system (on-screen, E-Mail, Push notifications).    Features: without delving into the Elliott wave theory, you can immediately open one of
    875 USD
    Easy Strategy Builder 5
    Gheis Mohammadi
    5 (3)
    The  Easy Strategy Builder (ESB)  is a " Do It Yourself " solution that allows you to create a wide range of the automated trading strategies without any line of codes. This is the world’s easiest method to automate your strategies that can be used in STP, ECN and FIFO brokers. No drag and drop is needed. Just by set conditions of your trading strategy and change settings on desired values and let it work in your account. ESB has hundreds of modules to define unlimited possibilities of strategi
    299 USD
    Live Forex Signals is designed for trading on site signals   https://live-forex-signals.com/en and  https://foresignal.com/en . Live Forex Signal for MetaTrader 4   https://www.mql5.com/en/market/product/81445 Parameters Username   and   Password   if you have a subscription to the sites live-forex-signals.com/foresignal.com , then you should fill in these parameters with your credentials; if there is no subscription, then leave the fields empty; Comment   comment on the deals being opened Ri
    360 USD
    Trading Chaos Expert
    Gennadiy Stanilevych
    5 (10)
    This software has no equals in the world and represents a universal trade "console" covering trading signals, automated market entry, setting of Stop Loss and Take Profit, as well as Trailing Profit for multiple trades at the same time in a single open window. Intuitive control of the Expert Advisor in "three clicks" ensures a comprehensive use of all its functions on different computers, including tablets PCs. Interacting with additional signal indicators that mark the chart to give a real mark
    995 USD
    News Trader Pro is a unique robot that allows you to trade the news by your predefined strategy. It loads every piece of news from several popular Forex websites. You can choose any news and preset the strategy to trade it, and then News Trader Pro will trade that news by selected strategy automatically when the news comes. News release gives opportunity to have pips since the price usually has big move at that time. Now, with this tool, trading news becomes easier, more flexible and more exciti
    299 USD
    If you wish to draw Support and Resistance lines, view: daily market opening, classical pivot levels, Fibonacci pivot levels, trend lines, Fibonacci levels, the remaining time to candle closing, and current spread. If you seek to place your orders with the exact lot that meets your desired stop loss risk. If you wish to do all this and more with just one click, then this is the perfect tool to use. This tool will allow you to feel more relaxed when deciding to open orders, as well as predicting
    300 USD
    The new version of  MirrorSoftware 2021  has been completely rewriten and optimized.  This version requires to be loaded only on a single chart because  it can detect all actions on every symbol and not only the actions of symbol where it is loaded. Even the  graphics and the configuration mode  have been completely redesigned. The MirrorSoftware is composed of two components (all components are required to work):  MirrorController  (free indicator): This component must be loaded into the MAST
    399 USD
    1. Record the price data for each Tick transaction. Data file contents: "Tick time", "ASK price", "BID price", "SPREAD SPREAD", "Tick quoted quantity". 2. Meanwhile, generate a quotation data file with a 1-minute period. Content of 1min data file: "ASK time", "ASK OPEN price", "ASK HIGH price", "ASK LOW price", "ASK CLOSE price", "BID time", "BID OPEN price", "BID HIGH price", "BID LOW price", "BID CLOSE price", "Tick quoted quantity". 3. Save all quotation data in one file every day, which is c
    384 USD
    Mt5BridgeBinary
    Leandro Sanchez Marino
    I automated its commercial strategies for use of binary in MT5 and with our Mt5BridgeBinary I sent the orders to its Binary account and I list: begin to operate this way of easy! The expert advisers are easy to form, to optimize and to realize hardiness tests; also in the test we can project its long-term profitability, that's why we have created Mt5BridgeBinary to connect its best strategies to Binary. Characteristics: - It can use so many strategies as I wished. (Expert Advisor). - He doe
    2 000 USD
    Xrade EA
    Yao Maxime Kayi
    Xrade EA is an expert advisor as technical indicator. For short period trade it's the best for next previsions of the trend of the market. +--------------------------------------------------------------------------------------- Very Important Our robot(data anylizer) does'nt take a trade procedure. If using only our robot you must take positions by yoursels +--------------------------------------------------------------------------------------- The technical indiator provide for a give
    930 USD
    This EA connects to MyTradingPet.com for top performing live trade signals backed by latest AI technologies. The past performance data is available from MyTradingPet.com. All future enhancements to these AI signals will be automatically loaded into this EA. One time setup and no tweaking is required along the way. You can choose top 1-3 performing signals over 1 week or 1 month or 3 months. The EA program will automatically refresh top performers based on daily performance statistics. No furthe
    1 999 USD
    The EA monitors positions for selected pairs, sets a break-even level and moves a trailing stop. When the trade is "n" points of profit (parameter dist_BEP), the stop loss is moved to the break-even point (the level of the trade opening price) plus the specified distance in points (parameter BEP) The EA checks all available (or filtered) trades for break-even and moves stop-loss levels if necessary. The EA also checks all available (or filtered) trades for trailing stop conditions and, if neces
    1 999 USD
    News: IDEA 2.0 is out with lot of features, like telegram bot notifications and Limits order! Check the changelog at bottom of page (*). Hi all, here you can find my Expert Advisor, called IDEA  (Intelligent Detection & managEr Algorithm) . In short, with this software you can: Have   a clear view of market status , with an indication of current trend. Simply add symbols you want to monitor to your market watch, and IDEA will notify you if some of them are in trend; Have an   automatic lots
    500 USD
    Fast API Copier
    Konstantin Stratigenas
    4 (1)
    This EA Connects Trading-Systems or Terminals on a Windows Server (VPS). You can also use it as a Trade Copier Local or Remote. Fast and stable Solution with 10ms Reaction Time. Make sure you have one of this: It works on VPS which allows to Run it as a Webserver (fixed IP Address and open Port 80 for Incoming Connections). It works on your own Datacenter / Computer with fixed IP or DNS. Installation Download and Install Visual Studio 2019  on your Windows Server.  Choose "ASP.NET and web Deve
    280 USD
    SystemLiveMxPips
    Harold Alonso Hernandez
    Automatice sus estrategias comerciales con nuestra sencilla herramienta de creación de estrategias "similar a un rompecabezas".   Cree fácilmente estrategias que operen por usted en modo de piloto automático.   También puede cargar estrategias creadas por otras personas, como la clásica   Estrategia Martingala,   para usarla como muestra para su propia estrategia. Características clave Cree su estrategia a través de funciones simples de arrastrar y soltar, sin necesidad de conocimientos de pr
    300 USD
    Binance Full Trader is developed for connection to your Binance account and get data, draw price charts and trade easily with any strategy by an indicator. A user-friendly interface has developed for it and has tried to give access to the necessary information such as open orders and wallet balances. ·        There are two sample indicators (one for trade signal and another for price) that you can download it from these links: https://drive.google.com/file/d/1w2CGuu3rArWKMhS9LkepT9zhVkGR1AO7/vie
    350 USD
    MT5 Strategy Builder ('StratBuilder')   is a grid-trading order management utility which runs on the MT5 platform.   This product is also available on the MT4 platform:       https://www.mql5.com/en/market/product/15328 It is strongly suggested that a virtual private server (VPS) be rented , to allow StratBuilder to run 24/7. The unique StratBuilder   concept:   A basket of trades is opened at predetermined price levels (ring-fenced per symbol and trading direction) and profit taking occurs wh
    340 USD
    As add-on to our professional divergence indicators we also created superb divergence scanners. These scanners give an overview of the different timeframes of the selected instruments and can save your tons of time. You can instantly see which instrument has a divergence on which timeframe. So no need to run through the charts manually anymore searching for good setups, with this scanner you see the whole market and you know where to look for a good trade opportunity. Even when you are not in fr
    295 USD
    More from author
    ClusterSecondForex
    Rafil Nurmukhametov
    4.67 (3)
    The utility allows you to build different types of graphs: Seconds chart from 1 second to 86400 seconds Tick chart from 1 tick and above The volume chart Delta chart Renko chart Range chart Product demo https://www.mql5.com/ru/channels/clustersecondforex Built-in indicators for volumetric analysis: daily market profile and market profile of the selected timeframe, Cluster Search Imbalance VWAP Dynamic POC, VAH, VAL the profile depth of the market vertical volume with various display options, del
    170 USD
    BuySellBar
    Rafil Nurmukhametov
    Indicator of the colour display of the zones of buyers and sellers in the bar with a change of colour as the volume increases. From bar maximum to bar closing - this is the sellers' zone. From bar closing to bar minimum - this is the buyers area. As the bar volume increases in comparison to the previous bar, the respective zones are coloured in a different colour. Input parameters volumes  (tick or real)
    30 USD
    SmartTape
    Rafil Nurmukhametov
    Smart Tape - это индикатор ленты всех сделок с возможностью агрегации по цене и времени и фильтрацией по величине объема, включает в себя два отключаемых варианта отображения. Вариант 1: перемещаемое окно по графику со списком сделок (Time Sales).  Список обновляется сверху вниз и не имеет возможности просмотра истории. Количество отображаемых строк                   выбирается пользователем. Порядок отображения в строке: время с точностью до миллисекунд,  тип сделки (B - покупка или S - продажа
    50 USD
    Filter:
    saiberia
    21
    saiberia 2023.12.03 14:22 
     

    Здравствуйте. Сразу видно работа выполнена мастером своего дела, в ней нет мелочей, которые бы остались без внимания, все четко и со вкусом. Когда такая вещь попадает в руки это всегда праздник. Большое вам спасибо, торговать одно удовольствие.

    taka
    22
    taka 2023.04.27 13:21 
     

    I used the demo version for a while and then decided to purchase it. Thank you for the wonderful indicator. It has the functions I need to make profits.

    seudry
    133
    seudry 2022.10.14 19:49 
     

    I bought the 2 versions (forex and classic) several months ago. What more can be said ? Execution work high quality considering the price......................... I know the designer has nothing to add because it's perfect. However, perfection does not exist except in mathematics. I put 4 stars. I will put 5 or even 12 if the designer adds classic indicators such as RSI, etc..., I will be able to pay double for this fabulous work if that were the case when it "costs nothing to integrate". Another well-deserved thank you to Rafil.

    Alex Solo
    26
    Alex Solo 2022.02.18 00:46 
     

    Купил продукт давно, но пользоваться оказалось невозможно - советник ЖЕСТКО грузит процессор (i7 уходит выше 90% нагрузки) если одновременно открыть более 10-15 графиков. Все тормозит до такой степени что даже анализ не возможен, не говоря уже о торговле. Для сравнения: недавно купил таже SBProX и TigerTrade - оба продукта загружены ОДНОВРЕМЕННО и на каждом по 100-120 окон грузят процессор на 20-30% (т.е. около 200-250 окон в сумме). Если вам нуже 1-2-3 графика с футпринтом - этот продукт может быть хорошим решением. Если же вам нужен хоть немного приличный анализ коррелируемых инструментов и больше 10 графиков - посмтотрите другие решения.

    Andrzej Maksecki
    28
    Andrzej Maksecki 2021.12.28 12:09 
     

    Пользовался демо год. Купил полную версию. Очень доволен. Все информативно, без глюков работает. Восемь окон открыто с утилитой СS. Четыре РТС и 4 окна Брент, разные таймы, футпринт и кластера. Все работает четко без глюков на 6 Гб оперативки. Да и еще параллельно второй терминал MT5 c АМР запучен, тоже с утилитой, там Сиплый и золото. Проц i3 2700 Мгц .

    konst37
    30
    konst37 2021.07.16 18:10 
     

    хорошая программа, у меня только проблема с разрешением на 4к, очень мелко при стандартных настройках экрана, на все свои вопросы сразу получил ответы от разработчика

    DoctorGonza
    41
    DoctorGonza 2021.04.19 09:33 
     

    супер - стоит каждого цента...

    Holden81
    19
    Holden81 2020.12.17 17:23 
     

    Шикарно!

    Denis B
    23
    Denis B 2020.11.17 12:29 
     

    Прекрасная замена всем дорогостоящим терминалам, всё продумано до мелочей, типы графиков на любой вкус и потребность, выставление ордеров с графика и торговой панели и много прочих полезных фич. Рафиль, спасибо за отличную работу!

    trade4k.ru
    23
    trade4k.ru 2020.11.16 09:54 
     

    Могу поставить только 5+

    Антон Привольнов
    23
    Антон Привольнов 2020.10.16 08:56 
     

    отличный советник, просто бомба и за такие деньги. купил сразу бессрочную версию.

    Vasiliy Kolesov
    3801
    Vasiliy Kolesov 2020.09.15 22:32 
     

    User didn't leave any comment to the rating

    asmel158
    34
    asmel158 2020.08.17 09:15 
     

    Отличная замена дорогостоящим платформам! Автор - профессор своего дела!

    Jestem
    41
    Jestem 2020.08.02 18:41 
     

    Твердая 5! После покупки прошел месяц. Доволен. Долго искал замену волфиксу, перепробовал много платформ. Мт5 + КластерСеконд закрыли все потребности. Кайфую от пользования программой - удобство рисования, работы с ордерами, работа с графиками... все продумано. Огромная благодарность автору!

    Cepera_T
    50
    Cepera_T 2020.07.28 21:49 
     

    Маркет Дельта, SBpro и прочее мне теперь не нужны! Все гениальное просто, функционал для меня более чем достаточный, благодарю автора! Шикарная примочка к МТ5!

    alphajam
    61
    alphajam 2020.07.26 17:40 
     

    Рафиль, прекрасный продукт, после MT5 это отдых для глаз (у меня по-другому воспринимается график), это максимальное удобство торговой панели, это максимальный функционал! Спасибо!

    moneytalks24
    31
    moneytalks24 2020.07.24 12:31 
     

    Высшая утилита! Просто огонь! Рекомендую всем!!!

    trilobyte (Макс)
    92
    trilobyte (Макс) 2020.07.23 06:04 
     

    День добрый! Рафиль, принимай благодарность, за продукт! Радует, что продукт развивается, достаточно быстро добавляется/улучшается функционал (тьфутьфутьфу чтоб не сглазить), что не может оставить пользователей равнодушными. Каждый найдет те примочки, о которых пишут и показывают в разных софтах. Вопросы не остаются без ответов! Ребят, кто еще думает - не пожалеете! (сам посмотрел, и сразу взял). Своих разработчиков давайте поддерживать! Пожелаю дальнейшего развития, Рафилю здоровья и успехов, будем продолжать дружить!

    Александр Старицын
    25
     

    Данная утилита выводит терминал МТ5 на уровень профессионального софта. В ней воплощены все передовые наработки объемного анализа. Разработчик, являясь опытным трейдером, взял все самое нужное и сделал это удобным в использовании. Достигнута очень высокая степень визуализации рыночного процесса. Торговать с ее помощью одно удовольствие!!

    dorit
    608
    dorit 2020.07.13 17:04 
     

    Хочу отметить положительное обстоятельство. Автор утилиты незамедлительно откликается на любой вопрос, возникающий у пользователя. По характеристикам данный продукт полностью отвечает эксплуатационным требованиям. Выражаю автору благодарность за добротную разработку.

    123
    Reply to review
    Version 7.6 2021.08.04
    1. Bug with order and position management fixed
    Version 7.5 2021.02.02
    1. Fixed a bug that causes loss of mouse control
    Version 7.4 2021.01.25
    1. Fixed the error of not refreshing the indicators of the high timeframe
    Version 7.3 2021.01.25
    1. Fixed bug of array overrun when disabling data retrieval from market depth
    Version 7.2 2021.01.21
    1. Fixed an error with order opening on CME
    Version 7.1 2020.11.16
    1. Fixed work with the limit take
    Version 7.0 2020.11.12
    1. Added the ability to set a take with a limit order, the setting is located in the Trade tab
    2. Added the ability to paint over all boxes of the senior half
    3. Fixed a bug associated with setting up a clustered graph
    Version 6.9 2020.10.21
    1. Improved the function of order setting from the chart
    Version 6.8 2020.08.26
    1. Fixed nonpreservation of the value zone color in the stretched profile.
    2. Added the "Magnifier" tool to turn on/off, press the mouse wheel button in the graphics area, or press the ESC key on your keyboard.
    Version 6.7 2020.08.19
    1. Fix out of bounds array
    2. Saving screen zoom settings when restarting the terminal
    3. Added the ability to show / remove the price line for established orders and positions
    Version 6.6 2020.08.06
    1. Fixed display of vertical fibo levels
    Version 6.5 2020.08.05
    1. Fixed buggies with drawing trend lines
    2. Added vertical fibo levels in individual settings
    Version 6.4 2020.07.29
    1. Fixed buggies with drawing trend lines and Fibo
    Version 6.3 2020.07.26
    1. The algorithm and format of drawing of all lines have been changed, in this connection line building in previous versions will not be displayed in the current version
    Version 6.2 2020.07.21
    1. Changed the display borders of the stretched profile to allow displaying the market profile in a single bar
    2. Changed the display pole of the current time frame, the pole is drawn on the closing level of the bar is level pole
    3. Added a shift of the displayed pole of the higher timeframe, located in the settings
    4. Added timeframe in the shape of a frame period timeframe corresponds to the period of the pole timeframe inclusion on the chart through the icon with the letter C, enter the settings right click the mouse on the icon
    5. Added overlay line graph to a chart in the form of bars
    6. Added coloration of a candle body with the growth of volume in this candle
    7. Added keyboard shortcuts for displaying the Cluster Search indicator (A - enable / disable by volume, S-enable / disable by Delta, D-enable / disable by ascbid
    Version 6.1 2020.07.14
    1. Fixed centering by price in footprint display mode
    Version 6.0 2020.06.29
    1. Added option of simultaneous display of delta and volume in footprint
    2. Fixed errors in footprint drawing when price step was changed.
    3. Fixed repainting of the ImBalance indicator in a footprint at the changed price step.
    4. Added saving of price step change in the template
    Version 5.9 2020.06.15
    1. Fixed color display of orders and positions on the price scale
    Version 5.8 2020.06.08
    1. fixed saving the function of highlighting bars to the volume color in the template when the volume exceeds the previous bar
    Version 5.7 2020.06.07
    1. the Delta indicator has added a display option in the form of a histogram of ask and bids.
    2. Added: if the volume in the bar is exceeded in comparison with the previous bar, the bar or candle contour is highlighted with the color of the volume indicator.
    3. Added the ability to draw and display lines only in the current window
    Version 5.6 2020.06.03
    1. fixed a division by zero error in the drawing function
    Version 5.5 2020.06.02
    1. Fixed a bug with the build of bars in the history and online
    Version 5.4 2020.05.27
    1. Fixed a bug resulting in data overrun in the candle.
    Version 5.3 2020.05.11
    1. Fixed display of maximum deltas when you change the step size in footprint
    Version 5.2 2020.05.11
    1. Added a price step for clusters and footprints.
    Version 5.1 2020.04.20
    1. Аdded a cumulative Delta in the Delta indicator. Summation occurs for the period of the loaded history.
    2. Changed the calculation for ticks in the settings for building range and Renko bars.
    3. Аdded the ability to disable text under the profile frame In the stretched market profile.
    4. Added a countdown to the closing of the bar, depending on the selected type of chart shows the time, ticks, volume, Delta or number of ticks.
    Version 5.0 2020.03.13
    1. Fixed scaling by price
    Version 4.9 2020.03.12
    1. Fixed an error when typing the template name
    2. Removed duplication of Fibo levels for all Windows with the same tool
    3. When the "prevent the current price from going out of the window up and down" icon is enabled, a sharp return of the price to the visible area of the window by a certain amount is introduced
    Version 4.8 2020.03.05
    1. Added the Fibonacci levels .
    2. Added hotkeys for on / off displaying the profile of the higher timeframe and the daily timeframe, Q and W, respectively.
    3. Fixed the display of the file name in the template, resulting in duplicate extensions ."OI" for instruments of the Russian market with open interest.
    Version 4.7 2020.02.15
    1. Added line to open the day
    2. The error of the formation of bars in the tick chart is fixed
    Version 4.6 2020.02.10
    1. Added Dynamic POC indicator for the daily timeframe and the selected higher timeframe
    2. Added VWAP indicator of the daily timeframe and the selected higher timeframe
    3. The error of not saving current orders and positions in the display template has been fixed
    Version 4.5 2020.02.05
    1. Added: in the Templates tab of the main settings menu, when you select from the list of downloaded templates, the file name is copied to the line to save the template
    Version 4.4 2020.02.04
    1. The error of placing a pending order at the best price from the trading panel is fixed
    Version 4.3 2020.02.04
    1. Fixed bug with moving stop loss for pending sell orders
    2. Added to the line measurement in percent
    Version 4.2 2020.01.29
    1. Fixed errors in the settings of the footprint and the ClusterSearch indicator
    2. Added the ability to draw trend lines and rectangles on top of the chart
    3. In templates, checking for the presence of a file in the list of saved templates with the entered name is added
    4. Added setting stop loss and take profit for pending orders in the absence of a position
    Version 4.1 2020.01.26
    1. Fixed a color error displaying the outline of the icons.
    2. The static color of highlighting the pressed icons is changed to dynamic.
    Version 4.0 2020.01.25
    1. Fixed a division by zero error in ClusterSearch indicator settings
    Version 3.9 2020.01.25
    1. Fix for not clicking on new icons
    Version 3.8 2020.01.25
    1. Added indicator icons: the pole, the pole of the higher timeframe and circles that draw at the closing level of the bar with the peak volume
    Version 3.7 2020.01.24
    1. Completely changed the graphical interface.
    2. Added indicators: the profile of the current day and previous, the profile of the selected timeframe, ClusterSearch, ImBalance, the pole of the higher timeframe.
    3. Improved work with templates.
    4. Disabled display of orders and positions, the ability to disable trading from the chart
    Version 3.6 2019.12.12
    1. Fixed a bug that caused the utility to be removed when the terminal was rebooted
    Version 3.5 2019.12.09
    1. Removed the ID entered in the EA settings.
    Version 3.4 2019.12.07
    1. Fixed incorrect drawing of the chart on the Euro
    2. Increased the thickness of the lines VAH and VAL in the drawn market profile
    Version 3.3 2019.09.28
    1. Fixed a bug in displaying the number of orders
    Version 3.2 2019.09.09
    1. Fixed bug with load more after the weekend.
    Version 3.1 2019.07.27
    1. Fixed an error when drawing trend lines outside the array
    Version 3.0 2019.07.07
    1. Fixed a bug when displaying the daily timeframe
    2. Added an icon for the ability to move the chart vertically, relevant for footprints
    3. Added display of the value area in market profile
    Version 2.7 2018.11.01
    1. Устранены некоторые ошибки
    Version 2.6 2018.10.26
    1. В индикаторе отображающем закрытие бара с пиковым объемом в виде кругов изменен вариант отображения, с монотонного на градиентное.
    2. Изменены звуки на торговые операции.
    3. Устранены некоторые ошибки в логике программы.
    Version 2.5 2018.10.23
    1. Исправлена ошибка по работе с ордерами
    Version 2.4 2018.10.21
    1. Добавлена торговая панель
    2. Добавлены автоматически сохраняемые шаблоны
    Version 2.3 2018.10.19
    1. Исправлена ошибка отоборажения отложенных ордеров
    Version 2.2 2018.10.19
    1. Исправлены некоторые ошибки.
    2. Добавлена линия продолжения при отображении ордеров на графике
    Version 2.1 2018.10.15
    1. Добавлены графические построения, трендовые линии, прямоугольники, вертикальные.
    2. В профиле рынка добавлено цифровое отображение дельты
    3. Расширен диапазон построения графиков, теперь, кроме секундных, можно построить график тиков, график по объему или по дельте, ренко или рендж.
    4. В управлении графиком добавлены двойной клик, правая клавиша и колесико мышки
    5. Добавлен индикатор полюс
    6. В индикаторе объема есть возможность отображения цвета градиентом в зависимости от дельты бара
    7. Добавлена возможность выбора толщины баров
    8. В свечах и барах доступно отображение РОСа
    Version 2.0 2018.03.02
    1. Reading the Open Interest values from a saved file.
    2. Improved the function for plotting the Market Profile.
    Version 1.9 2017.11.24
    1. Added display of Open, Close, High and Low prices for the bar when hovering a cursor over it.
    2. Fixed display of bars when narrowing the window.
    Version 1.8 2017.10.23
    1. Added the option to display the open interest, similar to displaying the values of the delta indicator.
    2. Fix error - array out of range.
    Version 1.7 2017.09.29
    1. Added an option for highlighting a candlestick with a contrasting volume, using a circle, filtering by a threshold value.
    2. Added an option for drawing the market profile in the visual part of the screen.
    3. Added an option for hiding the current price line.
    4. Added an option for drawing the current price label on a chart.
    5. Added an option for showing the local computer time on the price chart.
    Version 1.6 2017.09.20
    1. Fixed an error that occurred in the "bar color settings" menu.
    2. Added the ability to display the current day's High and Low as lines.
    3. Added 3 filters in the display of vertical volumes. The filtered bars in the volume and on the chart are "highlighted" in the specified color. When displayed in the candlestick chart, clusters or footprint, only the volumes are "highlighted".
    4. Added the ability to increase the indentation of the displayed orders and positions from the price scale.
    Version 1.5 2017.09.15
    1. Added the ability to automatically set the stop loss and take profit values for the open position.
    2. Added the Open Interest indicator. Attention!!! Not all brokers broadcast the data on open interest.
    3. Added the ability to disable the reception of quotes for the Depth of Market (Level II) event.
    Version 1.4 2017.09.05
    1. Added Delta indicator disaplying delta values as a histogram in a separate window
    2. Added Candle indicator displaying candles in a separate window
    3. Added ability to reverse a position from the chart
    Version 1.3 2017.08.02
    1. Added the ability to display the trade history on the chart
    2. Added vertical and horizontal lines (grid)
    3. Added a setting for the default number of bars ("the number of displayed bars" input parameter)
    Version 1.2 2017.06.30
    Added the ability to trade directly from the chart
    Buy_Limit - in the price chart area, press Ctrl + left mouse button below the current price
    Sell_Limit - in the price chart area, press Ctrl + left mouse button above the current price
    Buy_Stop - in the price chart area, press Shift + left mouse button above the current price
    Sell_Stop - in the price chart area, press Shift + left mouse button below the current price
    Buy_Market - in the area between the chart and scale, press Shift + left mouse button above the current price
    Sell_Market - in the area between the chart and scale, press Shift + left mouse button below the current price
    Version 1.1 2017.05.29
    1. Added an icon for disabling cursor lines
    2. Introduced additional settings in the bar color change menu
    3. Added filters based on the volume and delta in the footprint display
    4. Added the DOM (Depth of Market) indicator
    5. Changed the display color if the current timeframe when used with a black background