Cross Timeframe Confluence Indicator
- Indicators
- Version: 1.0
- Activations: 5

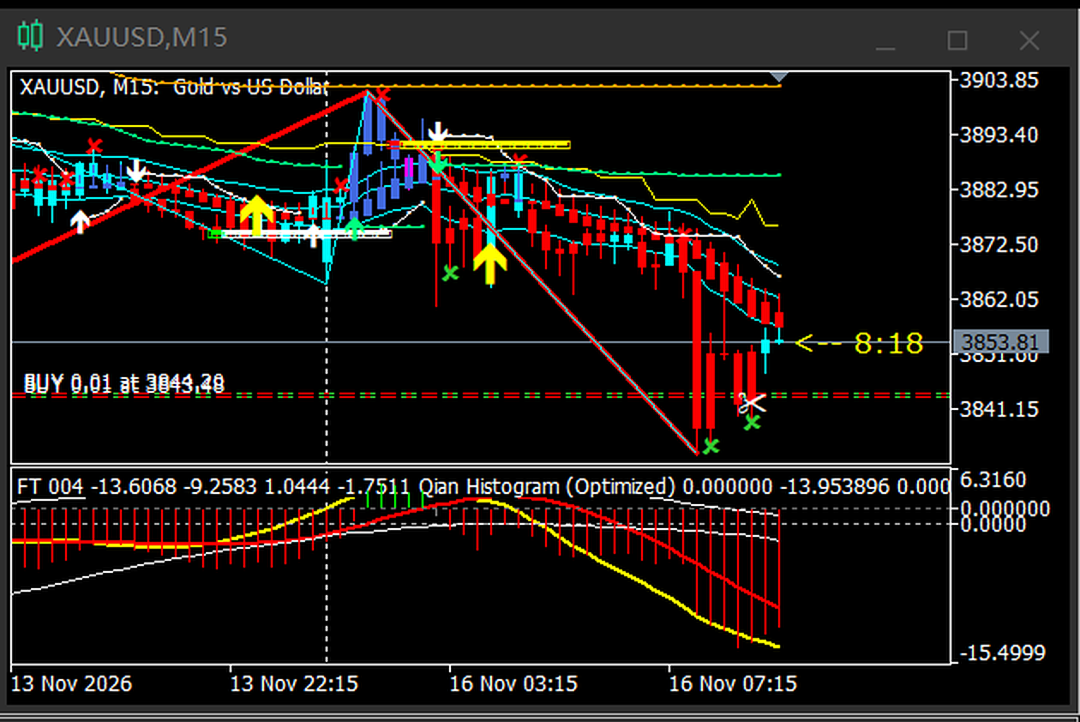
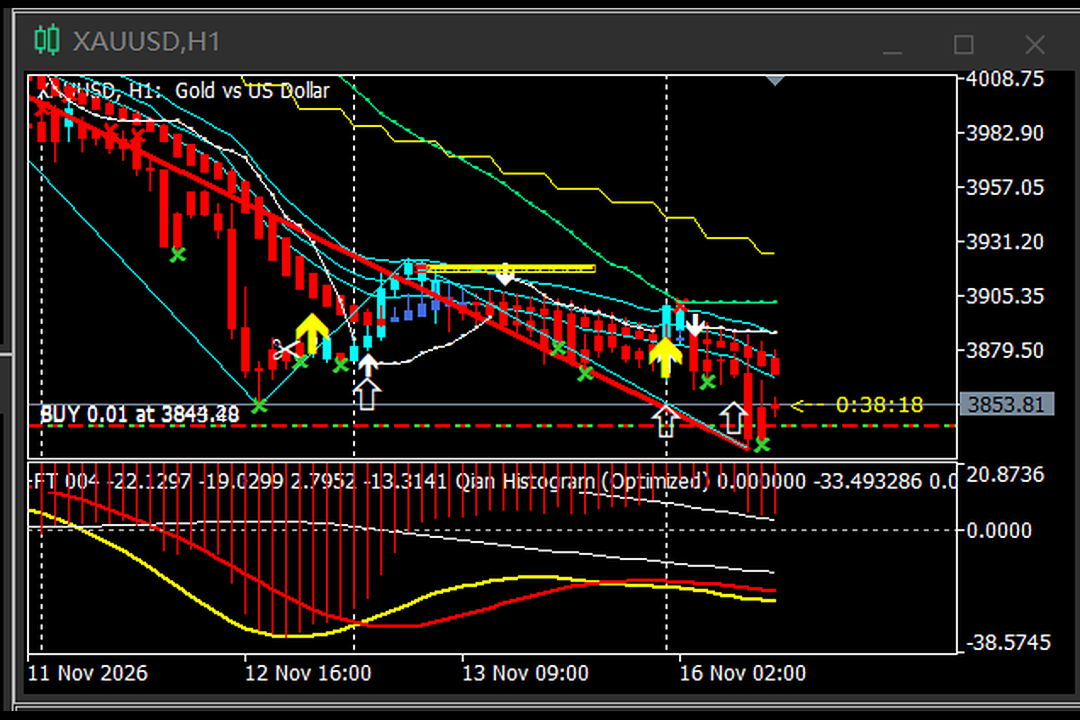
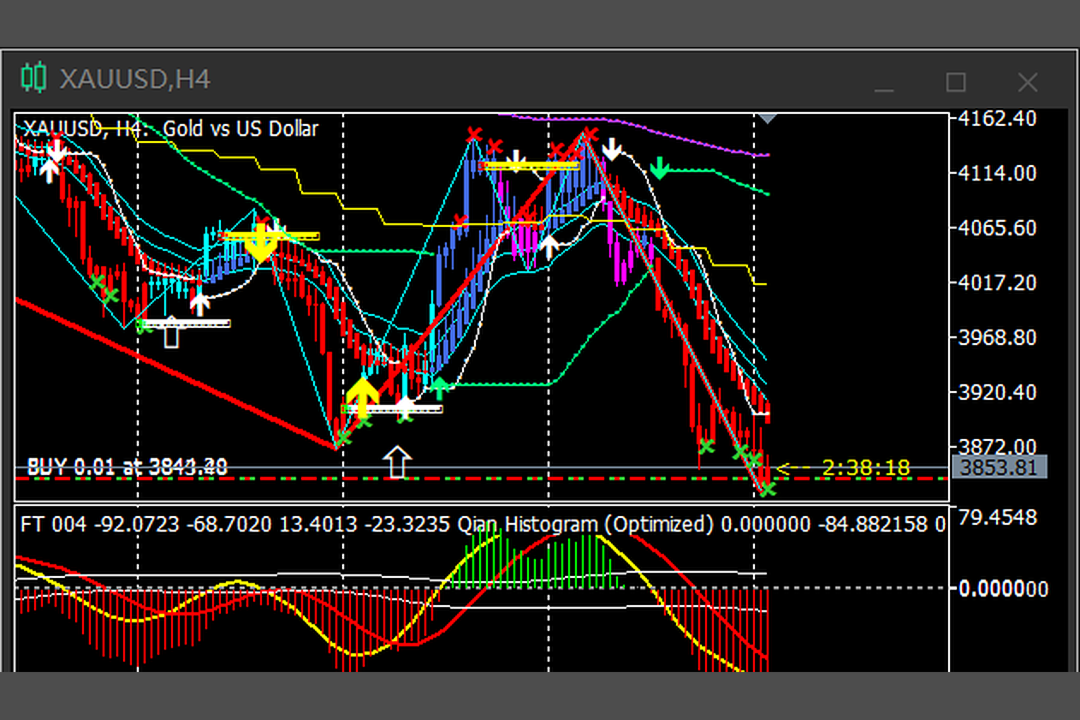
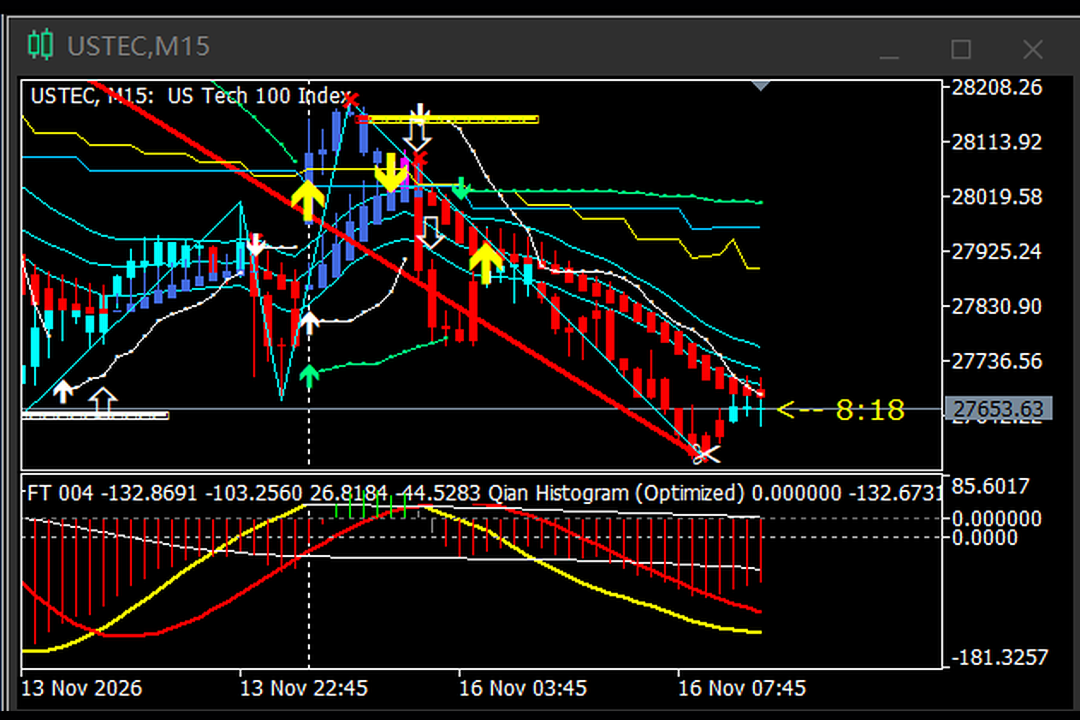
Cross Timeframe Confluence System (MTS) is a signal indicator for a single chart. It reads two CCI lines on your working timeframe and paints an arrow only when momentum has just turned and price is standing at a higher-timeframe level at the same moment.
WHAT THE ARROW REQUIRES
Four conditions must hold on the same bar before anything is drawn:
1. Momentum gate - CCI(7) crosses the zero line (up for a buy, down for a sell). 2. Structure gate - a golden or dead cross between CCI(7) and CCI(50) occurred within the last 5 bars. 3. Extreme gate - CCI(7) reached an extreme reading within the last 10 bars. The threshold adapts to the chart period: 40 on M1, 50 on M5, 80 on M15, 100 on H1 and above. 4. Location gate - price touches a higher-timeframe level: the lower band of a 34-period Bollinger Bands on a higher timeframe for buys, its upper band for sells, or the 11-period smoothed moving average (SMMA) of that higher timeframe. Touching either one is enough.
AUTOMATIC TIMEFRAME MAPPING
Nothing needs to be configured. The indicator assigns the mapping from the chart it is attached to:
- M1 chart: Bollinger from M5, SMMA from M15 - M5 chart: Bollinger from M15, SMMA from H1 - M15 chart: Bollinger from H1, SMMA from H4 - H1 chart: Bollinger from H4, SMMA from D1 - Any other period: both levels are taken from the chart's own period
This is the part that gives the tool its name: the level price is held against always sits one or two steps above the chart you trade from.
WHY THE ARROWS ARE RARE
The four gates are deliberately narrow. A zero-line cross on its own marks nothing; it must be followed by a real cross of the two CCI lines and preceded by an extreme reading. The location gate then removes every case where that cross happens in the middle of nowhere. What remains is the situation this tool was built for: momentum just turned, and the turn happened on a higher-timeframe band or mid-line. On quiet ranges most charts will show nothing for days, and that is the intended behaviour.
INPUTS
- ToleranceA_Points - how many points price may stay away from the Bollinger band and still count as a touch. 0 means exact. - ToleranceB_Points - the same tolerance for the SMMA mid-line. - ArrowOffsetPoints - distance between the arrow and the bar, in points. - InpExtremeLevel - the extreme threshold. 0 keeps the automatic per-period values. - EnableAlert - pop-up alert and sound when an arrow is confirmed on a closed bar.
INSTALLATION
1. Copy the EX5 into MQL5\Indicators, then restart the terminal or refresh the Navigator. 2. Drag it onto the chart you actually trade. The indicator draws in the chart window only; nothing else is added. 3. Set the tolerances. On gold and indices 0 usually works; on pairs with wide spreads a tolerance of 10 to 30 points avoids missed touches caused by spread-widened candles.
HOW IT IS MEANT TO BE USED
The arrow is an entry trigger, not a complete system. The usual sequence is:
- Direction is decided by the trader on the higher timeframes first. This indicator does not draw trend lines, does not colour candles and does not tell you the trend. - When an arrow appears in the direction you already expect, it marks the moment momentum turned while price was at a higher-timeframe band or mid-line. - Position size, stop loss and exits remain the trader's decision. The indicator places no orders, manages no positions and shows no take-profit levels.
WHAT IT DOES NOT DO
- It does not project higher-timeframe lines onto your chart. It reads those levels internally and compares price against them. - It does not paint smoothed Heikin-Ashi candles, coloured CCI candles or a corner dashboard. - It does not show spread, countdowns, profit targets or trailing stops. - It is not an Expert Advisor and cannot trade. - It contains no DLL, no time limit and no account limitation.
ATTACHING AND REMOVING
Arrows are chart objects prefixed CCI_Signal_. They are removed when the indicator is removed or when the period is recalculated, so the chart does not fill up over time.
SUPPORT
Questions and bug reports go through the MQL5 message system. Include symbol, timeframe and a screenshot; most answers within one working day.
RISK DISCLOSURE
Signals describe past price behaviour. They do not predict the future and carry no guarantee of profit. Trading leveraged instruments involves substantial risk of loss. Test on a demo account before any live use.