Chart Pattern Probability
- Indicators
- Version: 1.0

A free chart-pattern indicator for MetaTrader 5 that tells you the truth about each pattern: how often it really reached 1R and 2R on your symbol and timeframe, next to what a random entry with the same stop did.
Most pattern indicators only draw arrows. This one measures them. Every signal shows its historical win % and the "random %" for the same direction and stop size, so you can see at once whether a pattern has an edge on the chart you trade - or not.
The indicator does not open or close trades. Signals use closed candles only and do not repaint.
WHO IS IT FOR
- Traders who trade chart patterns: you can trade the signals of this indicator - with discipline, a fixed risk per trade, and attention to the market context (trend, news, session). The win % tells you which patterns deserve your attention on your market and which to skip.
- Traders who want to check before they trust: test a pattern on your symbol and timeframe in seconds instead of months.
- Learning: a training tool to recognise chart patterns. Every pattern is drawn with its outline, breakout line, entry, stop and targets, and older signals show if they worked. Scroll back through the history to train your eye and to see how often a "textbook" pattern really works.
PATTERNS
- Rectangle (range breakout)
- Head and Shoulders and Inverse Head and Shoulders
- Double top and Double bottom
- Ascending, Descending and Symmetric triangle
Each pattern can be switched on or off.
WHAT YOU SEE
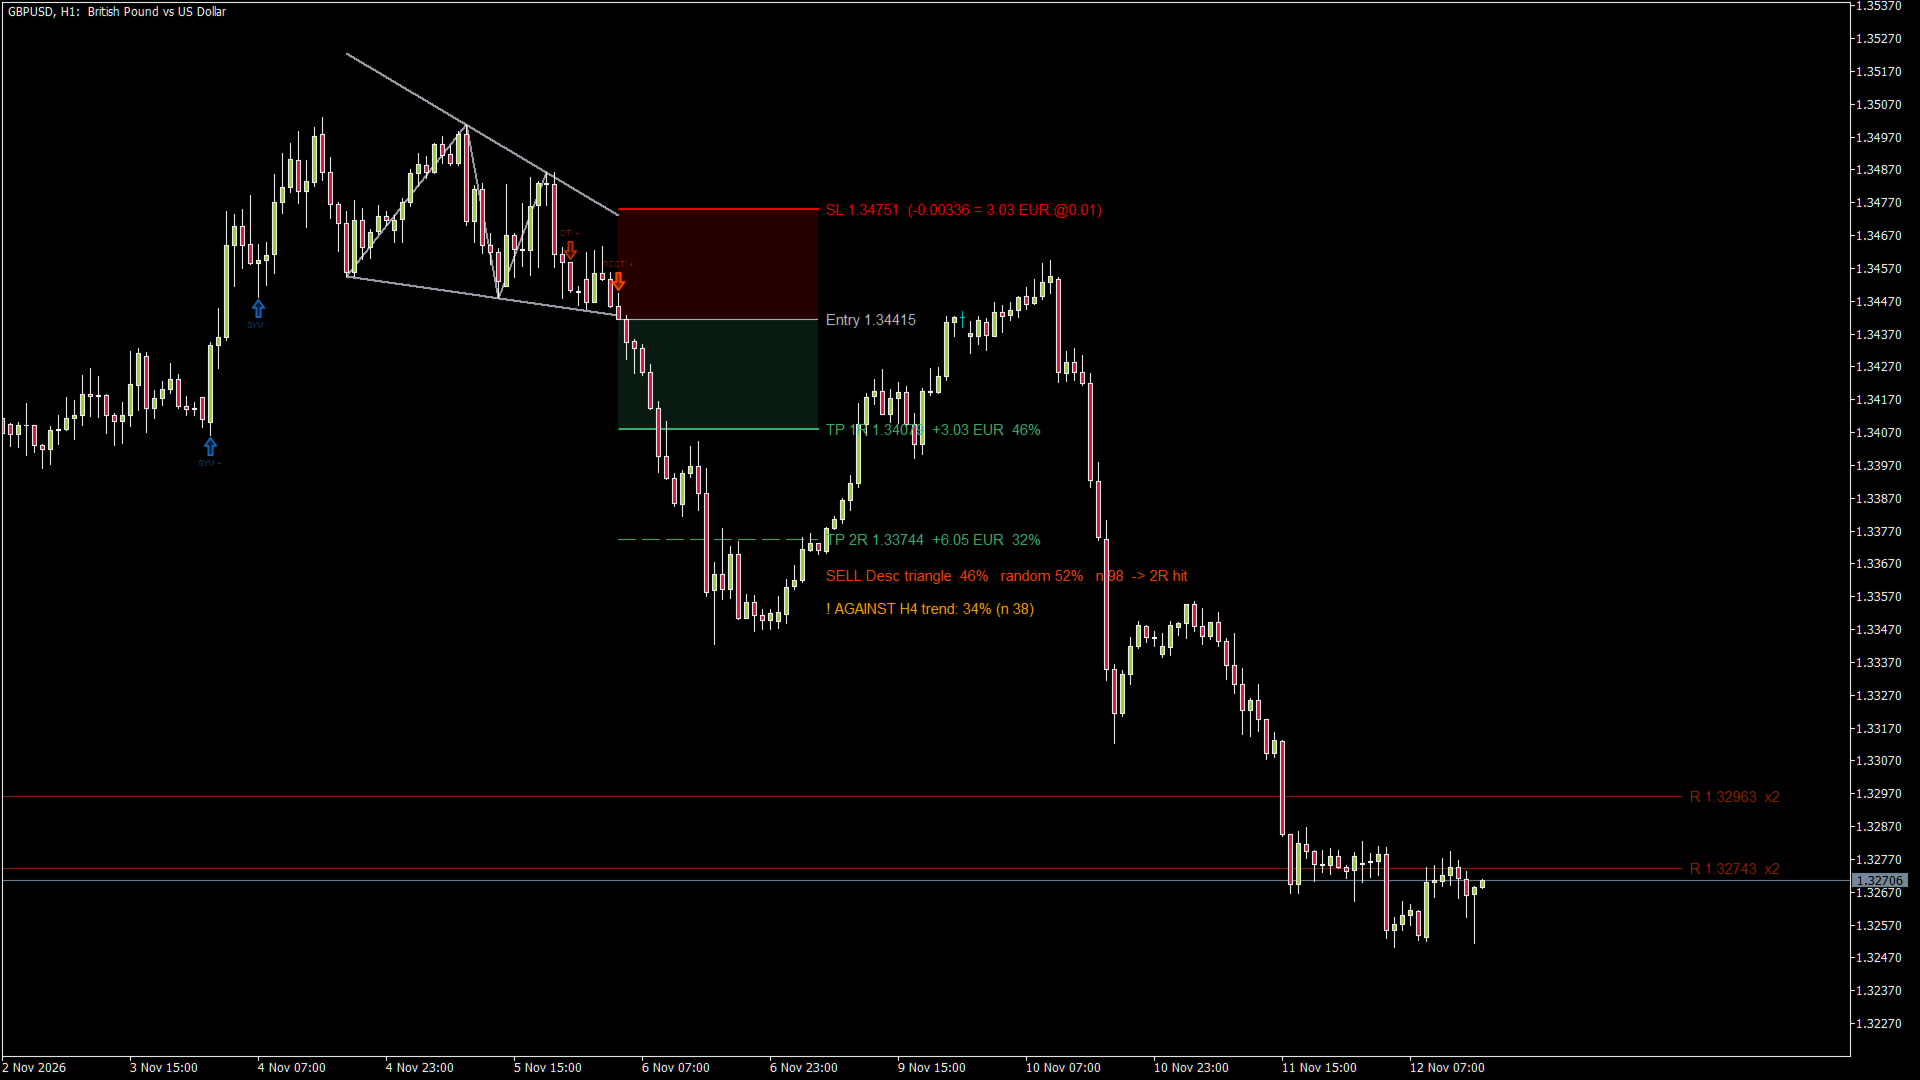
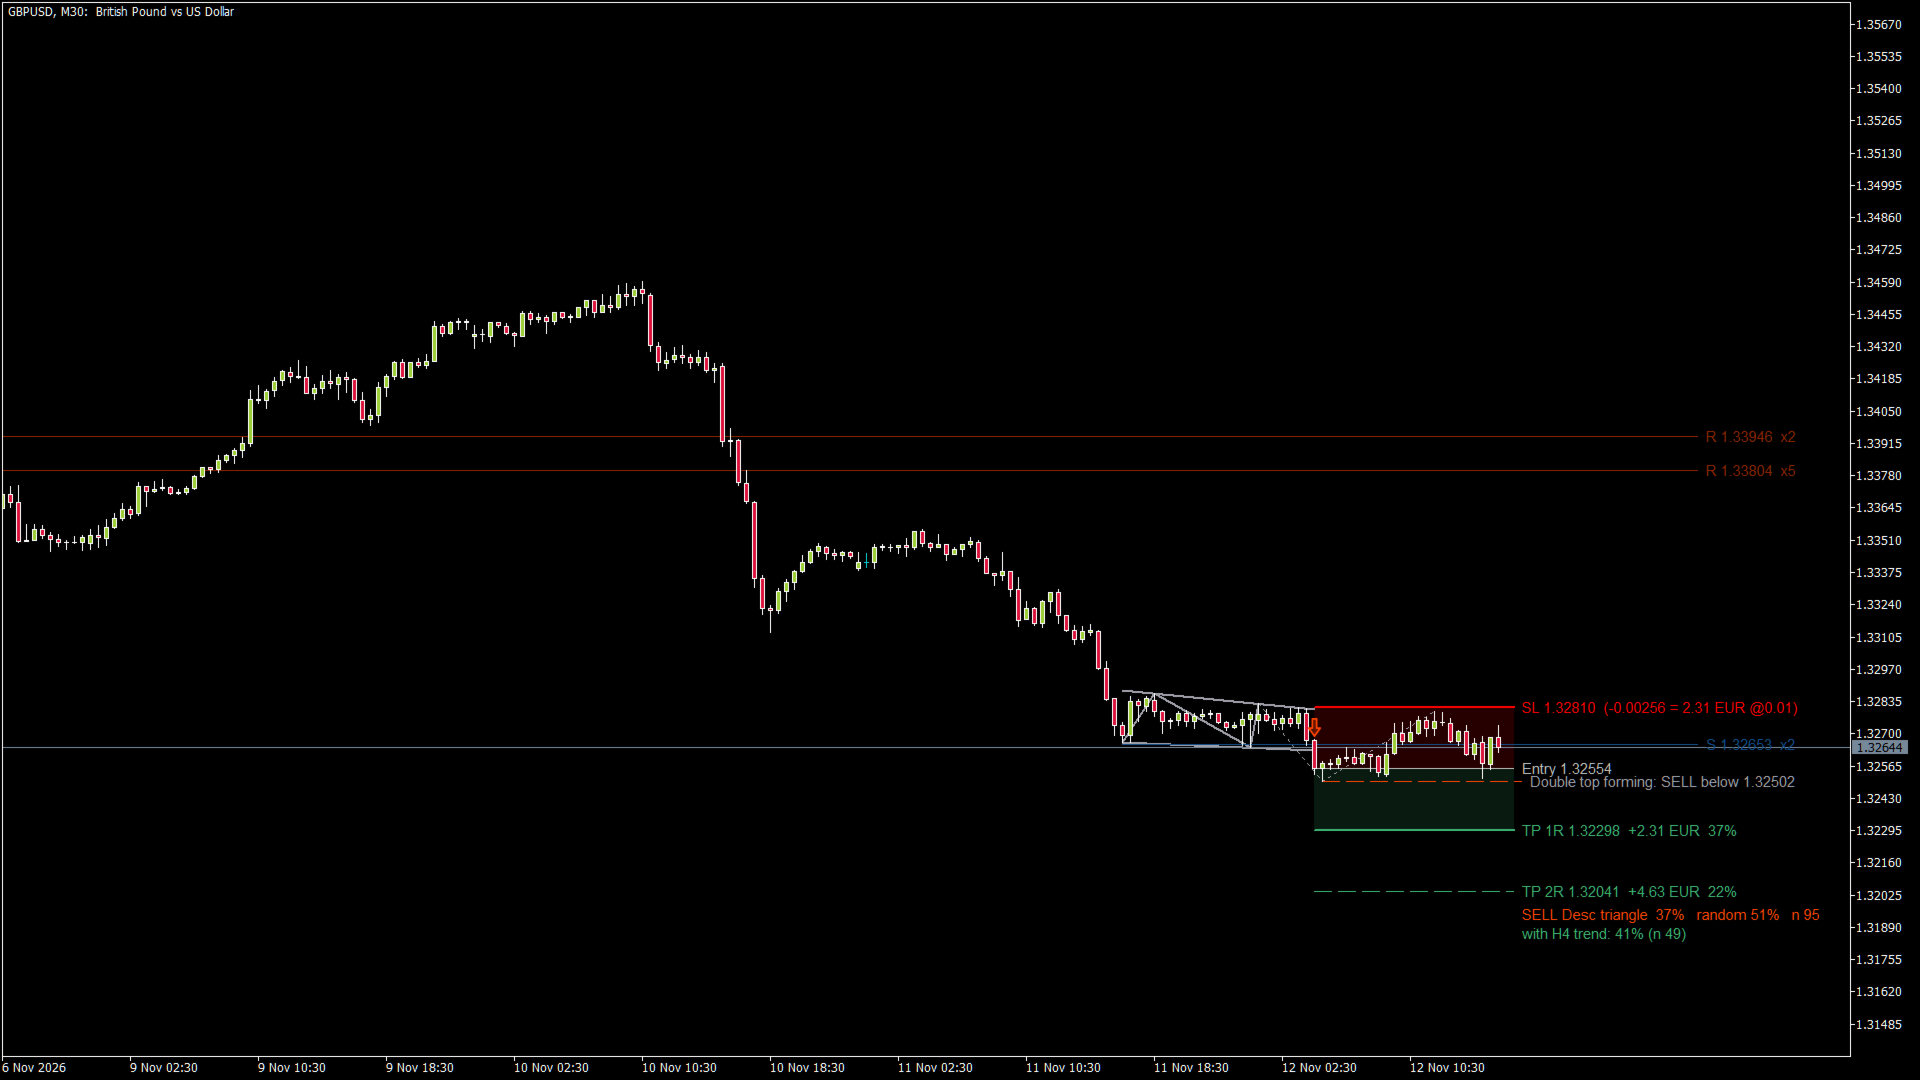
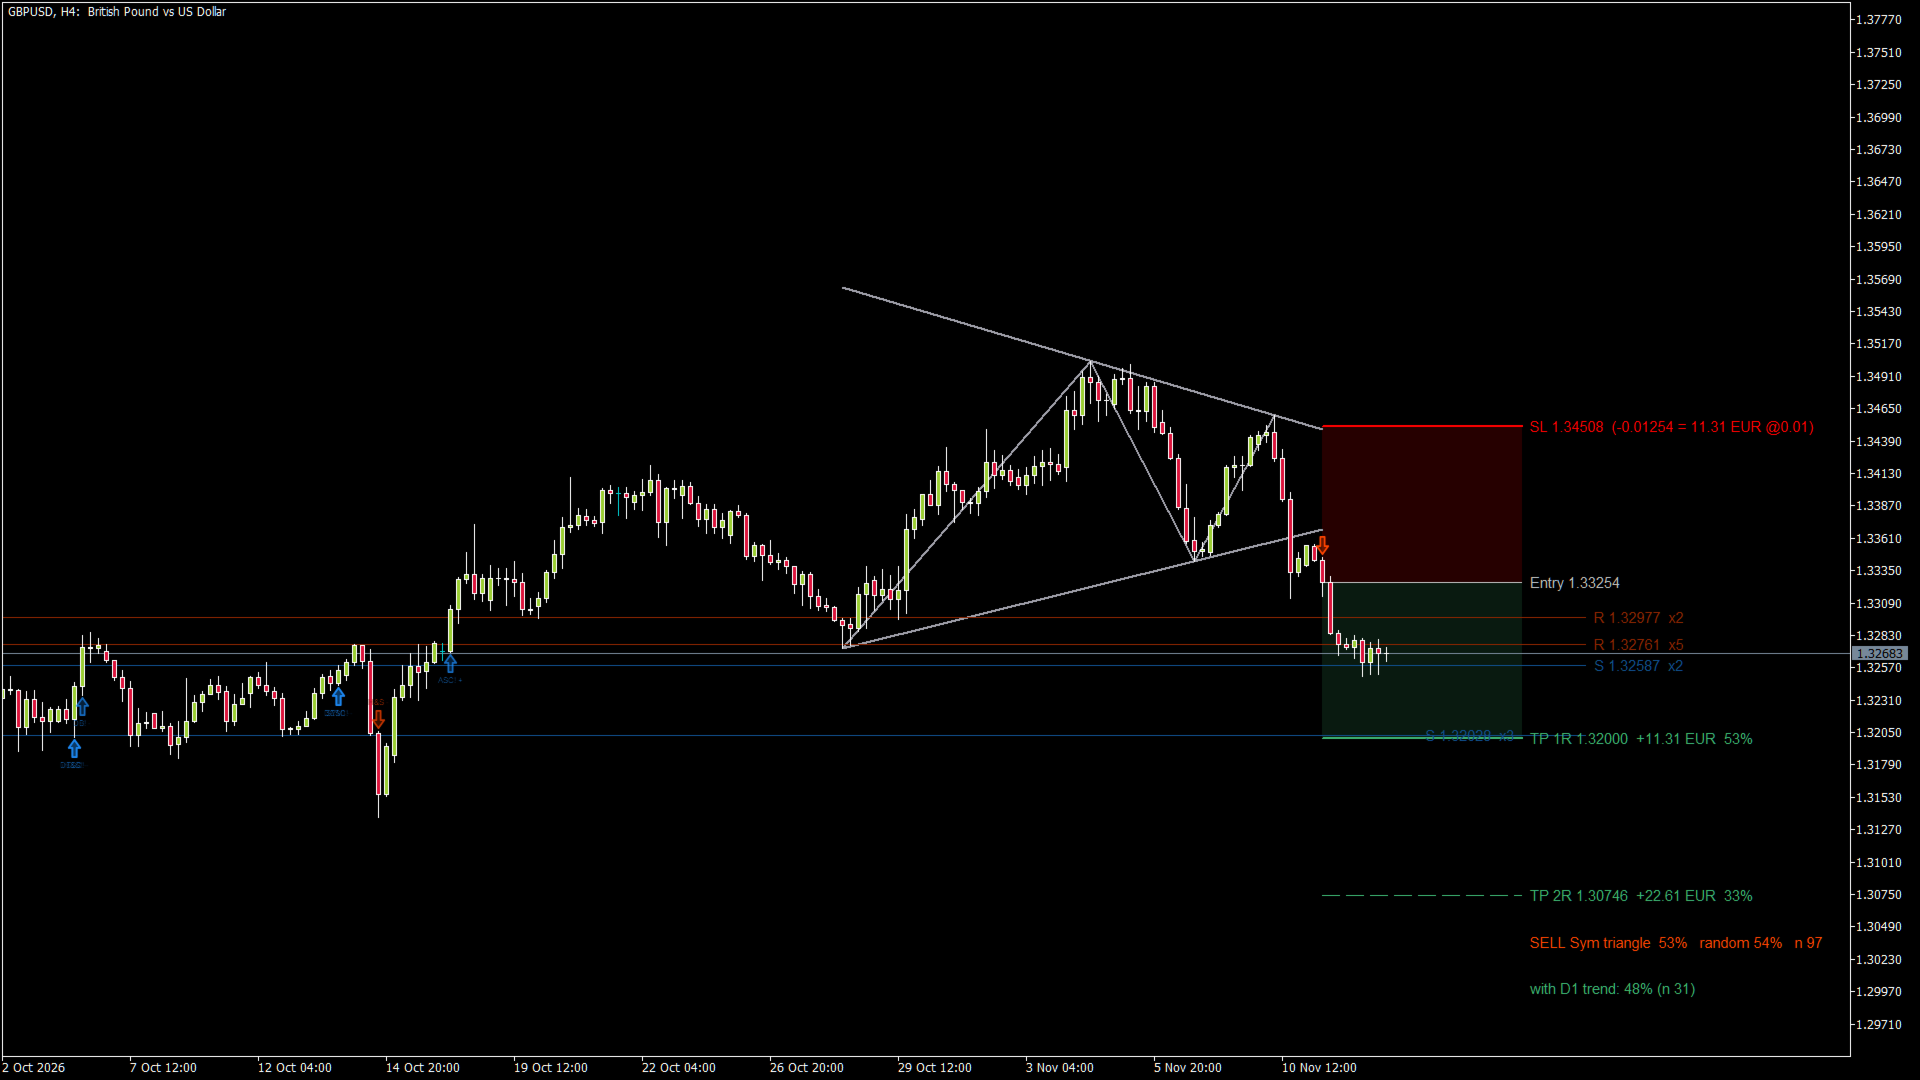
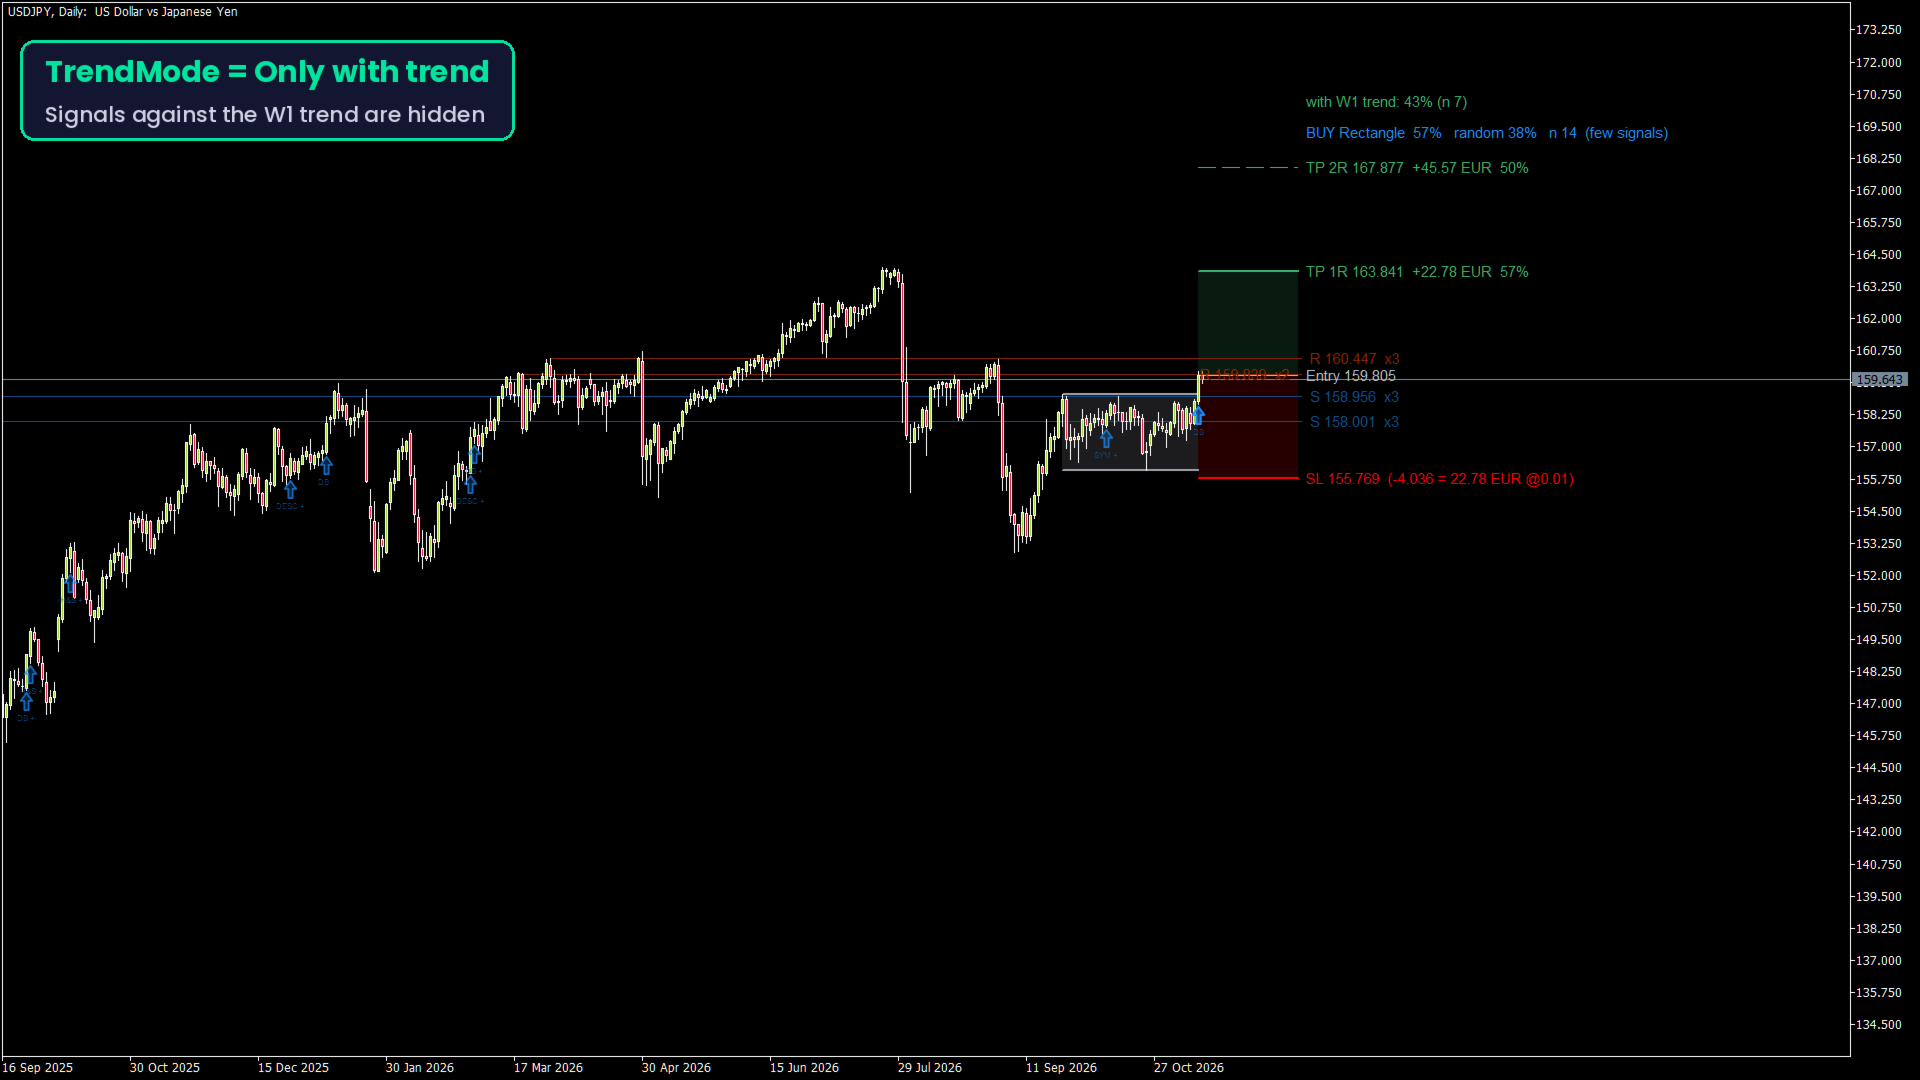
- The latest signal: pattern outline, arrow, entry, stop loss and 1R / 2R targets with prices and money for your lot.
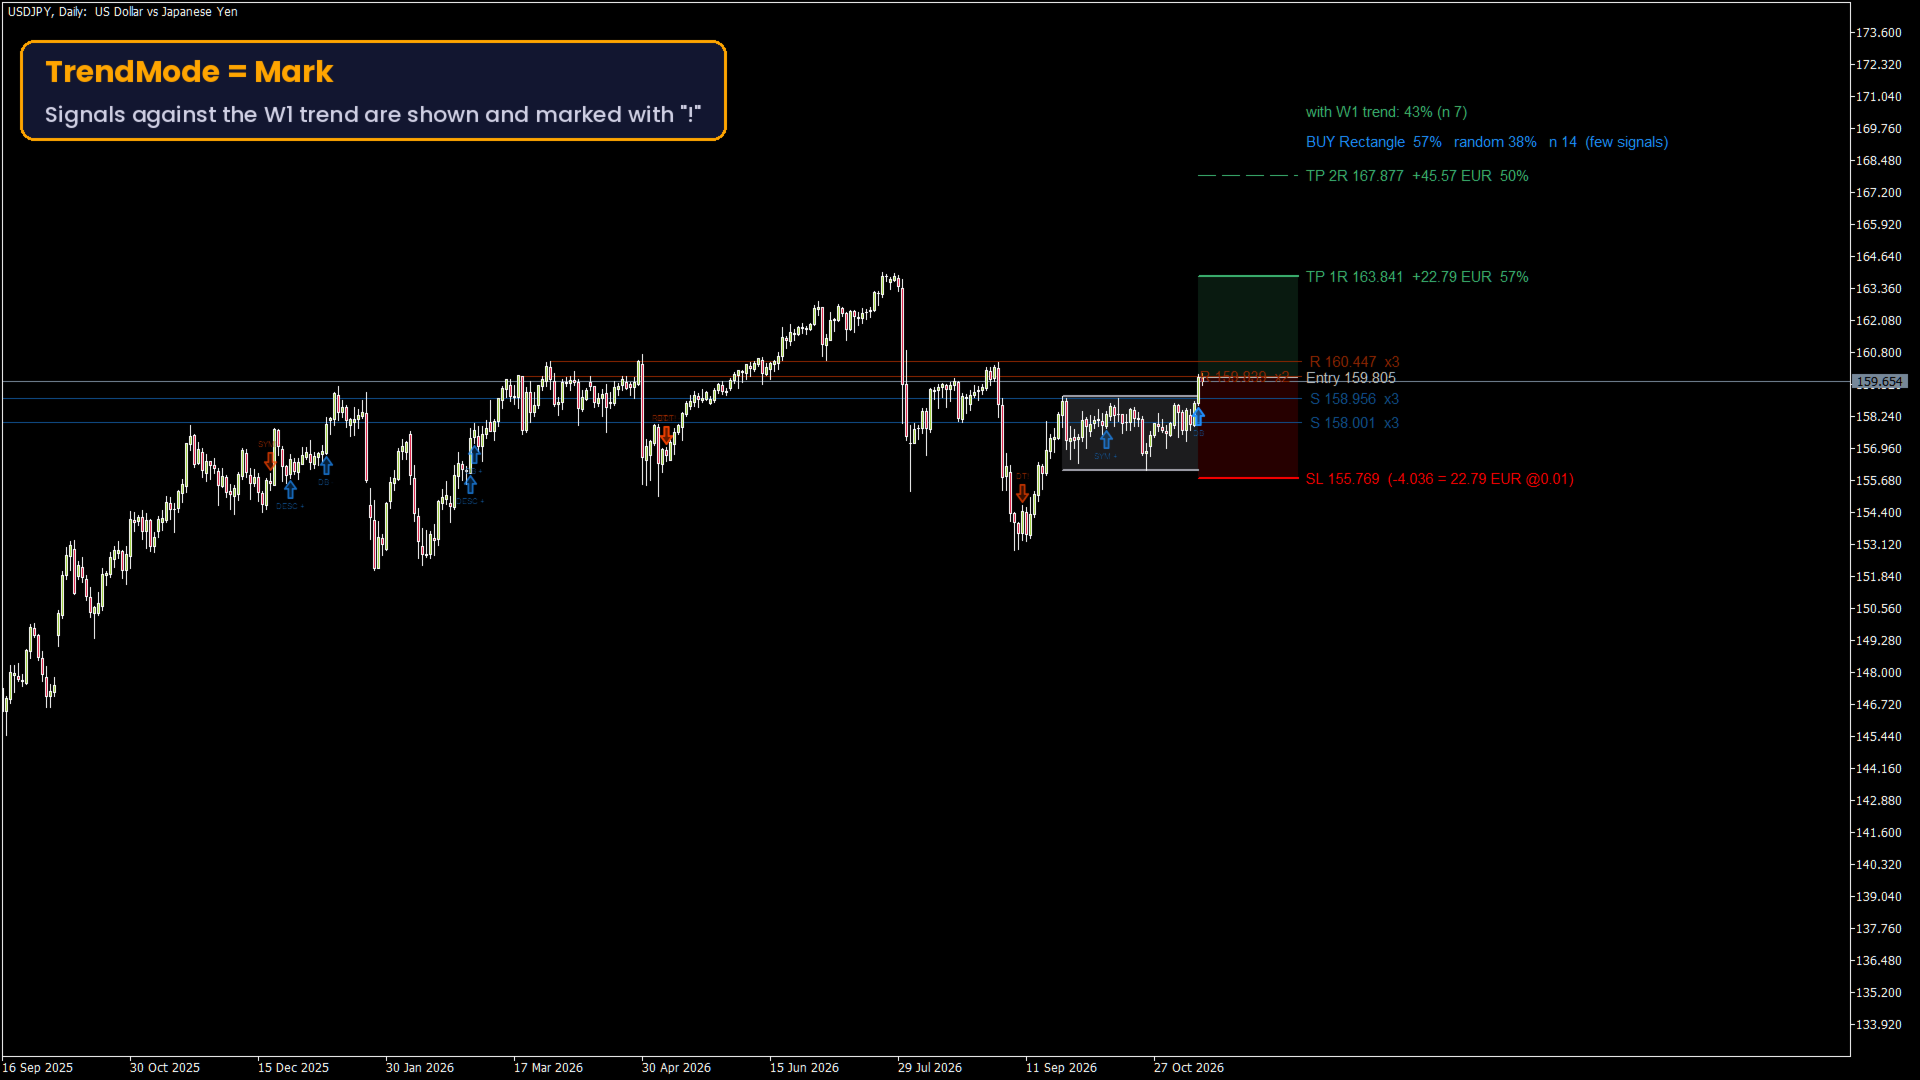
- Main label, for example "BUY Rectangle 56% random 50% n 112". 56% = how often this pattern reached 1R before the stop on this chart, random = the same trade at random candles, n = number of signals behind the %. "(few signals)" when n is still small.
- Trend warning: every signal is marked "with H1 trend" or "! AGAINST H1 trend" (higher timeframe chosen automatically or by you), with its own win % - so you see if trading against the trend hurts on your market.
- Older signals as small arrows with "+" (1R reached) or "-" (stop hit); the tooltip shows entry, stop, target and the % (ShowOldLines adds a short faint stop line).
- Patterns still waiting for a breakout (dotted), with the breakout level.
- Nearest support and resistance levels (swing clusters) as context.
- Optional small statistics panel for all patterns.
EVERY MARKET IS DIFFERENT
- Triangles and the Rectangle give a signal on a breakout in either direction: a descending triangle can also break up (BUY). Double top and Head and Shoulders give only SELL, Double bottom and Inverse Head and Shoulders only BUY.
- The same pattern behaves differently on different instruments and timeframes. In our own tests the "textbook" breakout direction of triangles (ascending up, descending down) was better on gold and on the Nasdaq index, but on GBPUSD the opposite breakouts did better. Trend and stop size also matter more on some markets than on others.
- That is exactly why the indicator measures every pattern on the chart you have open, instead of using fixed numbers. Check the % on your own symbol and timeframe before you trust a pattern.
HOW THE % IS CALCULATED
- Signal = close beyond the breakout line. Entry = close of that candle.
- Stop: behind the pattern (default), half of it, or a fixed x ATR - your choice, and the % are recalculated for the stop you choose.
- Win = +1R (and +2R) before the stop; a candle touching both counts as a loss. Cost per trade (spread) is included.
- Walk-forward: each % uses only signals that were finished before that signal, so the history is not "looking into the future".
HOW TO USE IT
1) Attach it to any symbol and timeframe.
2) Look at the % next to "random": a pattern a few points above random with a large n is worth your attention; a pattern at or below random is not.
3) Check the trend line: in our tests signals against the higher-timeframe trend were clearly weaker.
4) Try the stop options and see which stop works on your market.
Patterns that work on one symbol often do not work on another - this indicator lets you check instead of guess.
INPUT PARAMETERS
Patterns
- UseRectangle, UseHS, UseDouble, UseTriangles.
Swings
- PivotBars, MinSwingATR, TolATR, MinHeightATR, ArmBars (candles a pattern waits for its breakout).
Trend
- TrendMode (off / mark with or against / only signals with the trend), TrendTF (auto: M1-M15 -> H1, M30-H1 -> H4, H4 -> D1, D1 -> W1), TrendMA (200).
Stop
- StopMode (behind the pattern / half / fixed x ATR), StopATRx.
Statistics
- StatsBars, MaxHold, CostPrice (0 = 2 x spread), MinN.
Support / resistance
- ShowLevels, LevelsEachSide, LevelLookback, LevelMinTouches, LevelTolATR.
Drawing
- ArrowSize, OldSignals, ShowOldLines, LineBars, ShowForming, FormingMax, ShowPanel, MoneyLot, FontSize, colors.
Alerts
- AlertOn, AlertPopup, AlertSound, AlertPush, AlertEmail.
The win % is history, not a promise. Use it to decide which patterns deserve your attention, and manage your risk.
OTHER TOOLS BY THE SAME AUTHOR
- RR Position Tool Pro: position tool with money, partial targets, tracking, statistics and a trading journal.
- Smart Order Blocks: order blocks with their own walk-forward probability.