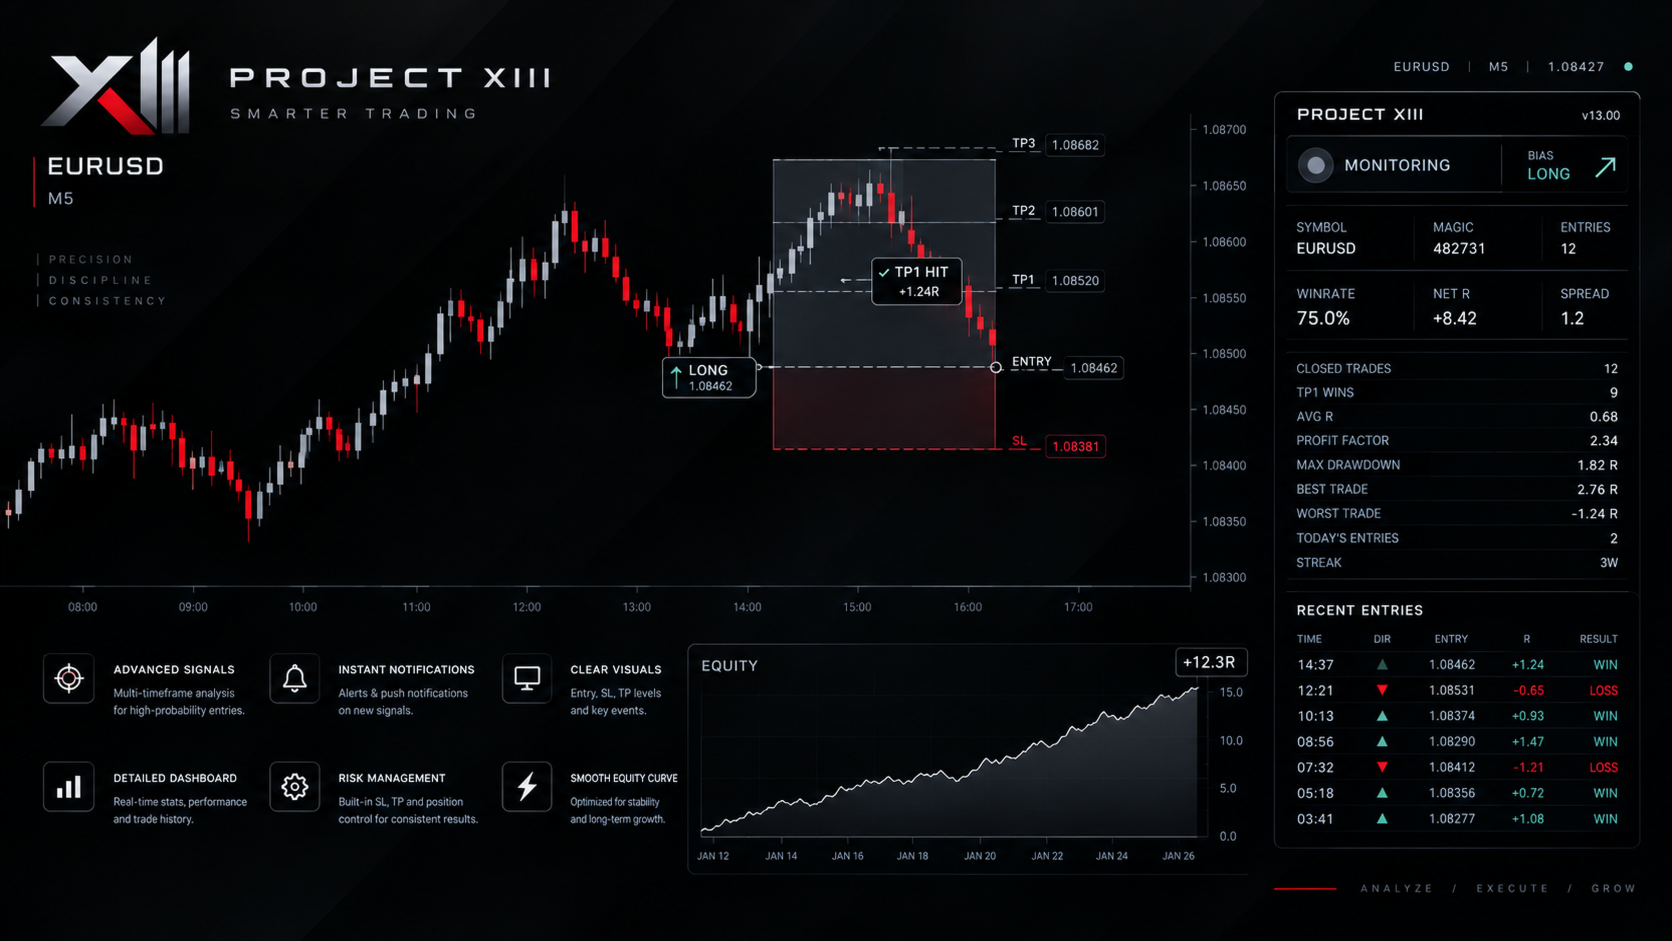
Project XIII
- Indicators
- Version: 13.1
- Activations: 5

Project XIII
An EURUSD-focused MT5 indicator for directional signals, trade levels, alerts and virtual-trade review.
Overview
Project XIII is a MetaTrader 5 chart indicator for traders who want to evaluate EURUSD setups with clear price levels and built-in context. It analyzes price behavior across M1, M5 and M15, then displays potential long or short signals with an entry level, stop loss and three take-profit levels.
Project XIII is an indicator, not an Expert Advisor. It does not open, modify or close broker orders. The positions and results displayed on the chart are generated by its internal virtual-trade model.
How it works
The indicator evaluates directional conditions and checks recent price movement, efficiency and volatility before identifying potential setups. Signals are based on closed higher-timeframe bars, while the entry logic uses M1 data. This helps keep the signal process structured across multiple timeframes.
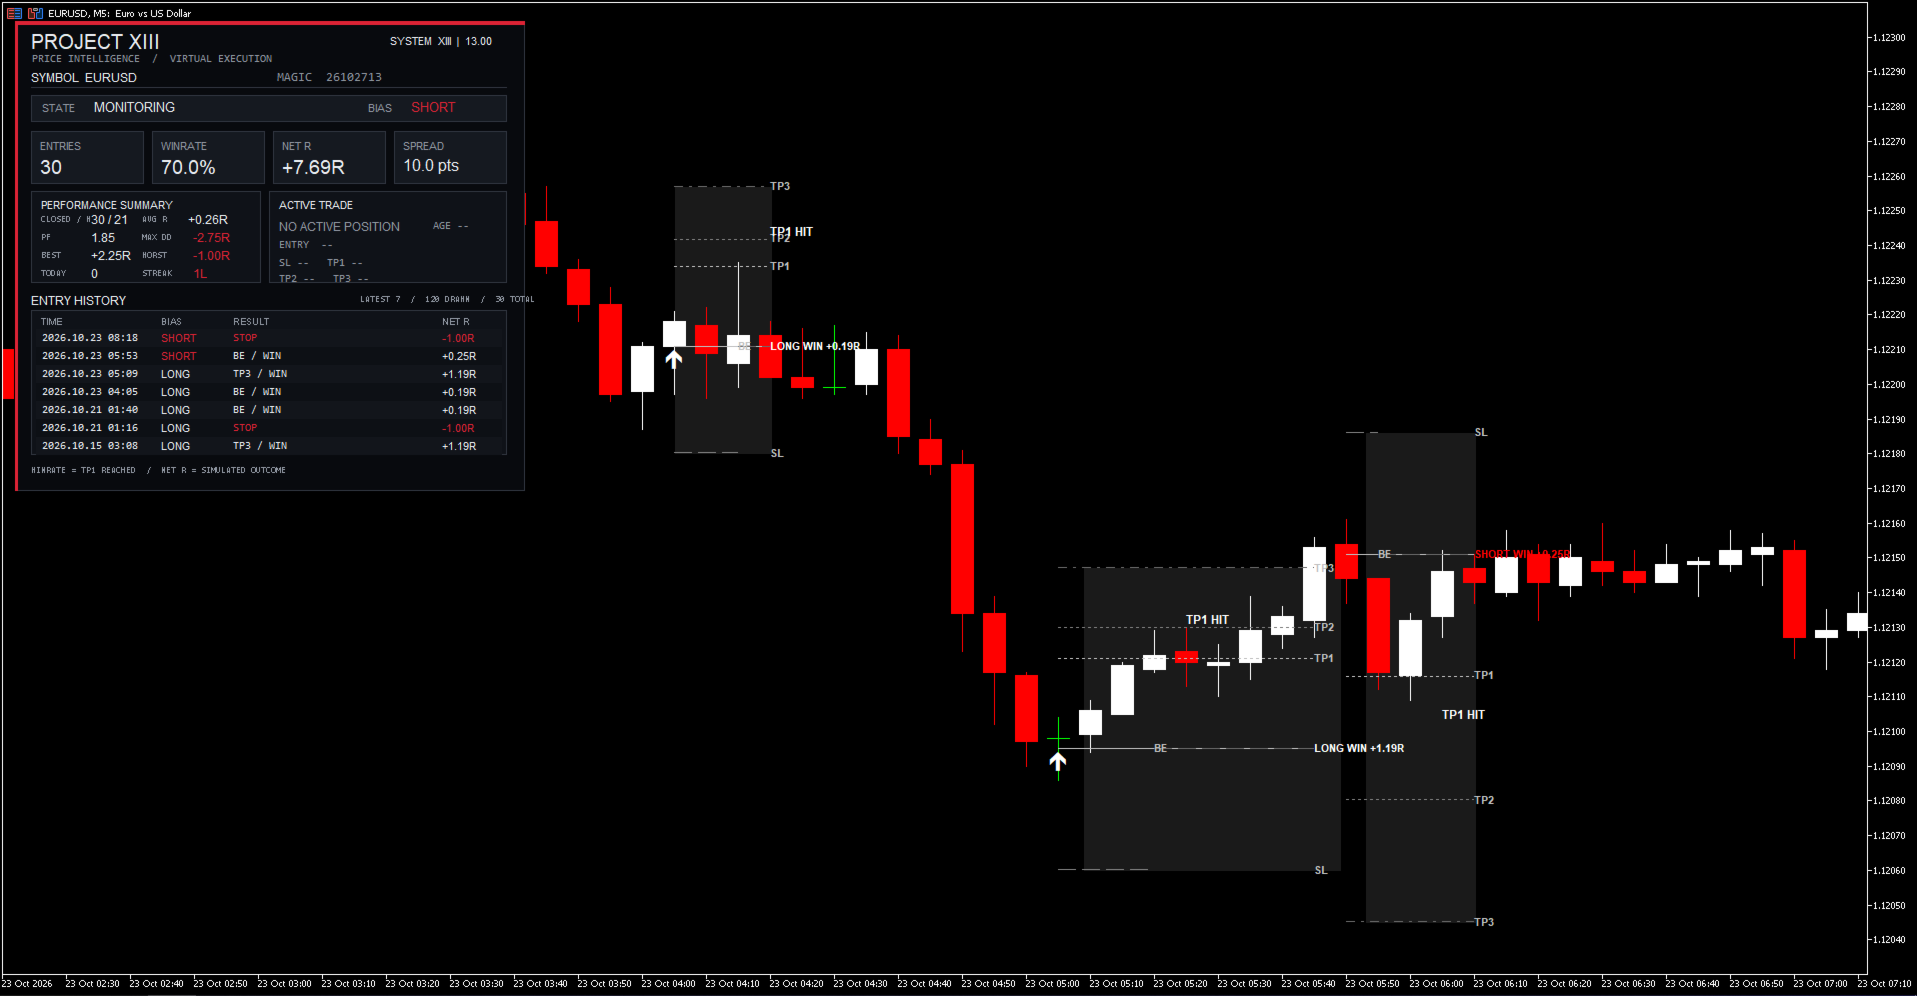
Each virtual setup is displayed with an entry level, stop loss and TP1, TP2 and TP3 targets. The virtual model tracks target touches and simulated exits. An optional setting moves the simulated stop to the entry level after TP1 is reached.
Main features
-
Long and short signals, with options for both directions, long only or short only.
-
Entry, stop-loss and three take-profit levels with visual risk and reward zones.
-
A chart dashboard showing current status, directional bias, spread and virtual-trade statistics.
-
Popup alerts and optional push notifications when a new signal appears.
-
Virtual-trade history with Net R, average R, profit factor, maximum drawdown, best and worst trade, recent entries and other summary figures.
-
Optional trade-level drawings and virtual breakeven after TP1.
Using the indicator
Attach Project XIII to an EURUSD chart in MetaTrader 5. The signal calculations use M1, M5 and M15 data internally, so the chart display timeframe does not replace these calculation timeframes. Allow the terminal to load the required price history before evaluating the dashboard or historical drawings.
Choose whether to display both directions, long signals only or short signals only. Trade-level drawings, signal notifications and the simulated breakeven behavior can be enabled or disabled in the input settings. Push notifications require MetaTrader push notifications to be configured in the terminal. The Magic Number input identifies this indicator instance in its dashboard and chart objects; it does not identify or manage broker orders.
Understanding the statistics
WINRATE measures the percentage of virtual trades in which price reaches TP1. It is a TP1-touch rate, not a measure of final profitability. A virtual trade can touch TP1 and also reach its stop during the same candle, or later finish with a negative simulated result.
Net R and the other performance figures are calculated by the indicator's virtual-trade model. They are not broker-account results. The model does not deduct spread, commissions, swaps or slippage, and it does not reproduce the conditions of live order execution. The current spread shown on the dashboard is informational and is not deducted from simulated Net R.
Historical virtual performance does not guarantee future results. Signal behavior can vary with market conditions, broker price feeds and the available historical data. Evaluate the indicator on your own data before using its signals in a live trading process.
If you have any further questions feel free to contact me.