Moving Average Crossover Suite

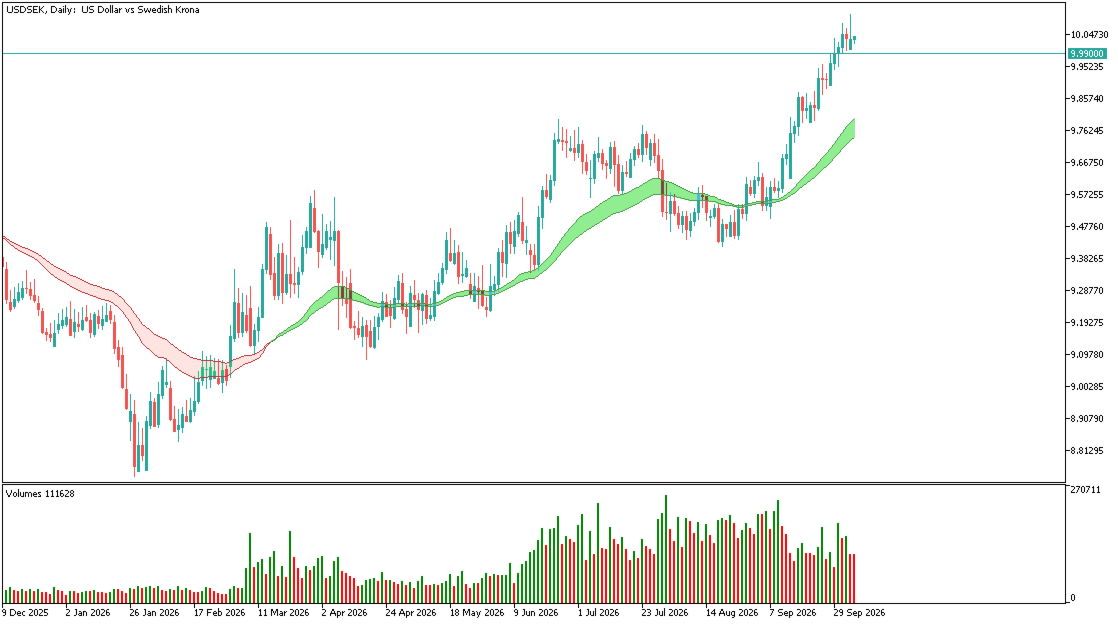
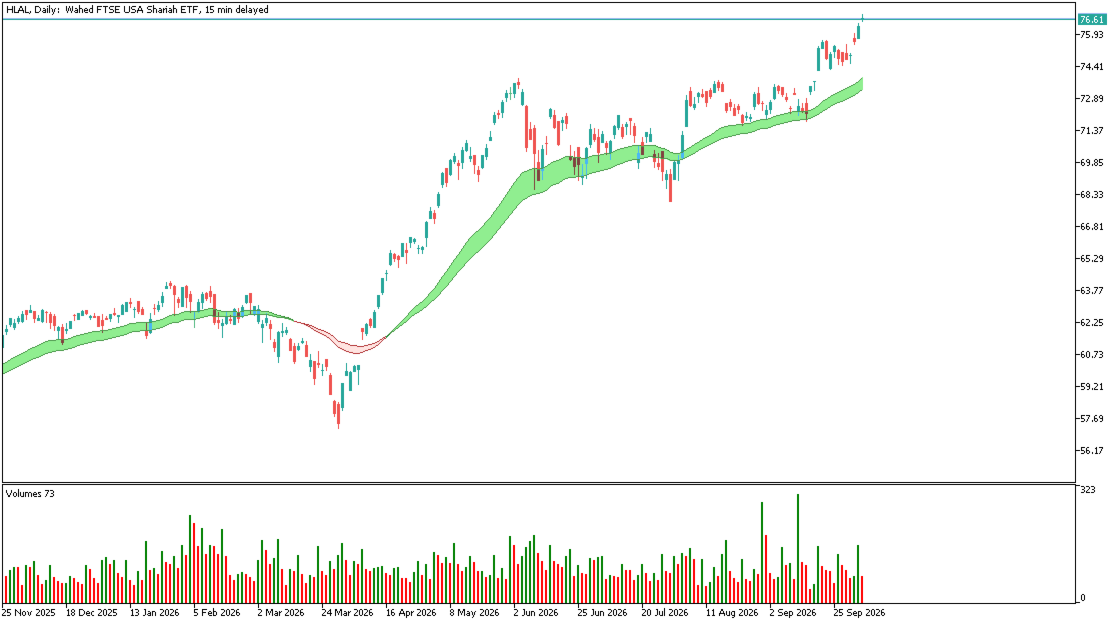
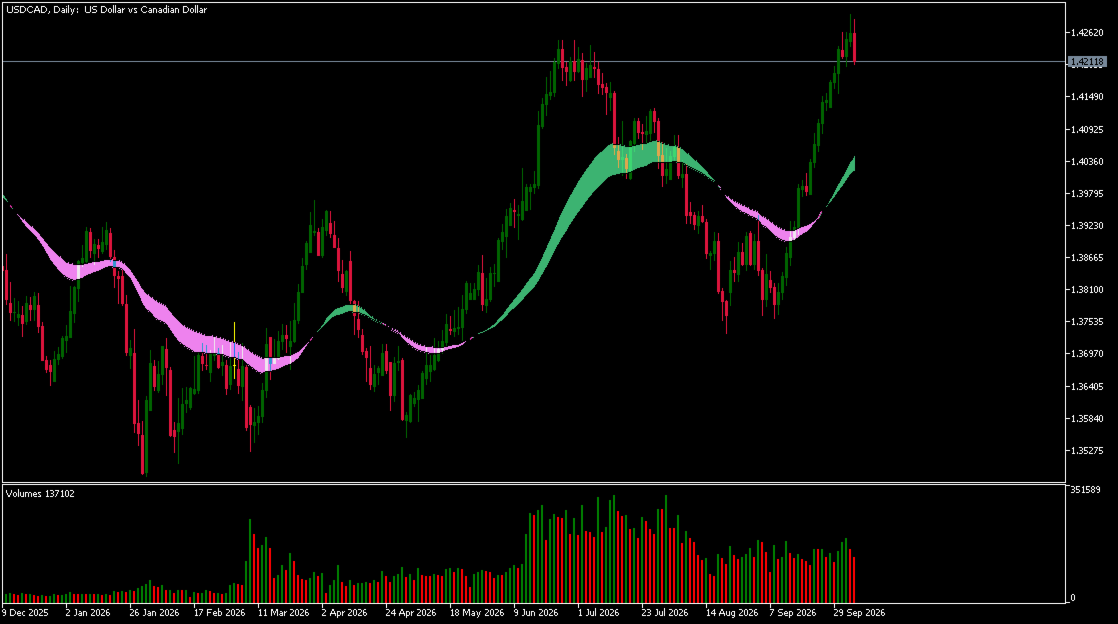
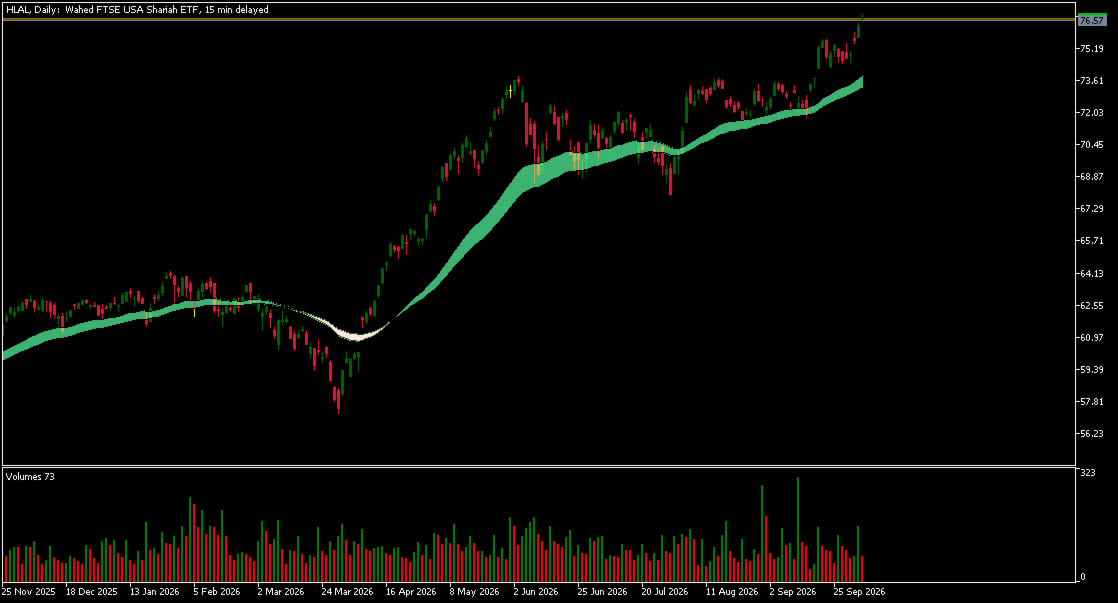
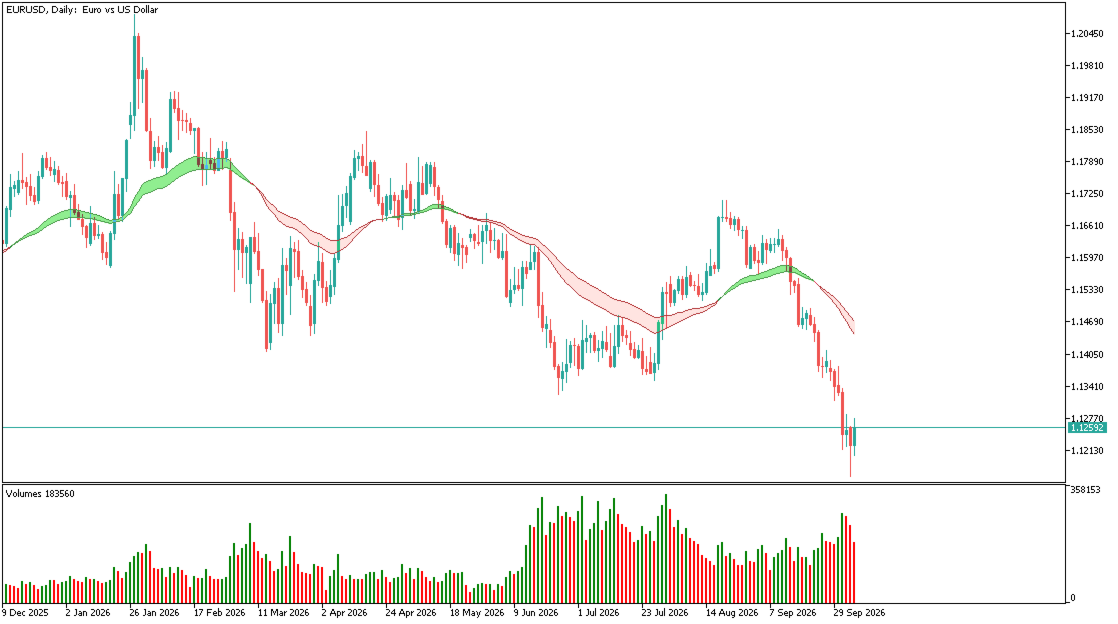
This indicator, called the “Moving Average Crossover Suite,” is the classic moving average crossover indicator. It takes into account all types of moving averages available in MQL5. As is well known, this indicator—whether it involves two or three moving averages, of the same or different types—has been extensively discussed in the relevant literature, particularly in *Technical Analysis of the Financial Markets* and *The Visual Investor*, both by John Murphy.

First, it should be noted that the code was not developed from scratch, but was based on functional code already written in other programming languages. As a contribution, color was added to the area and the moving averages to improve visual readability. Of course, it goes without saying that it adheres to the principle that the gap between the two moving averages tends to widen when the trend is stronger and narrow when the opposite is true.
More from author
Multiple Moving Averages
Jose Manuel Orozco Ines
This indicator was named “Multiple Moving Averages” because it can plot up to 10 different moving averages on the same chart, assigning each a color that creates a blurred effect, which significantly improves its visual appeal and ease of interpretation. The only limitation is the number of available moving averages of different types. In the case of ThinkScript, the documentation states that there are five different types of moving averages: simple, exponential, weighted, Wilder’s moving averag
FREE
The “Multi Standard Error Channel” indicator was taken directly from the Thinkorswim indicator of the same name (and translated into MQL5), except that “Multi” was added because it has been enhanced to incorporate three channels into the same indicator, allowing the user to analyze the price chart for different numbers of bars and standard deviations. The “Standard Error Channel” indicator, unlike the “Standard Dev Channel,” uses the average dispersion of prices around the fitted regression li
FREE
The Cybernetic Cycle Oscillator for MetaTrader 5 is an indicator designed to reduce the lag inherent in traditional indicators. This MT5 version is a direct adaptation of the classic CyberCyclesOscillator found on the Thinkorswim platform, whose mathematical logic is based on John Ehlers' developments presented in his book Cybernetic Analysis for Stocks and Futures . Mathematical Foundations and Code Structure Unlike conventional oscillators, which tend to react late to trend changes because the
FREE
The  « Multi-Standard Dev Channel»  indicator is based on the statistical concept of linear regression, with Gilbert Raff being the first to implement it as a technical analysis indicator. Basically, it is one of many ways of making future projections based on known past and current data; it also requires that the variables be linearly related, i.e., that changes in the variables remain stable, resulting in a straight line on the plane, hence the term «linear». Advanced users may rightly note th
FREE
The “Displaced Moving Averages Suite” indicator is not part of the standard technical analysis library; rather, it was adapted from the “Hull Suite” indicator, published for free by InSilico in the TradingView community library. The system is based on the principle of shifting the moving average line selected by the user backward relative to that same moving average, but at the present time. It is at the crossover of these two moving averages that a bullish or bearish signal is generated. Addi
FREE
ADX EMAs Distance
Jose Manuel Orozco Ines
The Average Directional Index (ADX) is a technical analysis indicator developed by J. Welles Wilder in 1978. Its primary function is to measure the strength of a trend, regardless of its direction, and to determine whether the price has entered a sideways trend. It is also mentioned by John Murphy in *The Visual Investor* (2005) as an indicator that helps determine whether a market is ranging or is about to start a new trend. As for Exponential Moving Averages (EMAs), some authors believe that
FREE
Color Filled MACD
Jose Manuel Orozco Ines
The “Color Filled MACD” indicator is based on the classic Moving Average Convergence Divergence indicator created by Gerald Appel (in the 1970s) and later improved by Thomas Aspray (in the 1980s), in this case for MQL5. It is part of the standard technical analysis library. In this case, the native MQL5 code was used as a basis, and customizable colors were added so that users can choose them for the histogram, the moving averages, and the spaces between them. The goal is to make the indicator
FREE
Filter:
No reviews
Reply to review