ContextAxis MTF Dashboard
- Indicators
-
Mohamed Qosyairy Bin Shamsuddin
 Independent MetaTrader 5 developer creating clean and practical trading tools for manual chart analysis and everyday trading workflow.
 - Version: 1.42
- Activations: 5
ContextAxis MTF Elite
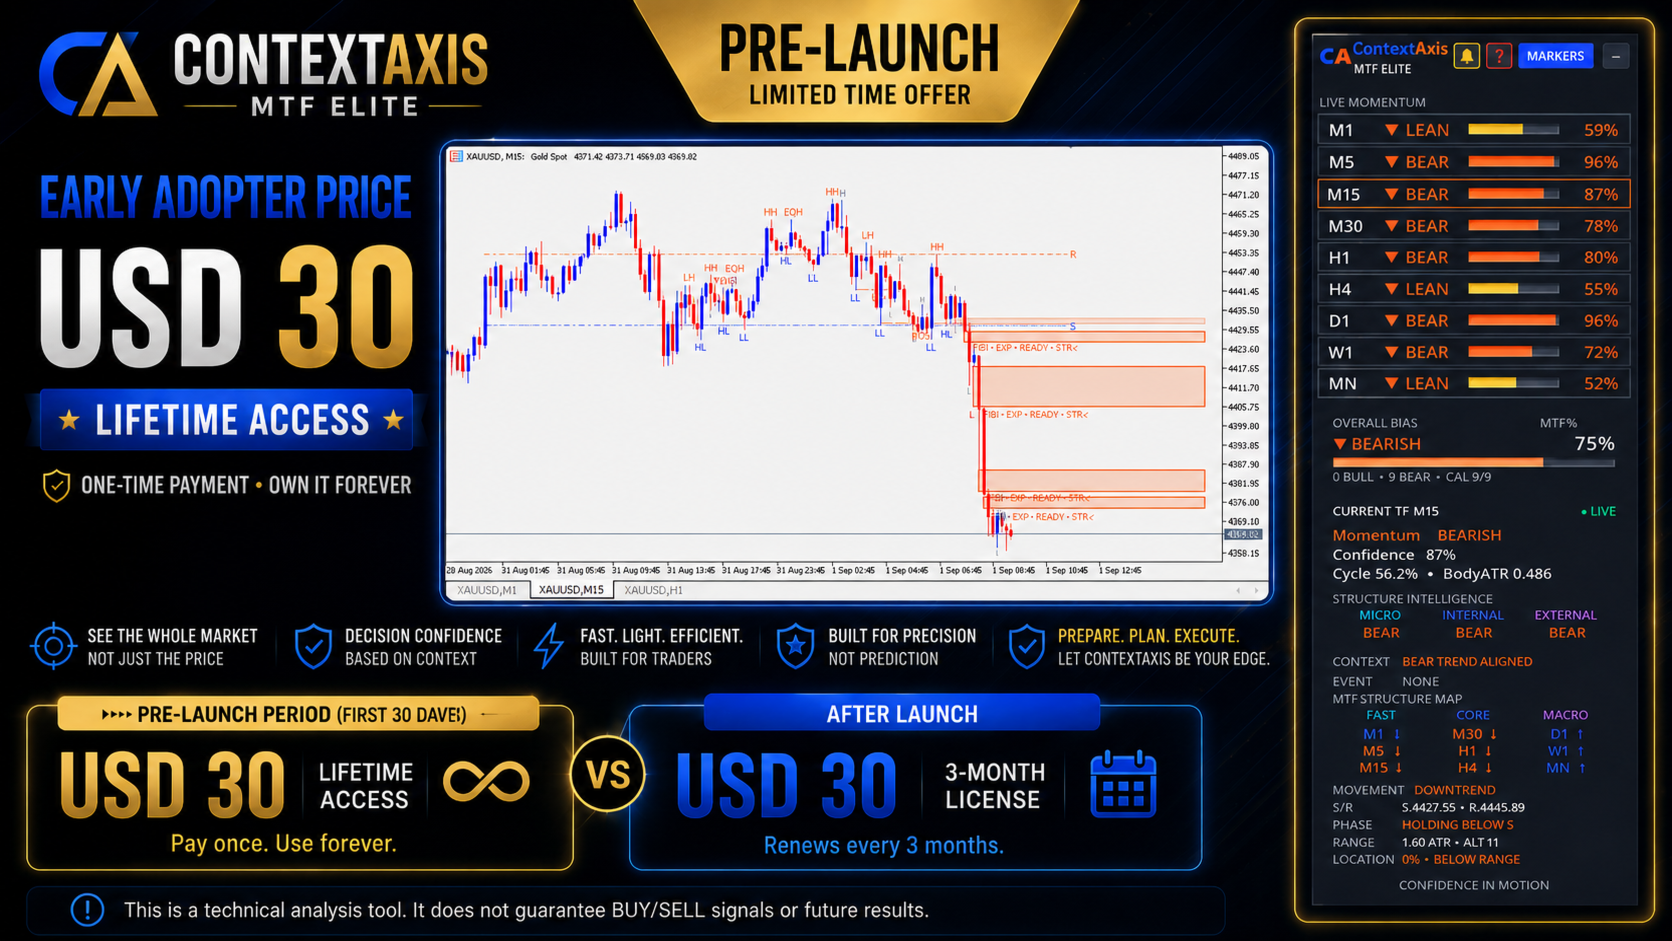
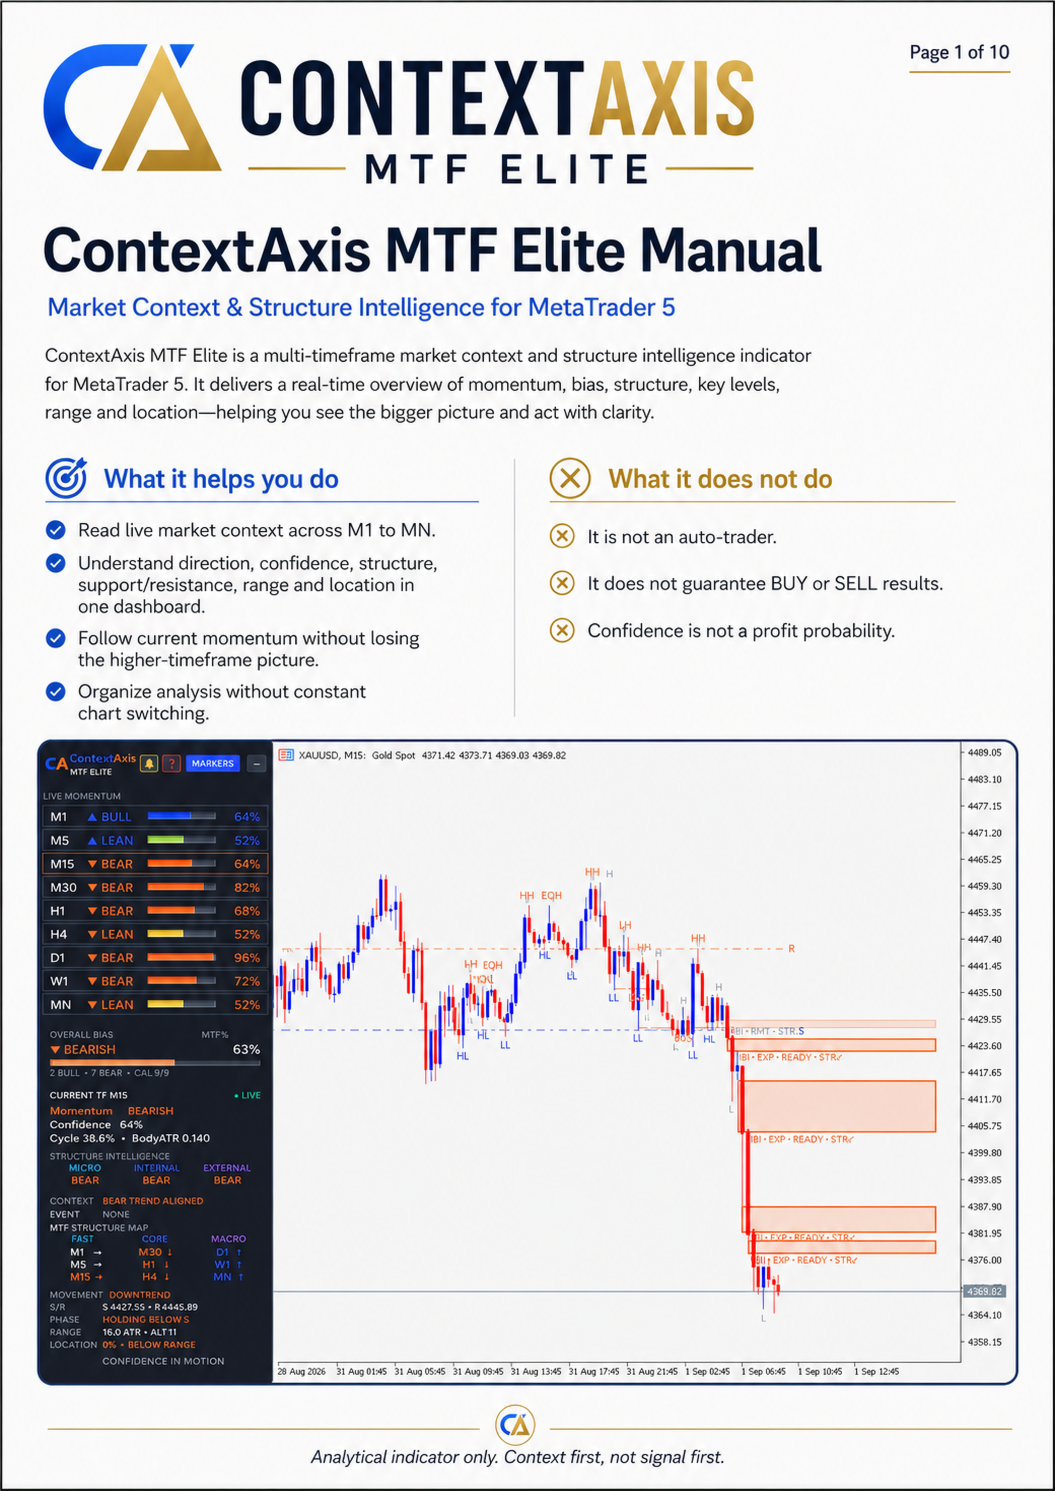
ContextAxis MTF Elite is a multi-timeframe market context and structure intelligence indicator for MetaTrader 5.
It brings live directional pressure, confidence, market structure, support/resistance interaction, range condition, market location, confirmed context events and Fair Value Gap intelligence into one chart-side workflow.
The purpose is not to generate automatic trades. ContextAxis is designed to help traders understand where price is, what the larger structure is doing, what current momentum is doing, and whether a meaningful reaction or control shift has actually occurred — without constantly switching between multiple charts.
Main Features
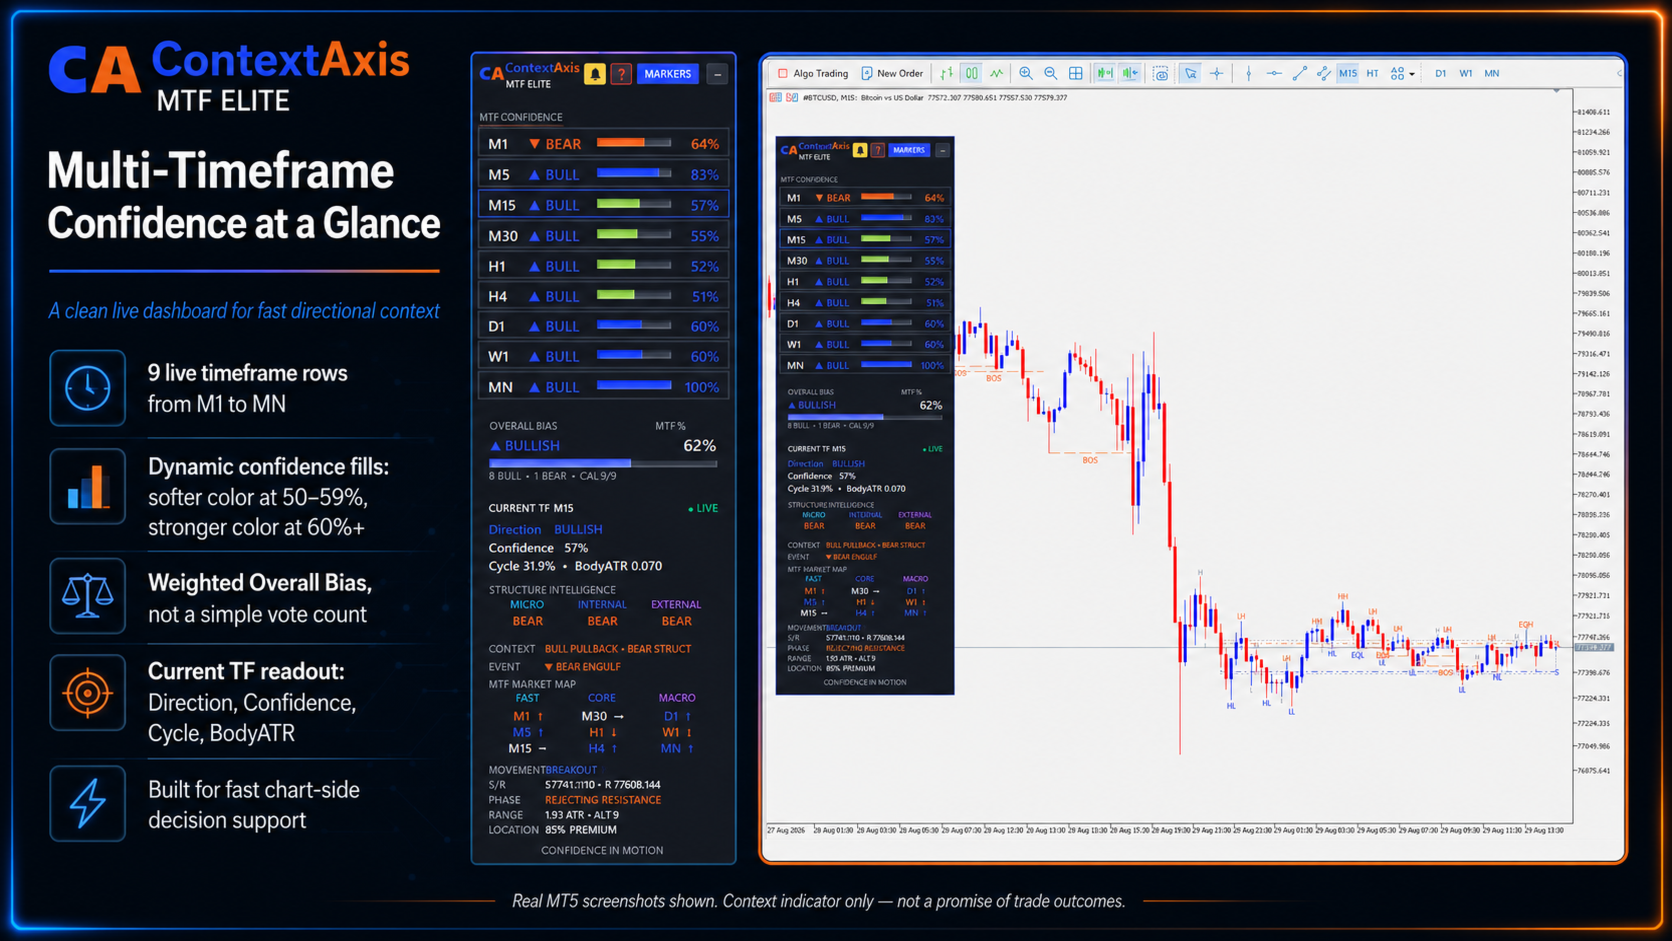
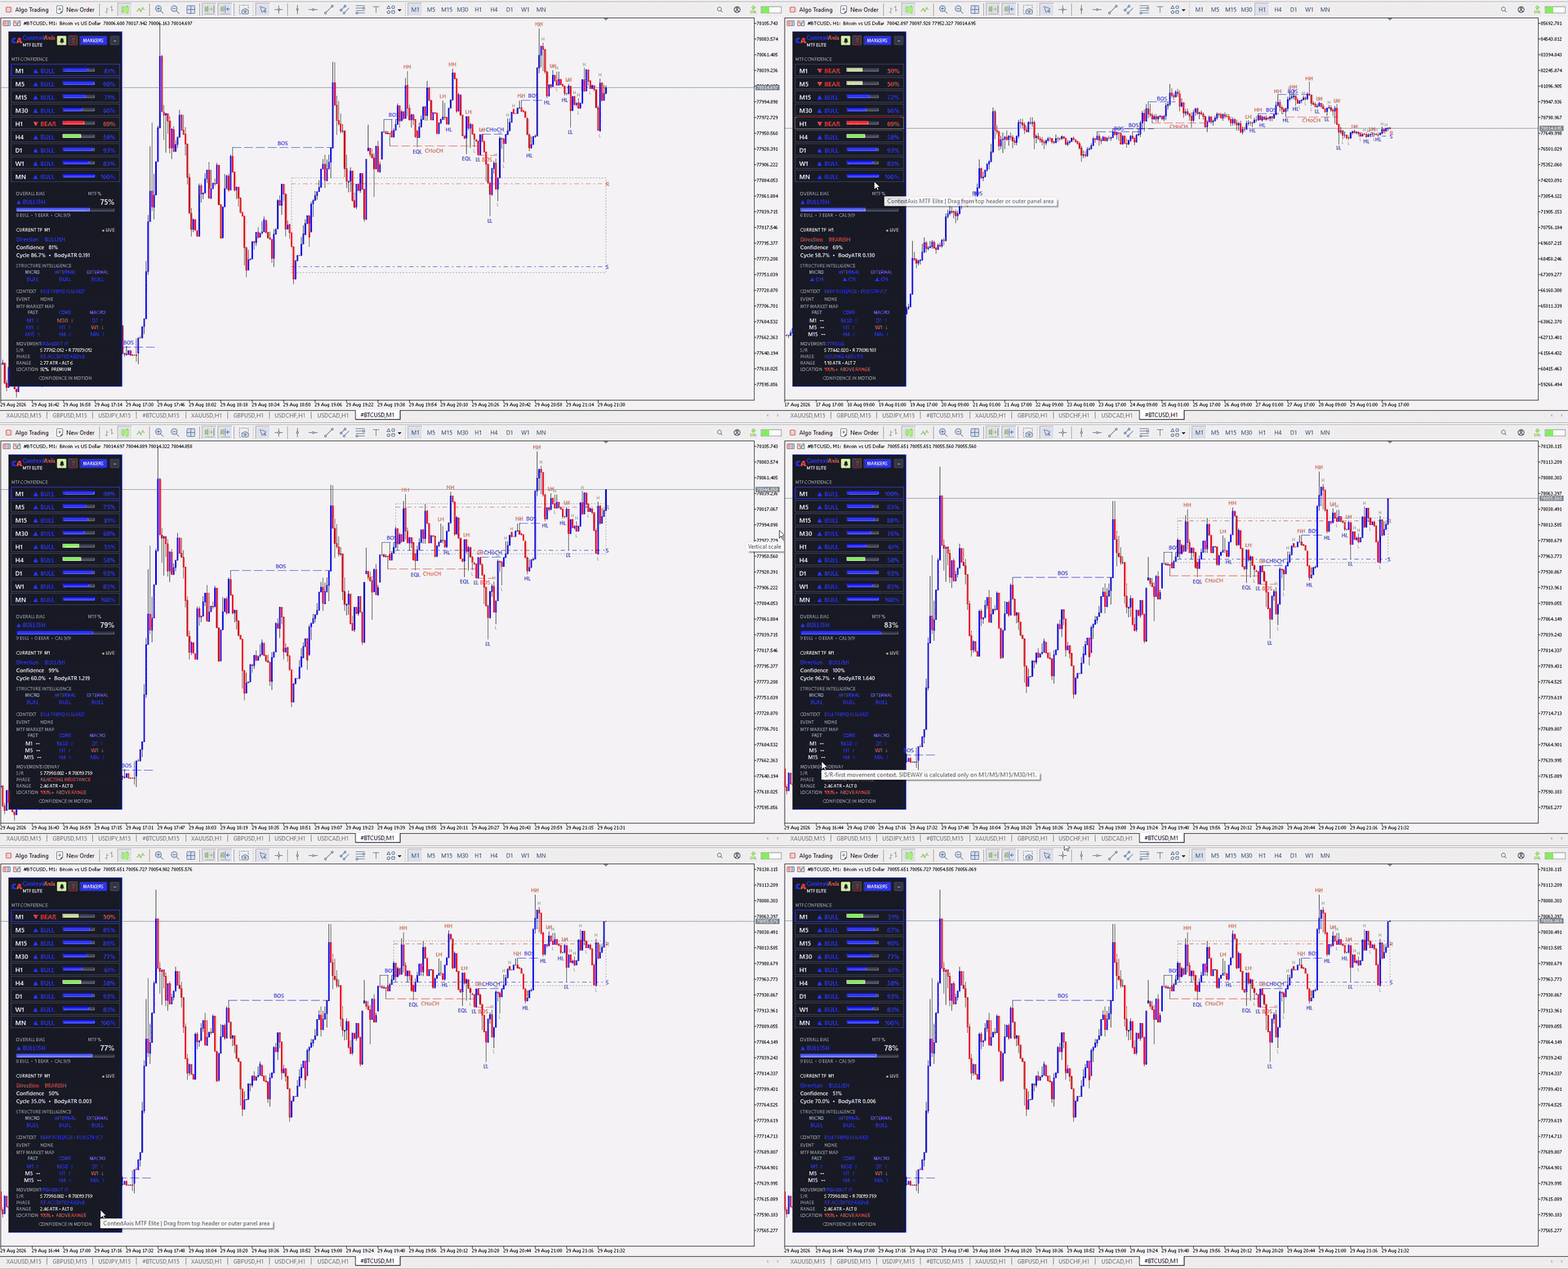
- 9 Live Timeframes: M1, M5, M15, M30, H1, H4, D1, W1 and MN are monitored in one dashboard.
- Live Direction & Confidence: Each timeframe displays current bullish, bearish or weaker directional pressure together with a confidence reading. Dynamic visual bars make it easier to distinguish stronger readings from weaker or transitional conditions.
- Weighted Overall Bias: Combines the available timeframe states into an aggregate multi-timeframe bias. The result is weighted by directional strength and context rather than being treated as a simple vote count.
- Current Timeframe Intelligence: Displays the active chart timeframe together with Momentum, Confidence, Cycle and BodyATR information.
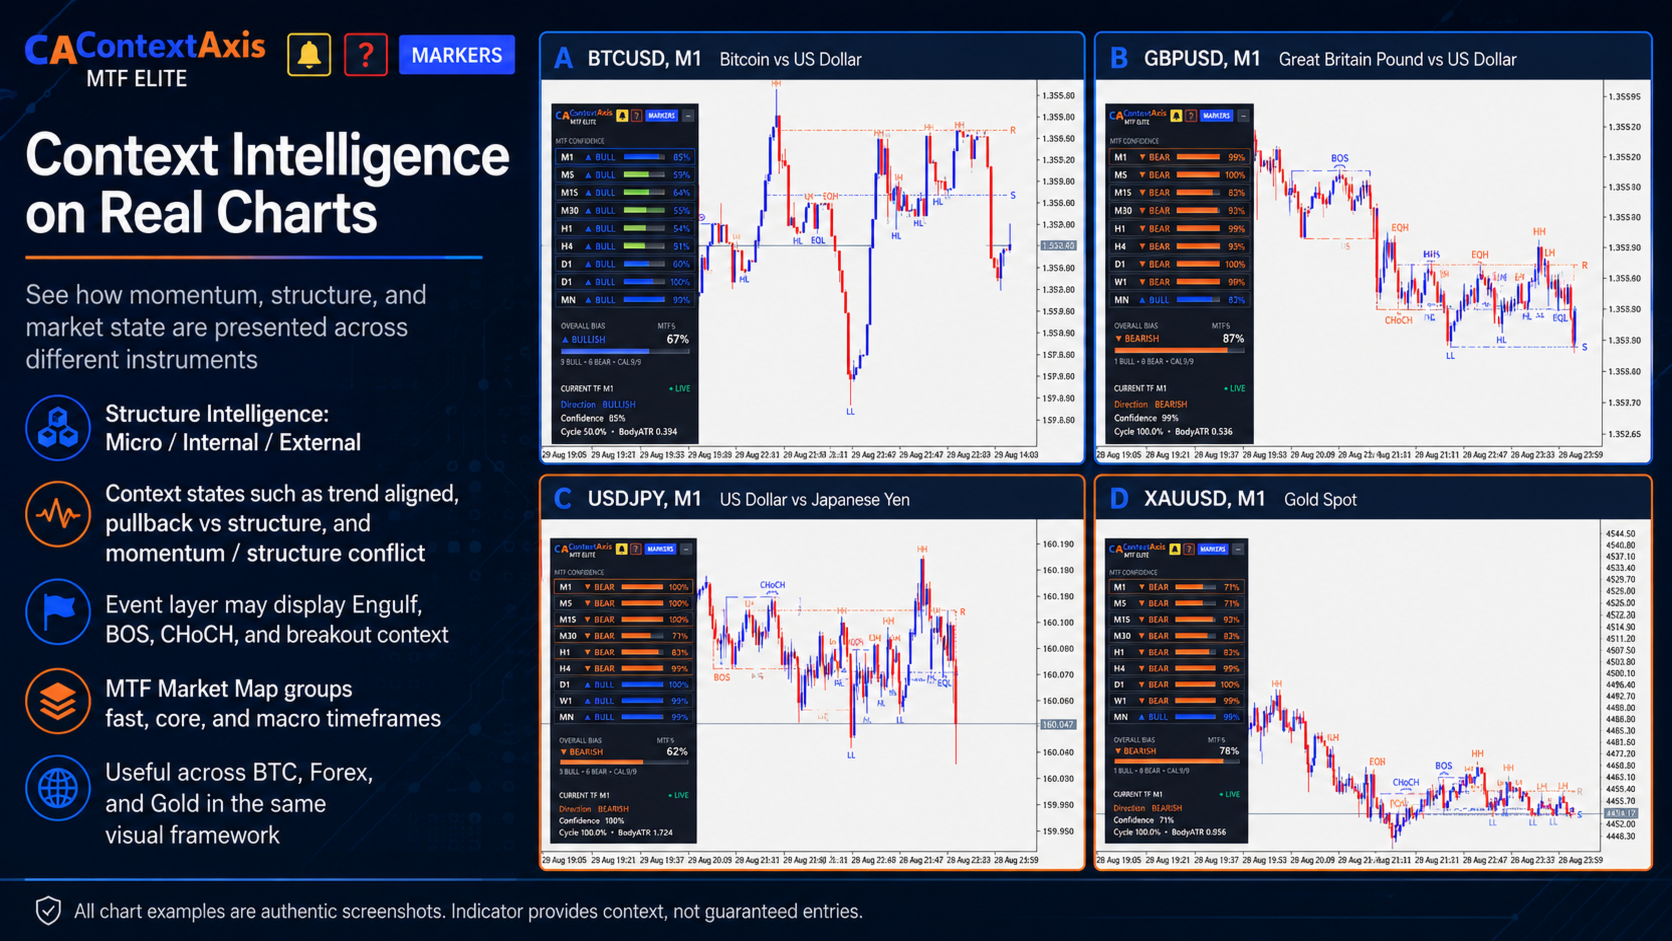
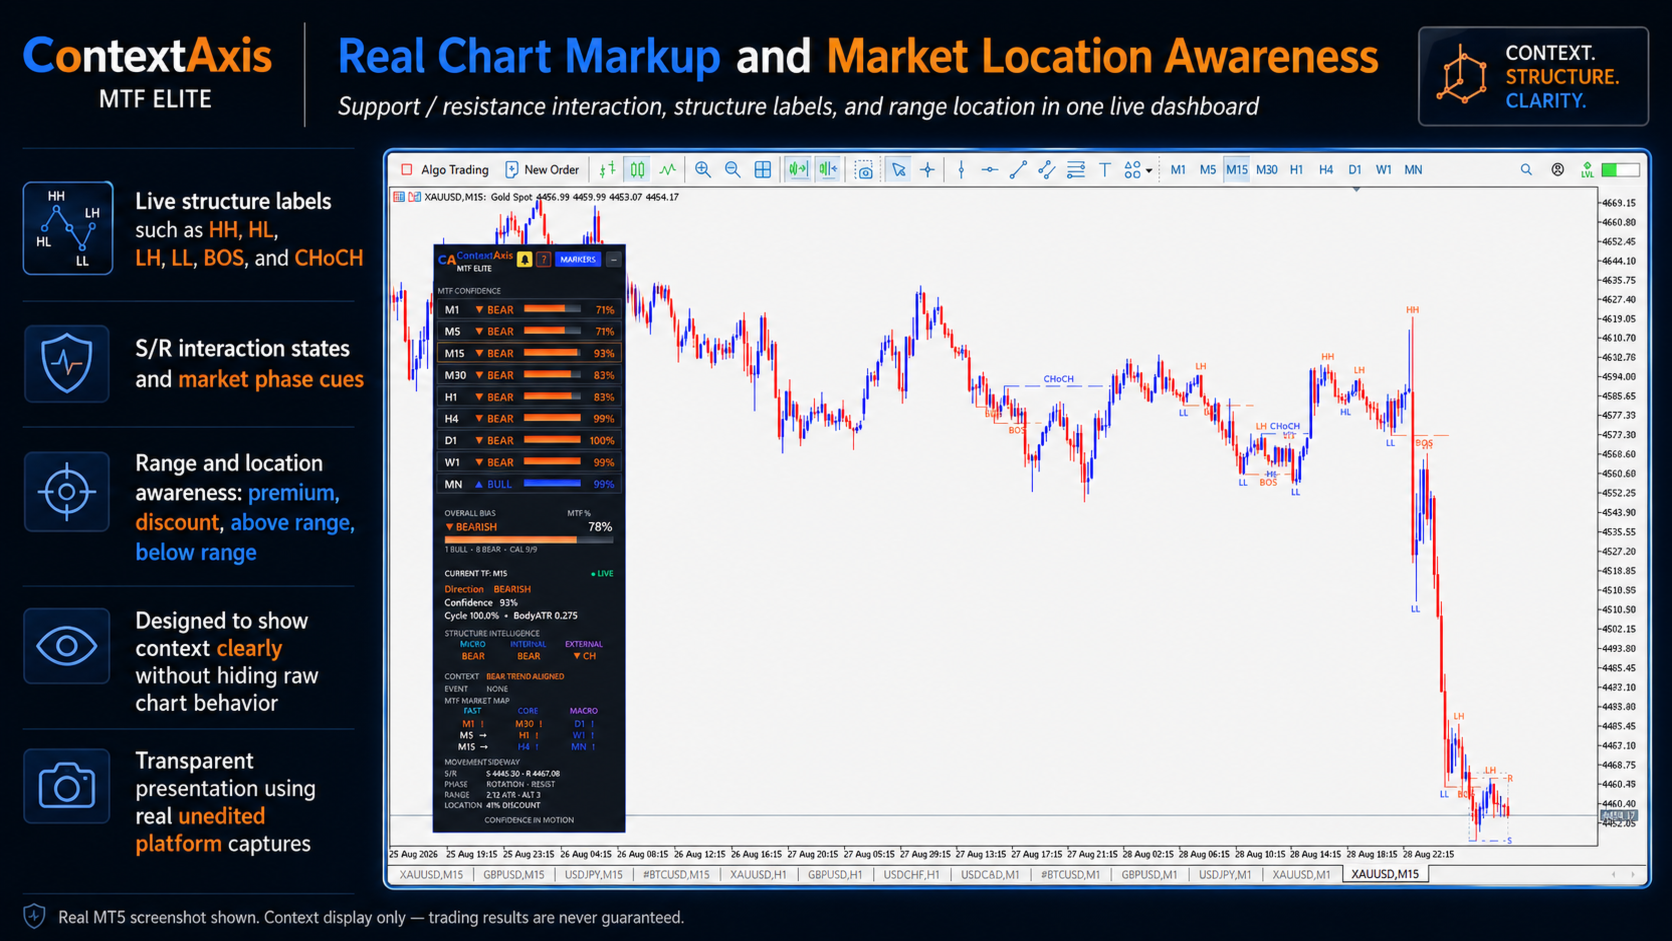
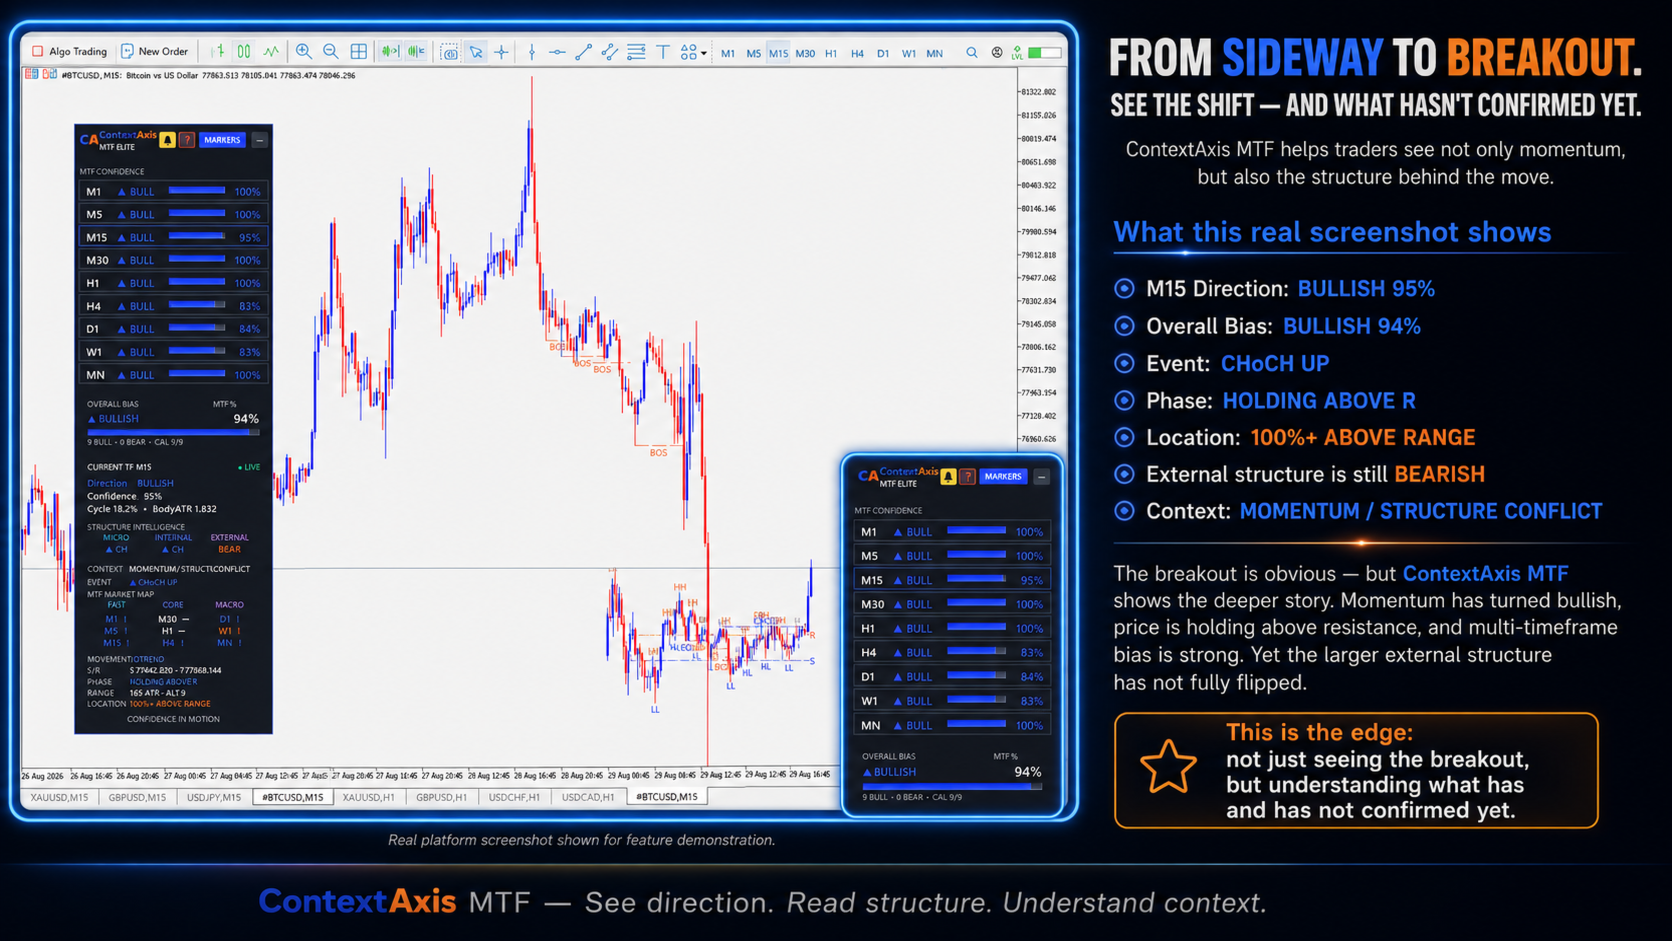
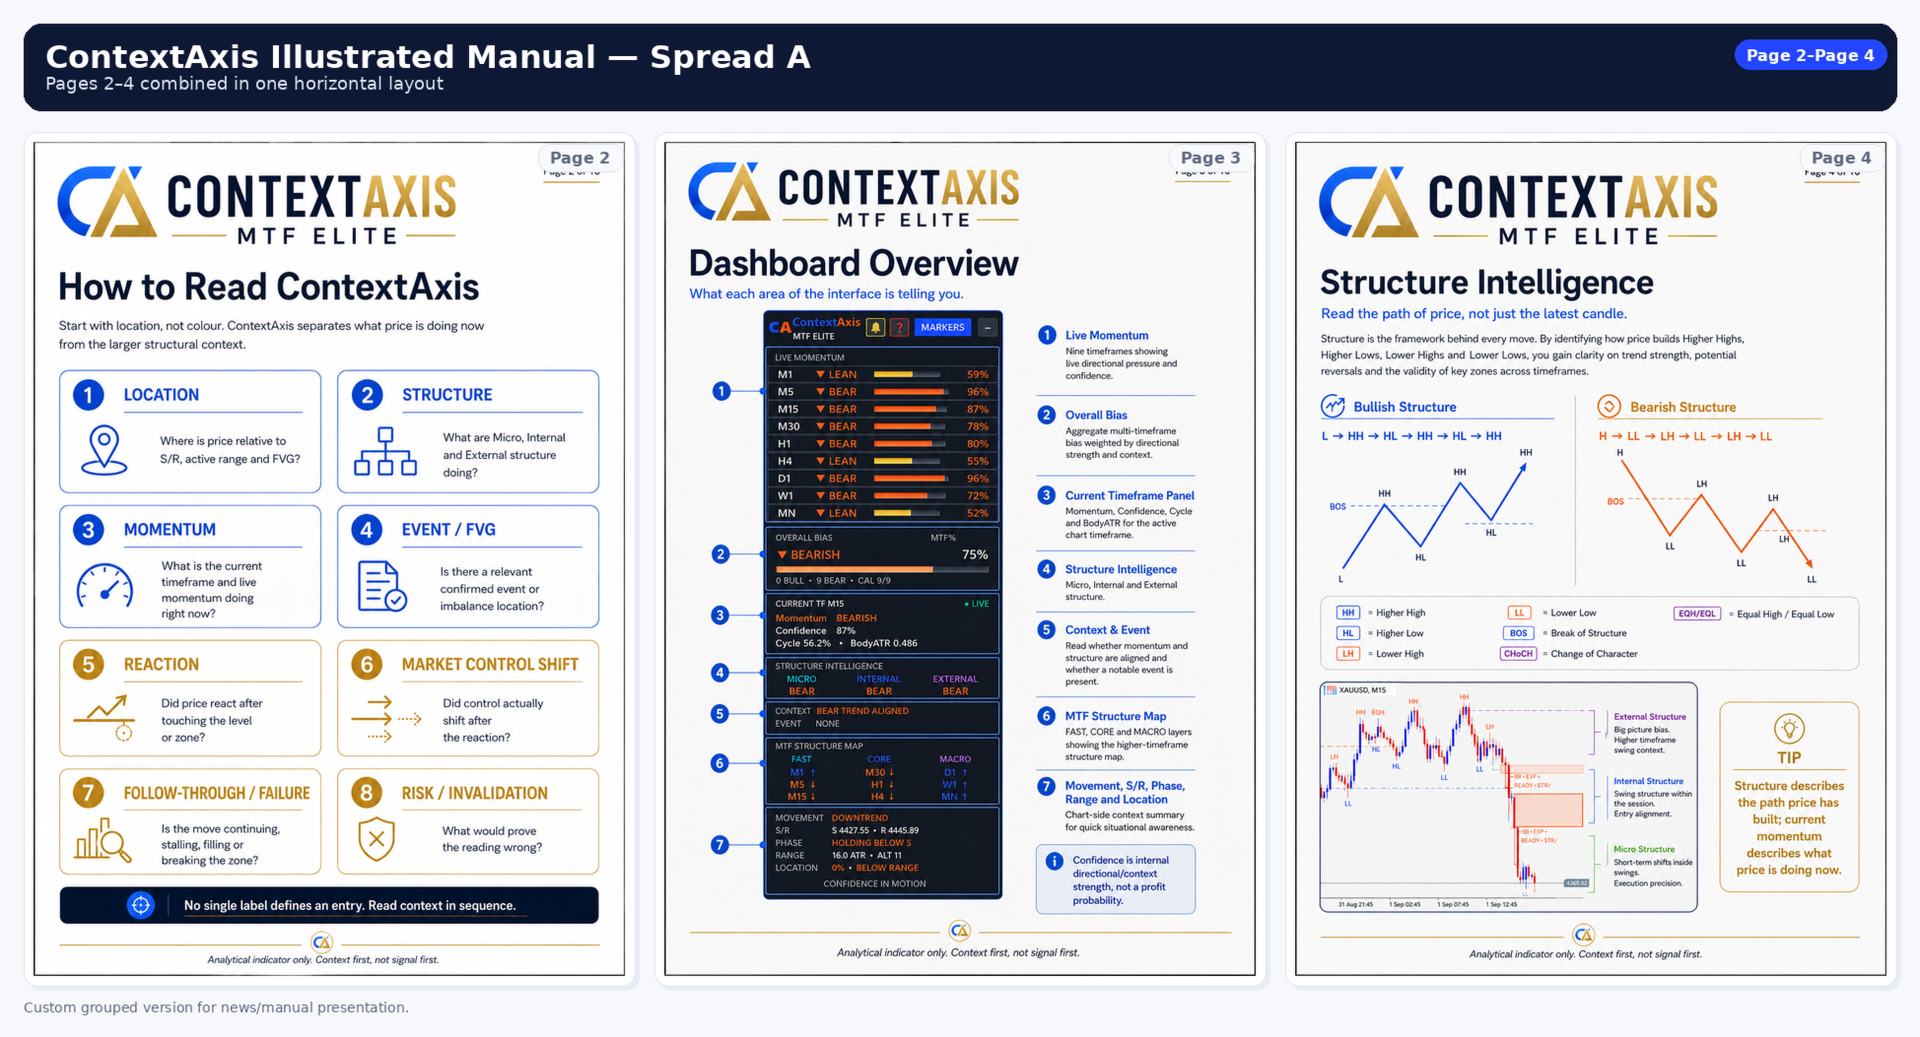
- Structure Intelligence: Multi-depth structure analysis using Micro, Internal and External views, supported by chart context including HH, HL, LH, LL, BOS, CHoCH, EQH and EQL.
- Multi-Timeframe Structure Map: Organizes structural context into FAST: M1/M5/M15, CORE: M30/H1/H4 and MACRO: D1/W1/MN. This allows short-term momentum and higher-timeframe structure to be read separately instead of forcing them into one signal.
- Momentum vs Structure Context: ContextAxis distinguishes current momentum from structural trend and can describe conditions such as Trend Aligned, Bull Pullback in Bear Structure, Bear Pullback in Bull Structure and Momentum / Structure Conflict.
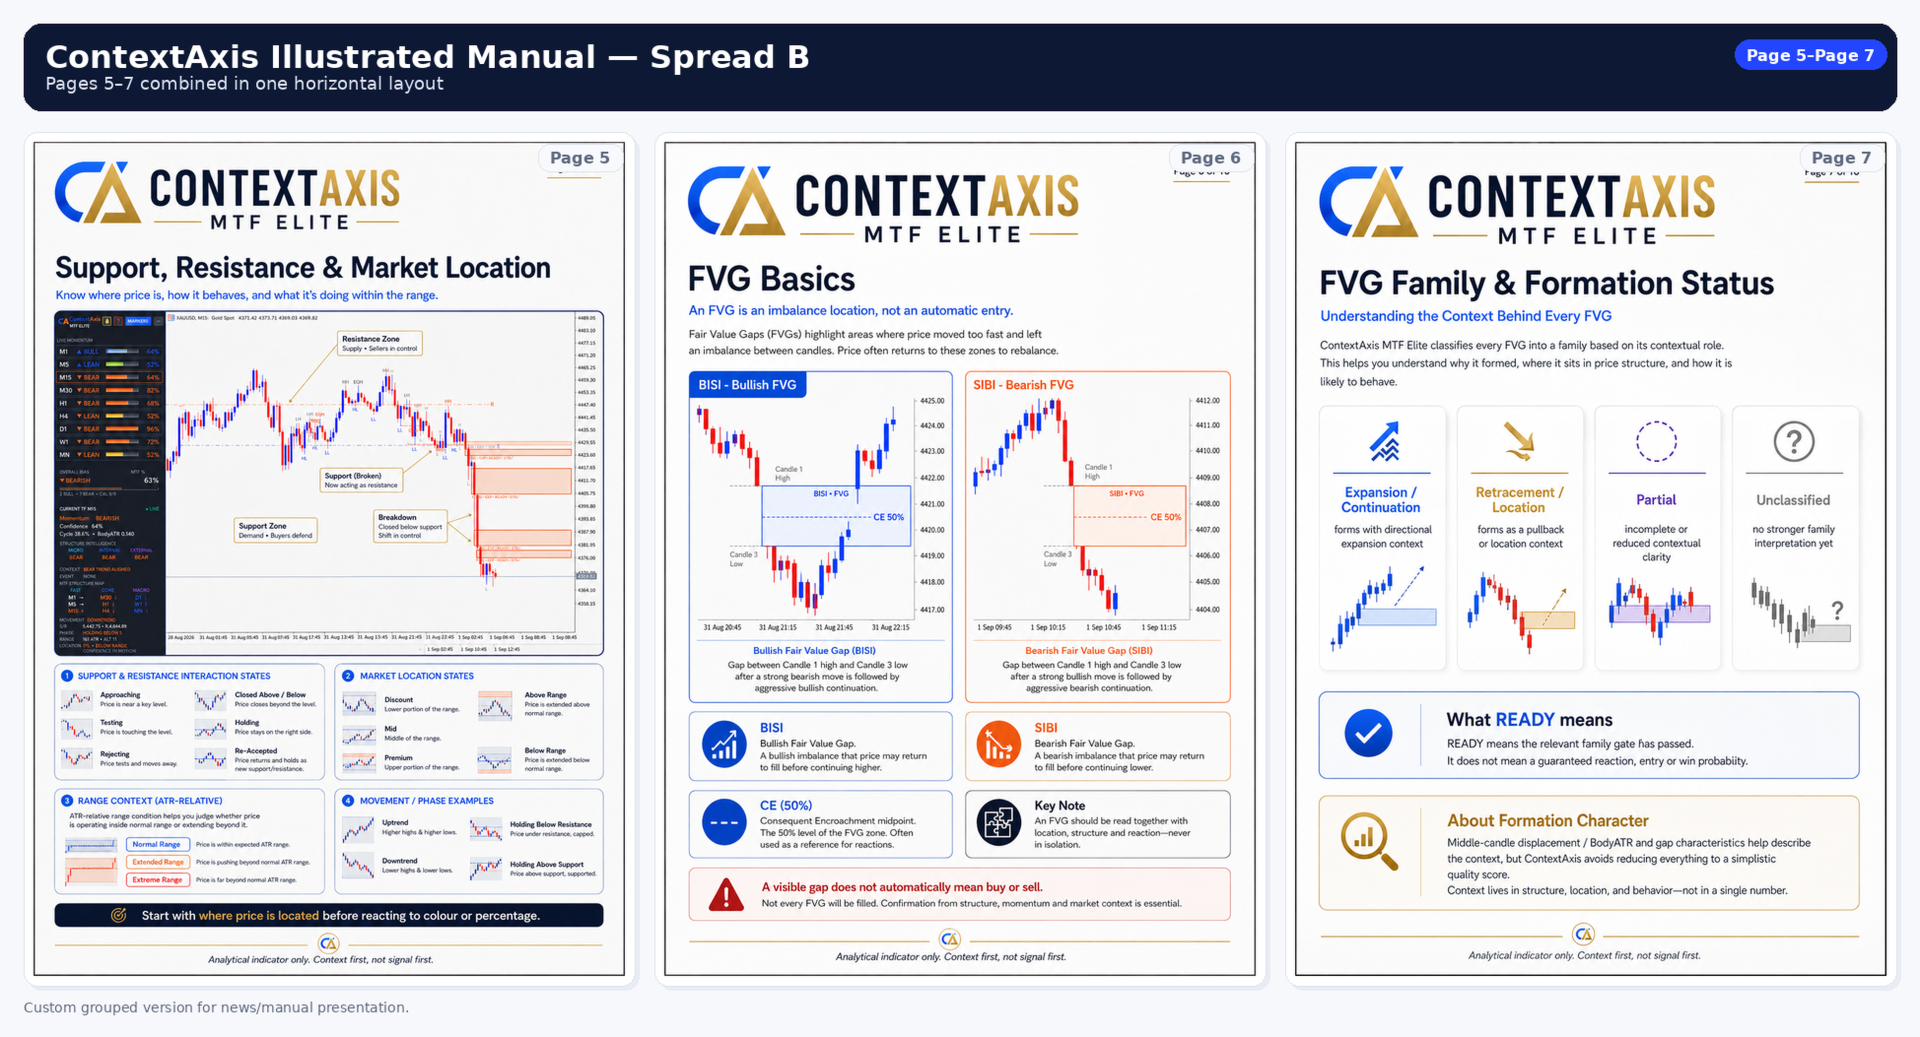
- Support & Resistance Context: Tracks relevant contextual S/R and interaction states including Approaching, Testing, Rejecting, Closed Above/Below, Holding and Re-Accepted.
- Market Phase, Range & Location: Provides ATR-relative range context together with market-state information and price location such as Discount, Mid, Premium, Above Range and Below Range.
Advanced FVG Intelligence
- BISI & SIBI Detection: Bullish and bearish Fair Value Gaps are detected from confirmed three-candle price geometry.
- FVG Family Classification: FVGs can be classified by formation context into Expansion / Continuation, Retracement / Location, Partial and Unclassified.
- READY Formation Status: READY means the relevant family gate has passed. It does not mean a guaranteed reaction, entry or win probability.
- Formation Character: ContextAxis evaluates formation characteristics such as middle-candle displacement / BodyATR and gap characteristics without turning them into a simplistic quality score.
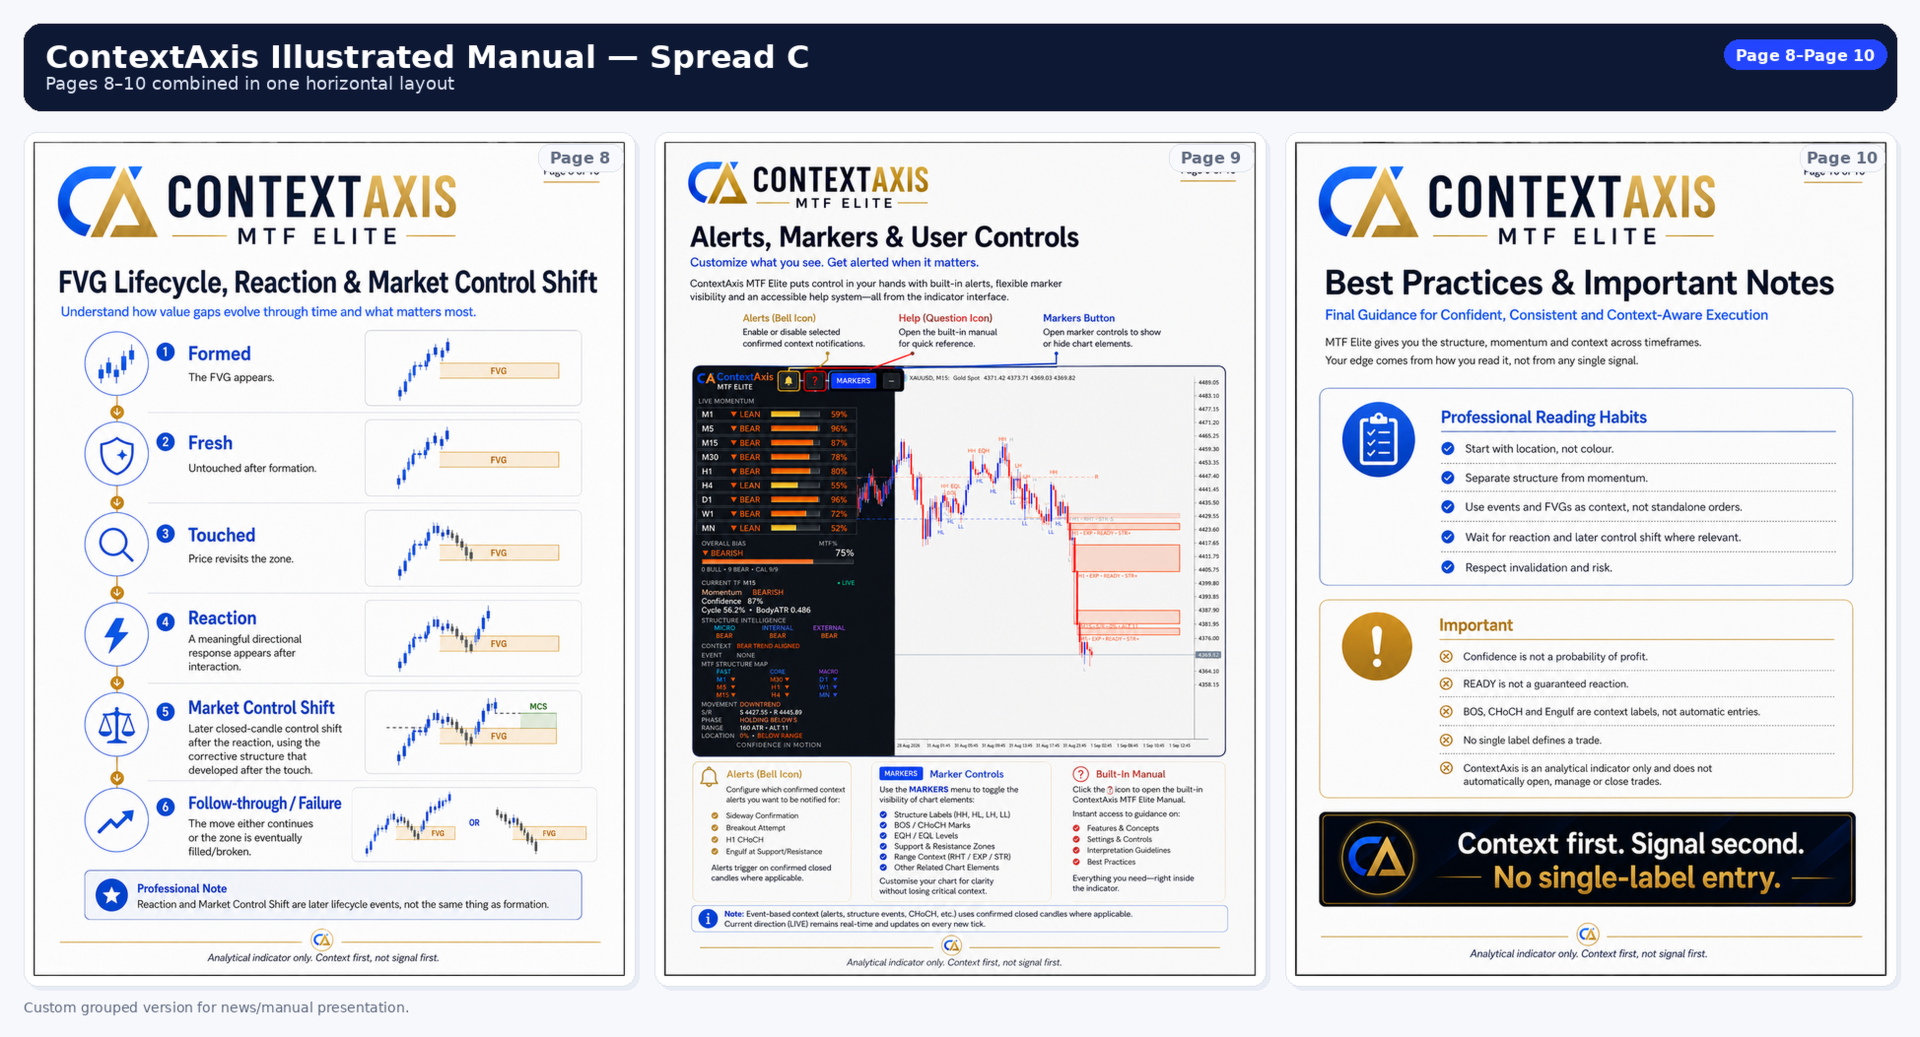
- FVG Lifecycle Tracking: Tracks what happens after formation instead of assuming the zone will hold: Formed → Fresh → Touched → Reaction → Market Control Shift → Follow-through / Failure.
- Reaction Confirmation: Reaction is treated as a later lifecycle event and requires confirmed directional price behaviour after interaction with the FVG.
- Market Control Shift: After Reaction, ContextAxis can identify a later closed-candle control shift using the corrective structure that developed after the interaction.
- Filled / Broken State: FVG lifecycle can distinguish continued interaction, mitigation, filling and closed-bar failure/break conditions.
- CE Reference: Consequent Encroachment, the 50% midpoint of the FVG, can be displayed as an internal reference level.
Confirmed Context Events
BOS — Break of Structure; CHoCH — Change of Character; EQH / EQL; Full-Range Engulf Context. Engulf uses the full candle range, including body and wick/shadow behaviour, and is treated as a closed-bar control/context event rather than a standalone trend definition or BUY/SELL signal.
Context Alerts
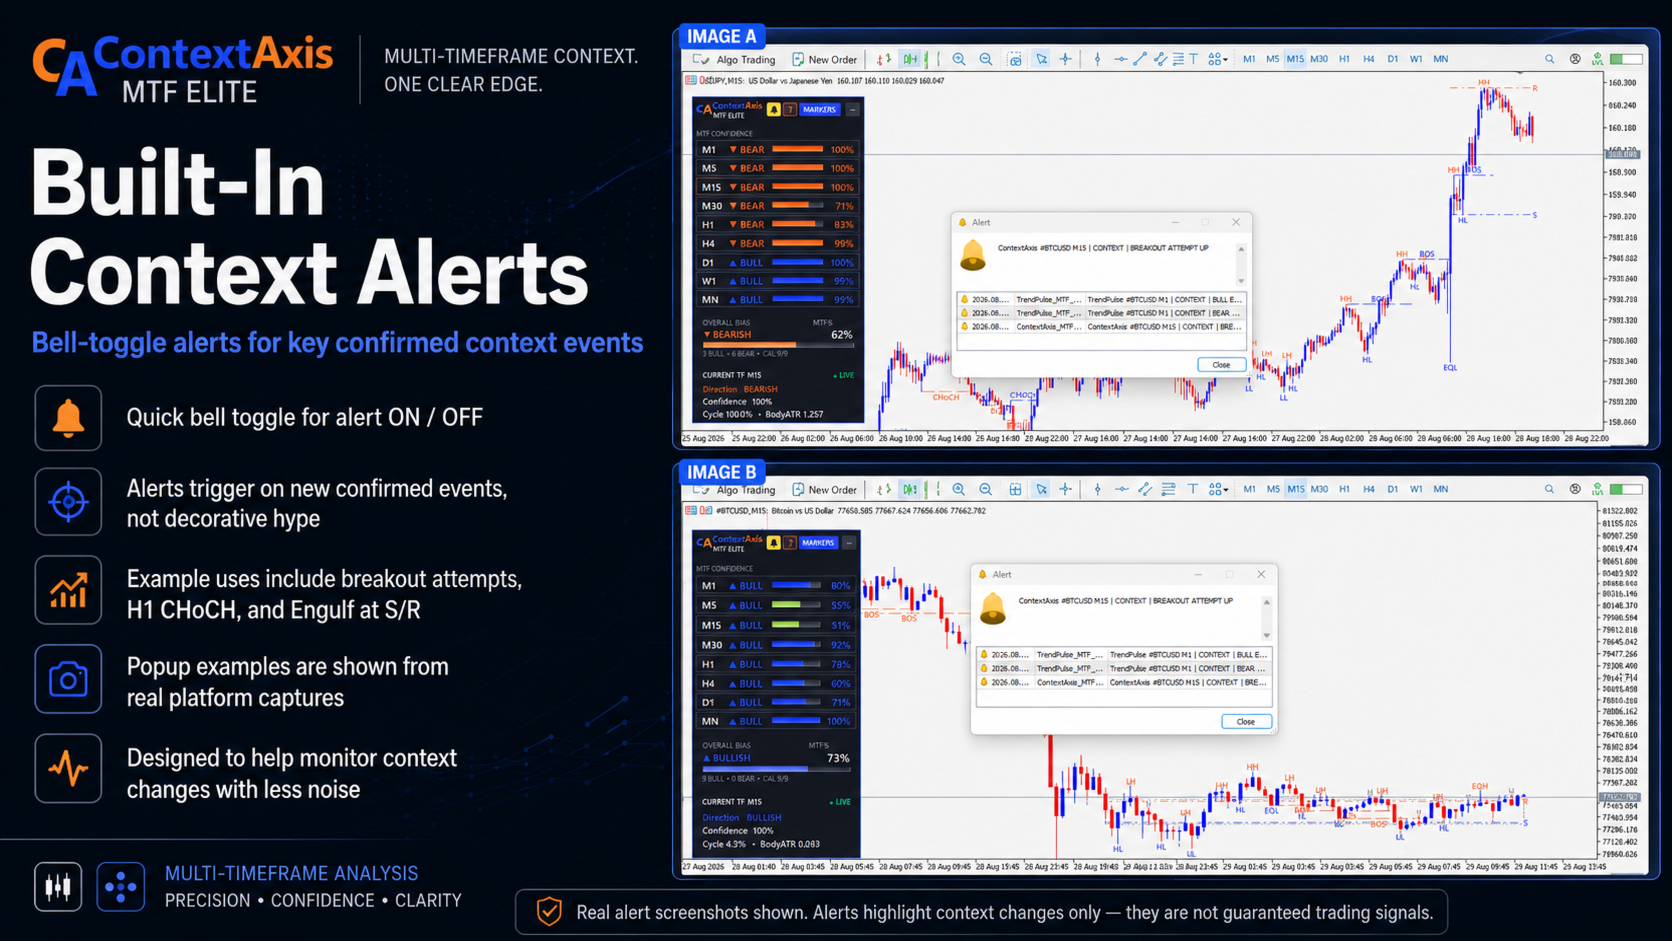
The dashboard alert control can enable or disable selected confirmed context notifications, including supported events such as Sideway confirmation, Breakout Attempt, H1 CHoCH and Engulf at Support / Resistance. Alerts are intended to bring attention to a change in context, not to instruct the user to enter a trade.
Flexible Chart & Marker Controls
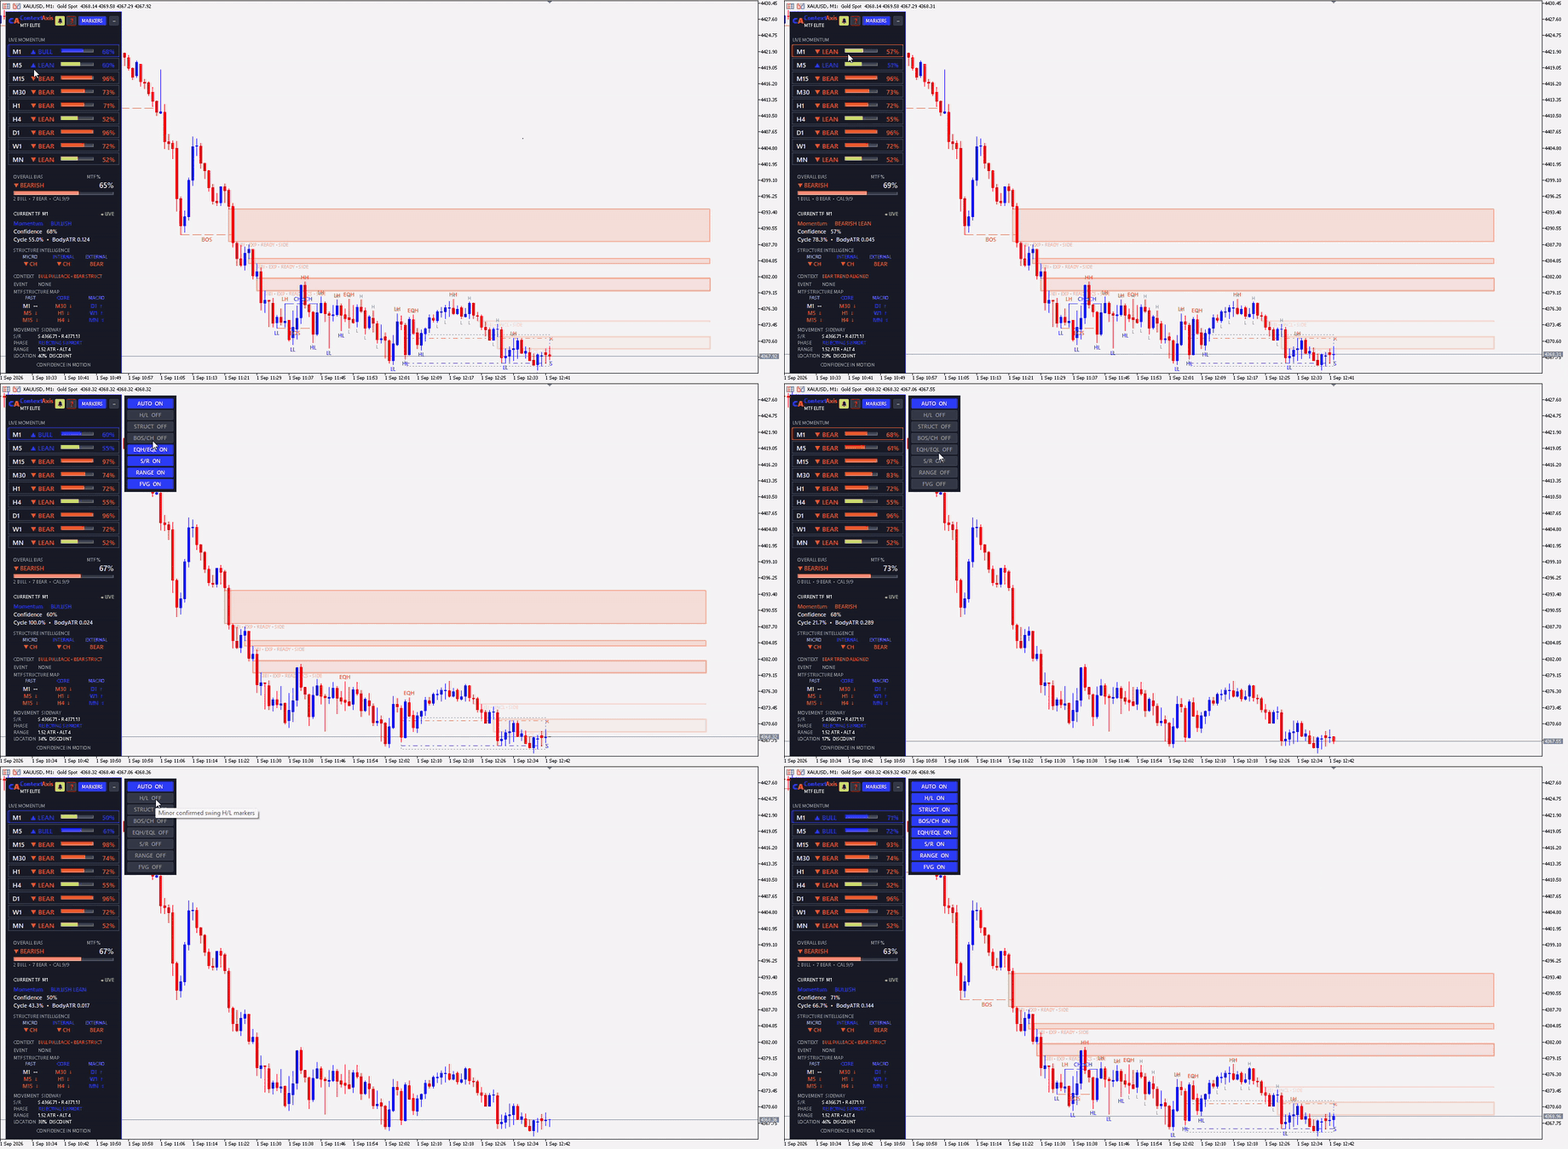
Users can control the visibility of Structure Intelligence, HH/HL/LH/LL, BOS/CHoCH, EQH/EQL, Support/Resistance, Range information, FVG display, FVG lifecycle visibility, CE midpoint, Filled/Broken zones and markers. Advanced engine parameters are also available for deliberate research or configuration testing, while default analytical settings are recommended for normal use.
Built-In User Manual
A built-in manual is available directly from the indicator interface, with support for multiple languages.
Context-First Analysis Workflow
Location → MTF Structure → Momentum → Event / Zone → Reaction → Market Control Shift → Follow-through / Failure → Risk / Invalidation
This workflow is intended to reduce the tendency to act on one colour, one percentage, one BOS, one CHoCH or one FVG in isolation. No single label is intended to define an entry by itself.
Event-based structural and lifecycle confirmations use closed candles where applicable, while current directional information remains live.
Important
Confidence, READY, BOS, CHoCH, Engulf, Reaction and Market Control Shift are analytical/context labels. They are not probabilities of profit and do not guarantee a future market outcome.
ContextAxis MTF Elite is an analytical and decision-support indicator only. It does not automatically open, manage or close trades, and it does not provide guaranteed BUY/SELL entries, Stop Loss or Take Profit levels.