Structural Range Engine
- Indicators
- Version: 1.0
- Activations: 10

Structural Range Engine
Market structure on up to five timeframes, computed on closed candles, drawn on one chart.The Structural Range Engine reads market structure the way a structure trader does. It finds the swing points, separates minor swings from the significant ones, marks every trading range that price breaks out of, tracks the imbalances inside those ranges and projects a retracement zone on the latest leg. It does this independently for up to five timeframes and keeps everything up to date as new candles close.
AN ORIGINAL STRUCTURE ALGORITHM
The Structural Range Engine is built on an original structure algorithm that has never been published before. It is not a variation of fractals or ZigZag. Classic fractals mark every candle whose high (or low) is more extreme than a fixed number of candles on each side - usually two. That has three consequences: every fractal is confirmed only after those extra candles have closed, all fractals carry the same weight, and a single outside candle can produce an up and a down fractal at the same time. The Structural Range Engine works differently:
- No fixed window: a swing point is confirmed as soon as price turns away from it, not after a set number of candles.
- Outside candles are resolved: a candle that breaks both sides of the current swing is held pending and assigned once price decides the direction.
- Hierarchy: minor swings (internal structure) and significant structure (external structure) are kept apart, and the external structure defines the trend.
- Context: the structure is turned into trading ranges with live states, imbalances and a retracement zone. Fractals stop at marking the points.
WHAT YOU SEE ON THE CHART
1. Internal structure
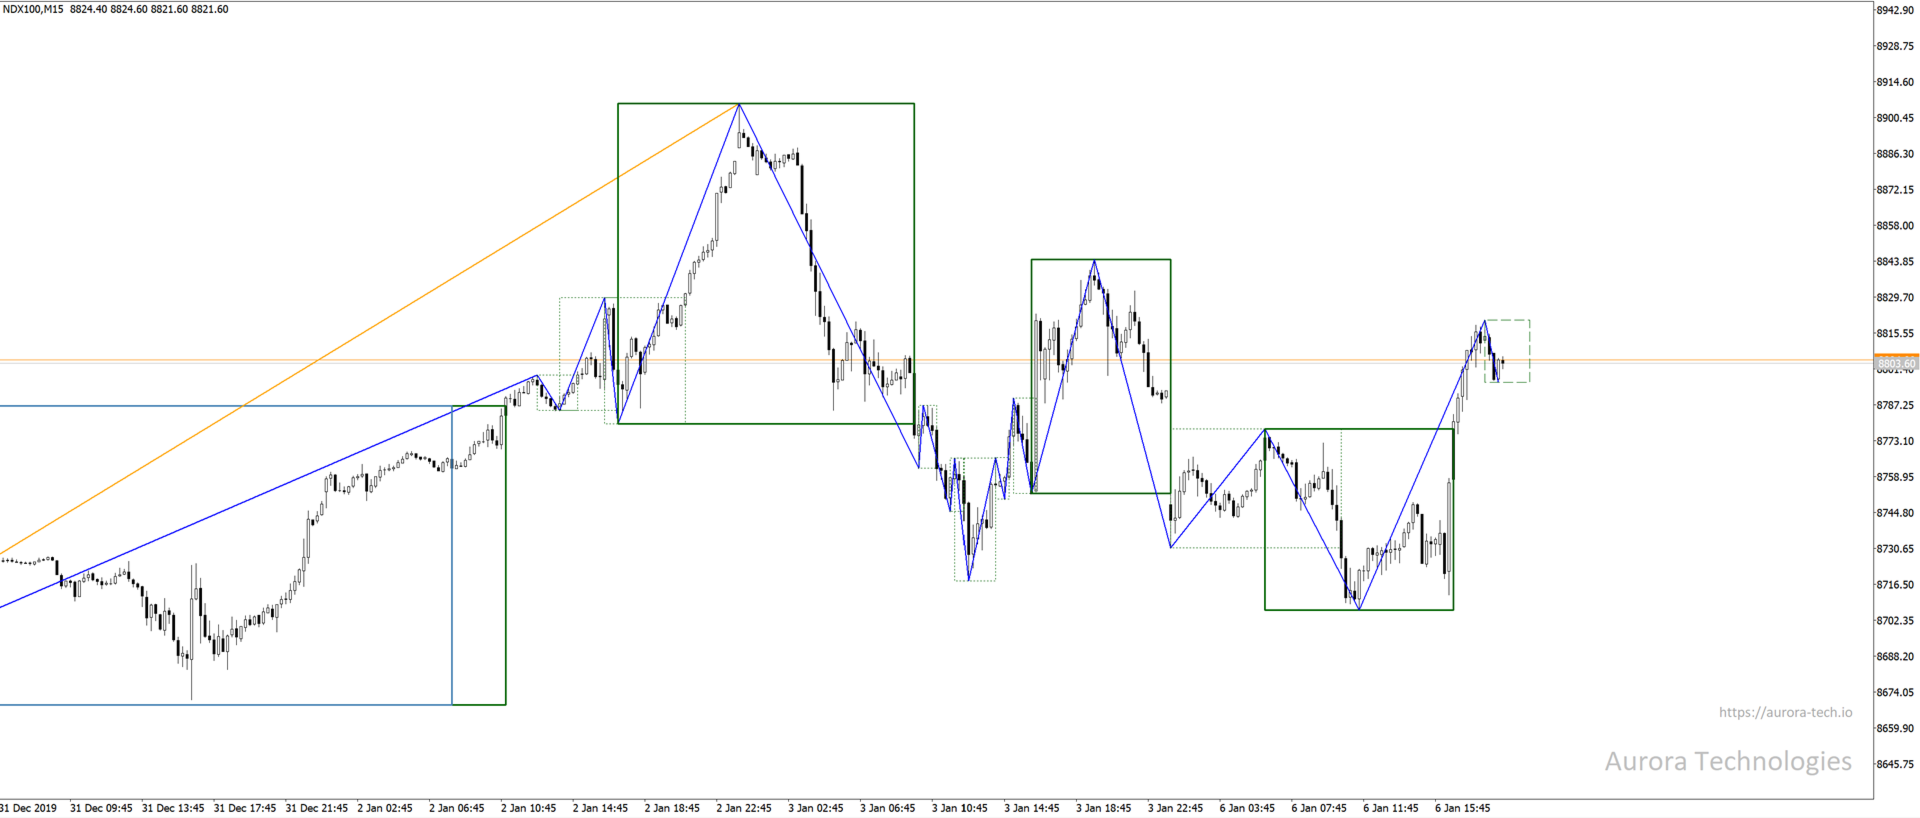
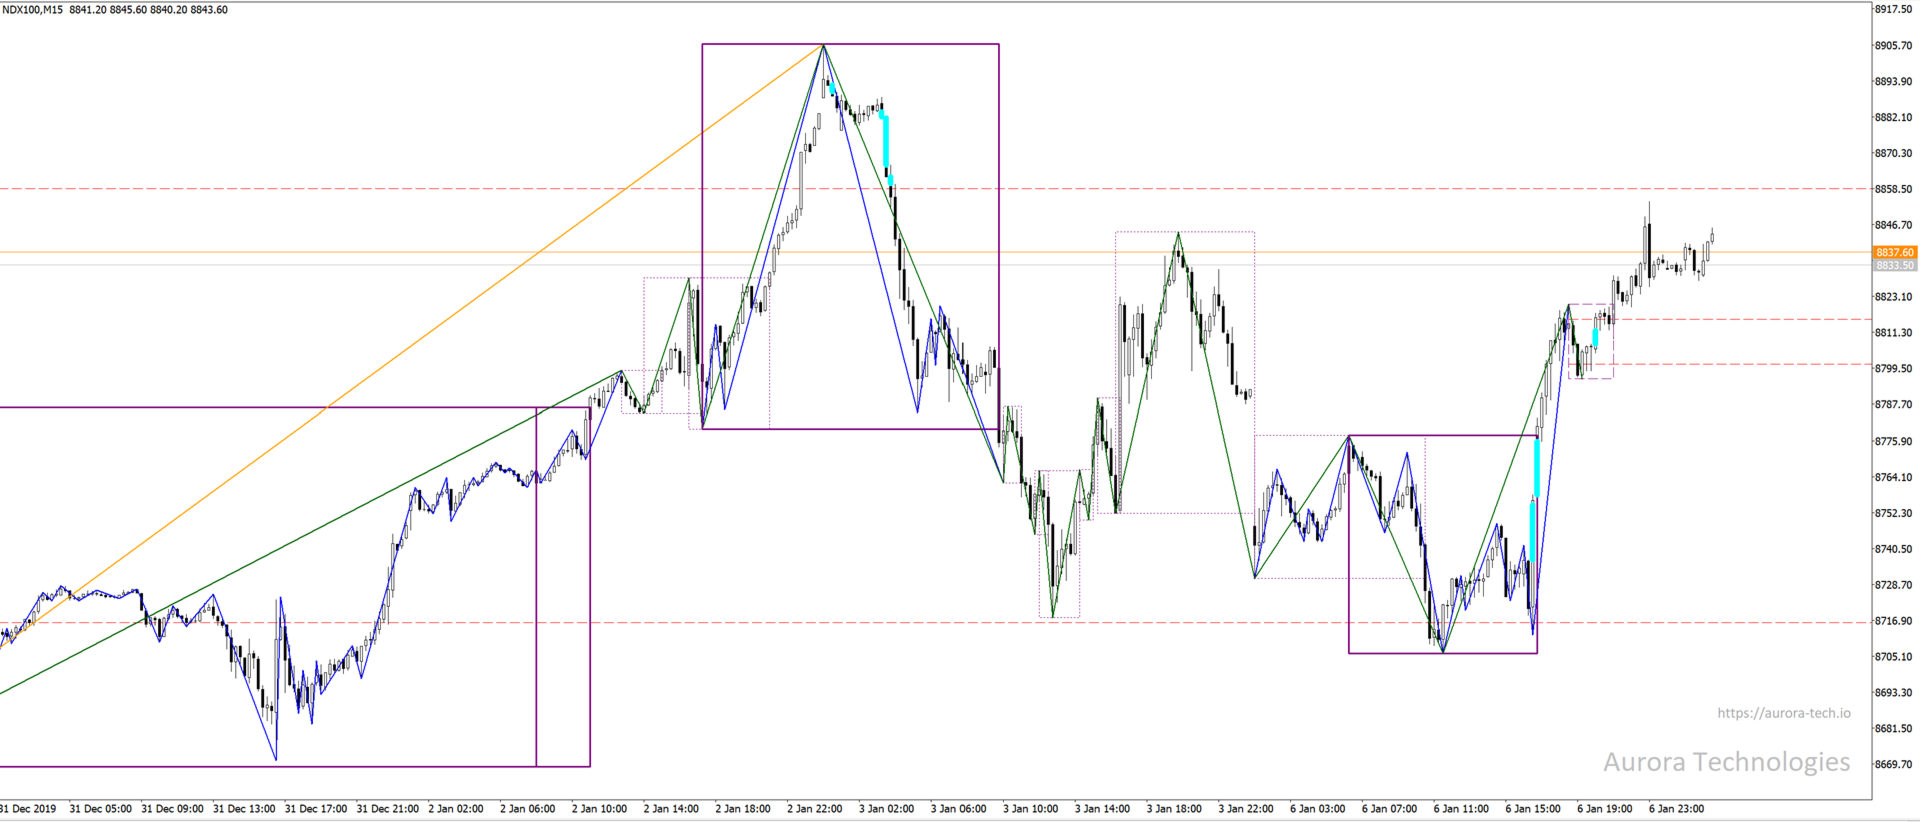
The sequence of swing highs and swing lows of the slot's timeframe, drawn as a zigzag. A swing high is a peak where price turned down, a swing low a trough where price turned up. The engine alternates between searching for a high and a low: a candle that extends the current swing moves it, a candle that turns away from it confirms it.
One case is handled explicitly: a candle that makes both a higher high and a lower low than the current swing point is ambiguous. The engine holds it pending until a later candle breaks it to one side, then corrects the affected swing points. This is the only situation in which drawn structure changes afterwards. The latest swing point is still developing and is drawn only once it is confirmed.
2. External structure
The significant structure built from the internal swings: higher highs (HH), higher lows (HL), lower highs (LH) and lower lows (LL). When price takes out the last external high, the lowest swing low between the two highs becomes the higher low that connects them (mirrored for lows). The direction of the latest external point is the trend of the slot. The move between the last two external points is called the latest leg.
3. CTR - Current Trading Ranges
A trading range is the price area a market moved through before breaking out of it. Every time price breaks an external structure point, a range box is created: horizontally from that structure point to the candle that broke it, vertically between that point and the opposite swing. A break upwards creates an up-range, a break downwards a down-range.
An MPR is a reversal range: a range that formed against the prevailing external trend.
Each box keeps the color of its timeframe. Its state is shown by the border style:
- Solid: active range
- Extra thick: MPR (reversal range)
- Dashed: inefficient - the range lies entirely beyond the previous range, so the move left no overlap with it
- Dotted: no longer valid - a closed candle traded back through the far edge of the box: below the bottom of an up-range, or above the top of a down-range
Solid boxes are the ranges still in play; dashed and dotted boxes are resolved history. Hover over any box to see its timeframe and state in the tooltip.
4. Imbalances
Three-candle gaps inside each range, also known as fair value gaps (FVG): in an up-range, the gap between the high of the first candle and the low of the third; mirrored in a down-range. They are drawn as vertical lines. An imbalance is removed as soon as a closed candle has traded through the whole gap.
5. Fibonacci zone
Two dashed levels on the latest leg of each slot, at configurable percentages (default 0.20 and 0.80 of the leg). The levels start at the leg and extend to the right only - they never run across old history - and move to the new leg as the structure develops.
HOW TO USE IT
- Put the timeframe you take direction from into one slot and your execution timeframe into another. The external structure and trend of the higher slot give the context; the internal structure of the lower slot shows where the current move is pulling back to.
- Solid range boxes and open imbalances mark the areas price has not resolved yet. The Fibonacci zone shows the retracement band of the current leg.
- Slot timeframes are independent of the chart timeframe: you can follow M15 structure on an H1 chart, or H4 structure on an M5 chart.
- On busy charts, switch off internal structure and imbalances on the higher slots and keep the full detail on your execution timeframe.
NON-REPAINTING BEHAVIOR
Repainting means an indicator changes or removes signals it has already shown, so its history looks better than what you saw live. The Structural Range Engine evaluates every timeframe on completed candles only. The forming candle is never used, so nothing changes intrabar, and the chart after a terminal restart or a timeframe switch is identical to the chart you watched live. Structure moves forward as new candles close; confirmed points change afterwards only in the documented case of a pending outside candle described above.
FOR EA DEVELOPERS
Buffers 0-4 hold the external trend of slots 1-5 as of their last closed candle: +1 = up, -1 = down, 0 = slot disabled or no structure yet. Read the current value at shift 0 with CopyBuffer, for example:
int handle = iCustom(_Symbol, _Period, "Market\\Structural Range Engine");
double trend[1];
if(CopyBuffer(handle, 2, 0, 1, trend) == 1)
   Print("External trend of slot 3: ", trend[0]);
The buffers carry the current state for live trading and for the Strategy Tester. They do not contain a back-filled trend history for bars that were loaded before the indicator started.
INPUTS
Historical Data
- Bars back to calculate (per timeframe): 50 to 50,000, default 1,000
Fibonacci Zone
- Show Fibonacci zone, lower and upper boundary (0.0 to 1.0), line color
Timeframe 1 to 5 (identical for every slot)
- Enable slot, timeframe
- Show and color: internal structure, external structure, CTR, imbalances
- Defaults: slot 1 (M15) and slot 3 (H4) enabled; slot 2 (H1), slot 4 (D1) and slot 5 (W1) disabled
IMPORTANT NOTES
- A disabled slot computes and draws nothing. If two enabled slots use the same timeframe, the second one is ignored and a message is written to the journal.
- If the history of a slot's timeframe is not loaded yet, the indicator waits and builds that slot automatically as soon as the data is available.
- The indicator has no built-in alerts and does not open trades. It is an analysis tool that identifies and displays market structure; it does not predict prices and does not promise profits.
- Try the free demo in the Strategy Tester (visual mode) before purchasing.
This is not financial advice! This is a realtime indicator and doesn't repaint.