• Overview
  • Reviews
  • Comments
  • What's new

NakaSide

Introducing NakaSide - Your Ultimate Market Opportunities Indicator!

Are you tired of missing out on profitable trading opportunities? Are you ready to take your trading to the next level? Look no further, because NakaSide is here to revolutionize the way you trade!

NakaSide isn't just another run-of-the-mill indicator; it's your secret weapon for navigating the complex world of financial markets with confidence and precision. With its advanced algorithms and cutting-edge technology, NakaSide is designed to detect trend changes and uncover lucrative opportunities in both bullish and bearish markets.

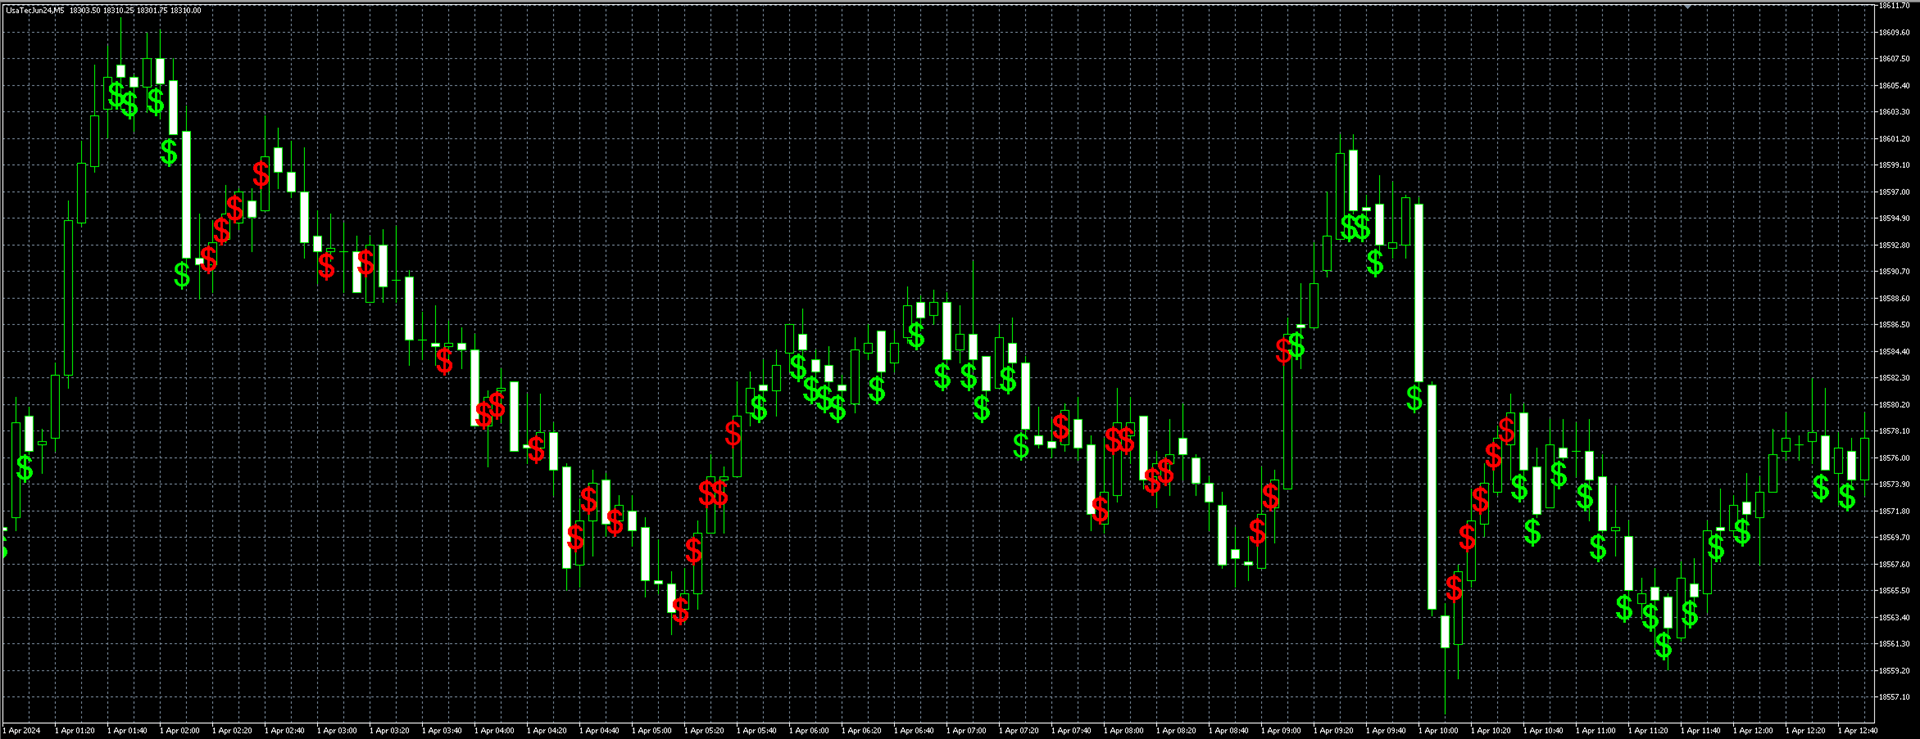
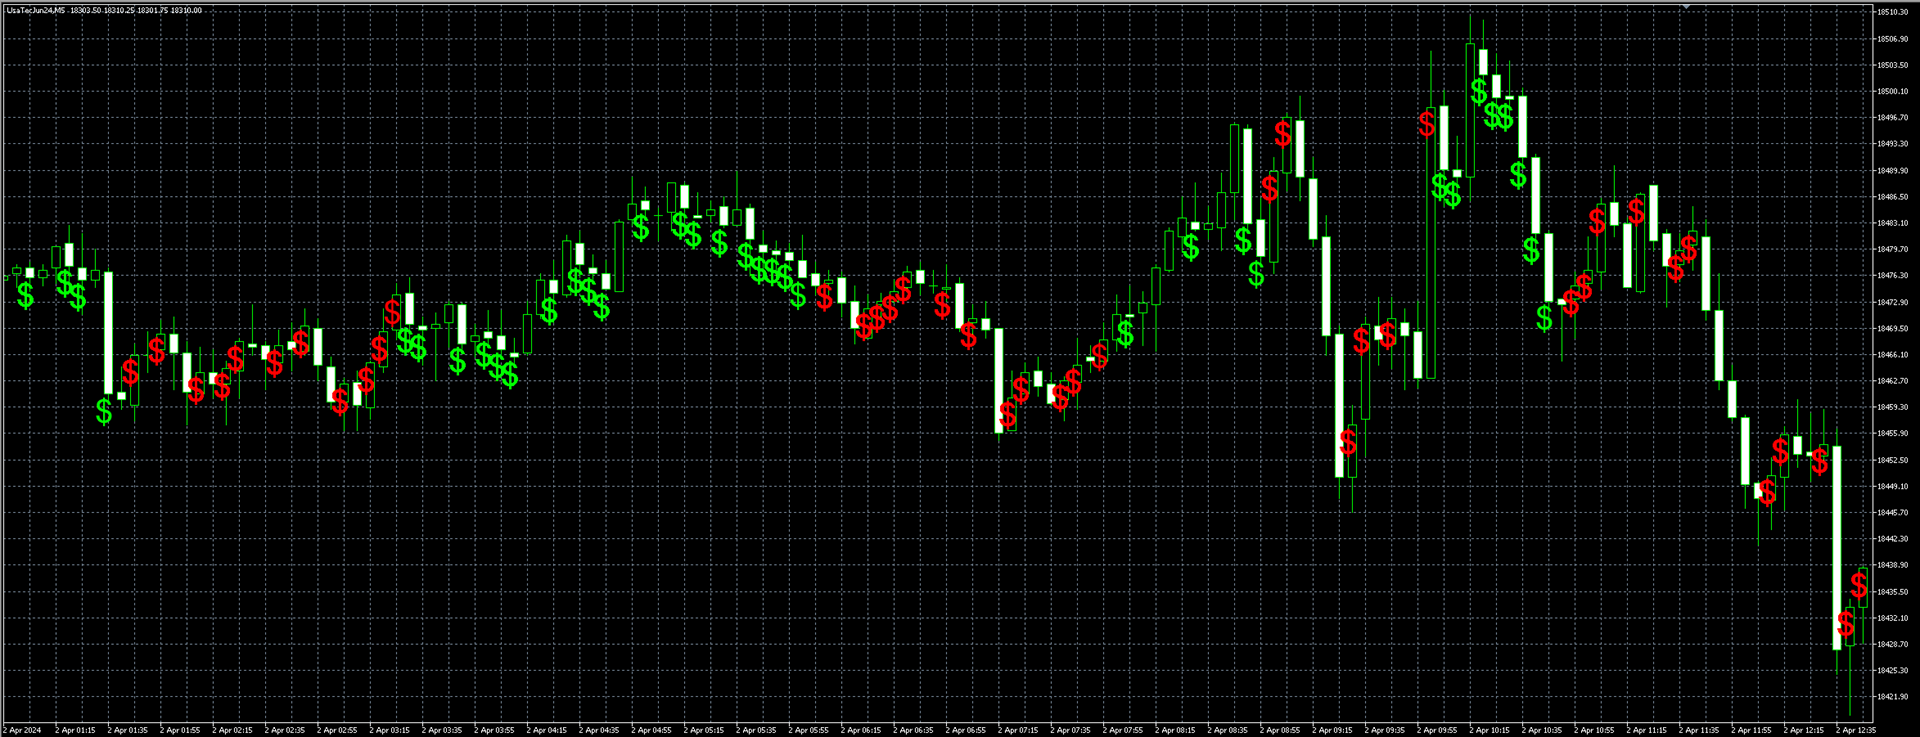
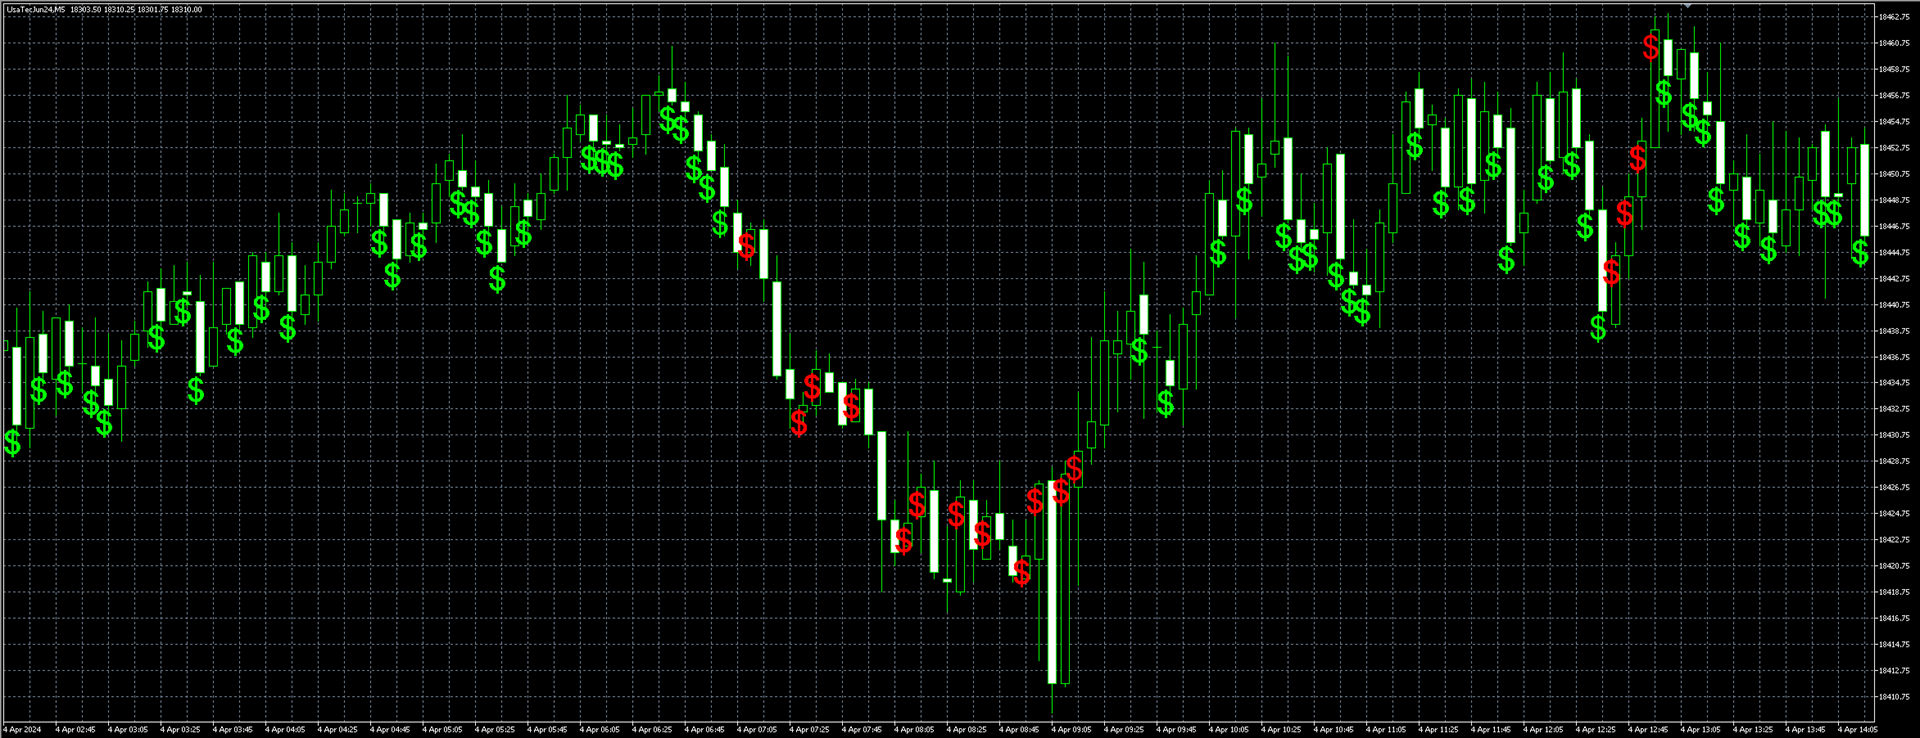
When NakaSide detects a shift towards an upward trend, it signals with a vibrant green dollar sign, indicating a potential buying opportunity. Conversely, if the trend reverses direction, a striking red dollar sign appears, signaling a potential selling opportunity.

But here's where NakaSide truly sets itself apart: it doesn't just stop at identifying trends. In sideways markets, where others may struggle, NakaSide shines brightest, sprinkling multiple dollar signs across the chart, indicating numerous potential entry points. This means more opportunities for you to capitalize on market movements, whether the trend is up, down, or sideways!

But that's not all - NakaSide gives you the flexibility to take control of your trades by allowing manual order entry. Whether you're executing a buy or sell order, simply follow the cues - green for buy, red for sell - and seize the moment to enter the market with confidence.

It's important to remember that while NakaSide provides valuable insights and signals, the decision to enter or exit a trade ultimately rests with you. That's why it's crucial to exercise sound risk management practices and implement a well-thought-out strategy. After all, success in trading isn't just about making trades; it's about managing risk effectively and staying disciplined in your approach.

With NakaSide by your side, you'll gain an edge in the markets like never before. Whether you're a seasoned trader or just starting out, NakaSide offers a wealth of opportunities to maximize your profits and achieve your financial goals.

Don't let another opportunity pass you by. Embrace the power of NakaSide and unlock a world of endless possibilities in trading today!
Recommended products
Noize Absorption Index - is the manual trading system that measures the difference of pressure between bears forces and bulls forces. Green line - is a noize free index that showing curent situation. Zero value of index shows totally choppy/flat market.Values above zero level shows how powerfull bullish wave is and values below zero measures bearish forces.Up arrow appears on bearish market when it's ready to reverse, dn arrow appears on weak bullish market, as a result of reverse expectation.
Was: $249  Now: $99   Market Profile defines a number of day types that can help the trader to determine market behaviour. A key feature is the Value Area, representing the range of price action where 70% of trading took place. Understanding the Value Area can give traders valuable insight into market direction and establish the higher odds trade. It is an excellent addition to any system you may be using. Inspired by Jim Dalton’s book “Mind Over Markets”, this indicator is designed to suit the
Trading Utility for Forex Currency Pairs Only not for Gold  Functions Auto Lot Calculation based on Risk Auto stoploss  Auto TakeProfit Breakeven Auto Close Half % Close in percentage with respect to the PIPs Pending Orders BuyLimit Sell Limit with distances BuyStop Sell Stop    with distances Trading Informations Risk in percentage For Multiple trades Combine Takeprofit and Combine Stoplosses
Your Trend Friend
Luigi Nunes Labigalini
The trend is your friend! Look at the color of the indicator and trade on that direction. It does not  repaint. After each candle is closed, that's the color of the trend. You can focus on shorter faster trends or major trends, just test what's most suitable for the symbol and timeframe you trade. Simply change the "Length" parameter and the indicator will automatically adapt. You can also change the color, thickness and style of the lines. Download and give it a try! There are big movements
The best time to trade Using this Indicator is when the time reach exactly hour,half,45 minutes,15 minutes and sometimes 5 minutes.. This indicators is helpful to those who trade boom and crash indecies.How to read this indicator first you'll see Blue allow and Red allow all these allows used to indicate or to detect the spike which will happen so the allow happens soon before the spike happen.This indicator works properly only in boom and crash trading thing which you have to consider when
Volality Index Scalper
Lesedi Oliver Seilane
Volality Index scalper indicator  Meant for Volality pairs such as Volality 10, 25, 50, 75 and 100 The indicator works on all timeframes from the 1 minute to the monthly timeframe the indicator is non repaint the indicator has 3 entry settings 1 color change on zero cross 2 color change on slope change 3 color change on signal line cross Orange line is your sell signal Blue line is your buy signal.
The indicator automatically calculates and plots Fibonacci support and resistance levels - one of the most effective tools for market analysis. The calculation uses the averaged price data for the selected period and timeframe. The minimum and maximum for this period are taken as the beginning and end of the movement. Fibonacci levels allow you to see potential reference points, around which the price movement can slow down or reverse, that is, they are used to predict further movement, as well
Mine Farm
Maryna Kauzova
5 (1)
Mine Farm is one of the most classic and time-tested scalping strategies based on the breakdown of strong price levels. Mine Farm is the author's modification of the system for determining entry and exit points into the market... Mine Farm - is the combination of great potential with reliability and safety. Why Mine Farm?! - each order has a short dynamic Stop Loss - the advisor does not use any risky methods (averaging, martingale, grid, locking, etc.) - the advisor tries to get
Premium level is a unique indicator with more than 80% accuracy of correct predictions! This indicator has been tested for more than two months by the best Trading Specialists! The author's indicator you will not find anywhere else! From the screenshots you can see for yourself the accuracy of this tool! 1 is great for trading binary options with an expiration time of 1 candle. 2 works on all currency pairs, stocks, commodities, cryptocurrencies Instructions: As soon as the red ar
US30NinjaMT5
Satyaseelan Shankarananda Moodley
US30 Ninja is a 5 minute scalping indicator that will let know you when there is a trade set up (buy or sell). Once the indicator gives the trade direction, you can open a trade and use a 30 pip stop loss and a 30 pip to 50 pip take profit. Please trade at own own risk. This indicator has been created solely for the US30 market and may not yield positive results on any other pair. 
You can change the time period of the chart at the touch of a button. You can also change multiple charts at the touch of a button. You can also change multiple charts at the touch of a button,   saving you the trouble of changing time periods. We are live-streaming the actual operation of the system. Please check for yourself if it is usable. Please check it out for yourself. https://www.youtube.com/@ganesha_forex We do not guarantee your investment results. Investments should be made at y
PZ Trend Trading MT5
PZ TRADING SLU
3.67 (3)
Trend Trading is an indicator designed to profit as much as possible from trends taking place in the market, by timing pullbacks and breakouts. It finds trading opportunities by analyzing what the price is doing during established trends. [ Installation Guide | Update Guide | Troubleshooting | FAQ | All Products ] Trade financial markets with confidence and efficiency Profit from established trends without getting whipsawed Recognize profitable pullbacks, breakouts and early reversals The ind
Before installing the HeatMap indicator make sure you are using a broker that gives you access to the Depth of market (DOM) !! This indicator creates a heatmap on your chart allowing you to see the buy or sell limit orders easily and in real time. You have the possibility to change the setting and the colors of the HeatMap in order to adapt to all markets and all charts. Here is an example of a setting you can use with the NASDAQ100 on the AMPGlobal broker :  https://www.youtube.com/watch?v=x0
Market Profile MetaTrader System  — is a classic Market Profile implementation that can show the price density over time, outlining the most important price levels, value area, and control value of a given trading session. This indicator can be attached to timeframes between M1 and D1 and will show the Market Profile for daily, weekly, monthly, or even intraday sessions. Lower timeframes offer higher precision. Higher timeframes are recommended for better visibility. It is also possible to use a
This is an MTF indicator of support and resistance levels based on Advanced ZigZag Dynamic and/or Extended Fractals indicator extremums with price labels (can be disabled). More higher TFs can be selected for MTF mode. By default, the levels are generated based on ZigZag indicator dots. Fractals indicator dots can also be used together with ZigZag or instead of it. In order to simplify the use and save CPU time, calculation is performed once per each bar at its opening. Parameters: ForcedTF - ch
Snipeer2
Ignacio Agustin Mene Franco
Sniper2 , It has points of lines, with colors that are showing you an entrance, that work as support and resistance! green dotted lines green shows entry for sale, the red dotted lines show a buy entry, pay attention to the supports that work as a break to catch long candles in a longer period of time. works for forex all pairs works for synthetic indices all pairs ! indicator on sale!
One of the number sequences is called "Forest Fire Sequence". It has been recognized as one of the most beautiful new sequences. Its main feature is that this sequence avoids linear trends, even the shortest ones. It is this property that formed the basis of this indicator. When analyzing a financial time series, this indicator tries to reject all possible trend options. And only if he fails, then he recognizes the presence of a trend and gives the appropriate signal. This approach allows one t
GapFinder Pro - Unleashing Market Opportunities Discover and capitalize on market gaps with precision using GapFinder Pro, the ultimate MetaTrader 5 indicator designed for novice and astute traders. Unveil hidden opportunities in the market and elevate your trading strategy with this powerful tool. Key Features: Any Currency! Any Time-Frame! Gap Detection and Visualization: Identify market gaps effortlessly with a visual representation on your MetaTrader 5 chart. Instantly recognize gaps, painte
Magic Finger can help you identify trends and trading opportunities clearly. The finger points to the open position signal, and the discoloration line is confirmed by the trend. If you are a day trader, you can choose to trade during a period of active trading, referring to the discoloration line as the basis for the next order, finger signal as a filter. If you are a trend trader, you can choose a period above H1, wait for the appearance of the finger signal in the key price area, and enter
Owl Smart Levels MT5
Sergey Ermolov
4.49 (37)
MT4 version  |   FAQ The Owl Smart Levels Indicator is a complete trading system within the one indicator that includes such popular market analysis tools as Bill Williams' advanced fractals , Valable ZigZag which builds the correct wave structure of the market, and Fibonacci levels which mark the exact levels of entry into the market and places to take profits. Detailed description of the strategy Instructions for working with the indicator Advisor-assistant in trading Owl Helper Private User
Market profile was developed by Peter Steidlmayer in the second half of last century. This is a very effective tool if you understand the nature and usage. It's not like common tools like EMA, RSI, MACD or Bollinger Bands. It operates independently of price, not based on price but its core is volume. The volume is normal, as the instrument is sung everywhere. But the special thing here is that the Market Profile represents the volume at each price level. 1. Price Histogram The Price Histogram
Highlights trading sessions on the chart The paid version of the Trading Sessions Indicator Free product with the possibility of customizing the start/end of sessions. Trading Sessions Indicator highlights the starts and ends of each trading sessions. [OPTIONS:] Asian session Open Asian session Close Asian session OpenSummertime Asian session CloseSummertime European session Open European session Close European session Open European session Close Timeshift Please use M15-H2 timeframes f
Laguerre SuperTrend Clouds   adds an Adaptive Laguerre averaging algorithm and alerts to the widely popular SuperTrend indicator. As the name suggests,   Laguerre SuperTrend Clouds (LSC)   is a trending indicator which works best in trendy (not choppy) markets. The SuperTrend is an extremely popular indicator for intraday and daily trading, and can be used on any timeframe. Incorporating Laguerre's equation to this can facilitate more robust trend detection and smoother filters. The LSC uses the
HMA Trend Professional MT5
Pavel Zamoshnikov
4.4 (5)
Improved version of the free HMA Trend indicator (for MetaTrader 4) with statistical analysis. HMA Trend is a trend indicator based on the Hull Moving Average (HMA) with two periods. HMA with a slow period identifies the trend, while HMA with a fast period determines the short-term movements and signals in the trend direction. The main differences from the free version: Ability to predict the probability of a trend reversal using analysis of history data. Plotting statistical charts for analyz
Provided Trend is a complex signal formation indicator. As a result of the work of internal algorithms, you can see only three types of signals on your chart. The first is a buy signal, the second is a sell signal, and the third is a market exit signal. Options: CalcFlatSlow - The first parameter that controls the main function of splitting the price chart into waves. CalcFlatFast - The second parameter that controls the main function of splitting the price chart into waves. CalcFlatAvg - Par
Tired of plotting support and resistance lines? This is a multi-timeframe indicator that detects and plots supports and resistance lines in the chart with the same precision as a human eye would. As price levels are tested over time and its importance increases, the lines become thicker and darker, making price leves easy to glance and evaluate. [ Installation Guide | Update Guide | Troubleshooting | FAQ | All Products ] Boost your technical analysis Customizable timeframe selection Read pri
How to use Pair Trading Station Pair Trading Station is recommended for H1 time frame and you can use it for any currency pairs. To generate buy and sell signal, follow few steps below to apply Pair Trading Station to your MetaTrader terminal. When you load Pair Trading Station on your chart, Pair Trading station will assess available historical data in your MetaTrader platforms for each currency pair. On your chart, the amount of historical data available will be displayed for each currency pai
This tool will perform Trailing stop loss and Break even management for orders. Helps you limit or reduce the time spend watching orders on the screen, especially when you need to go to sleep. Just add this EA to 1 chart, you can manage all pairs. You can filter orders by comment, magic number, and symbol. When Breakeven it can add shift/offset pips (to cover the commission...). You can try in strategy tester before purchase. The EA will add Buy and Sell alternately, so you can check the oper
Bear Bull
Ignacio Agustin Mene Franco
Bear Bull! It is an indicator that marks with Heikin Ashi candles but modified, the sales and purchases long and short trend! with 2 colors green marks the purchase, purple marks the sale, works for any type of temporality, works for forex markets and synthetic indices! ideal for any pair, it also works for crypto pairs, Good profit! World Investor - World Inversor - 
This indicator allows you to enjoy the two most popular products for analyzing request volumes and market deals at a favorable price: Actual Depth of Market Chart Actual Tick Footprint Volume Chart This product combines the power of both indicators and is provided as a single file. The functionality of Actual COMBO Depth of Market AND Tick Volume Chart is fully identical to the original indicators. You will enjoy the power of these two products combined into the single super-indicator! Below is
Buyers of this product also purchase
Professional Scalping Tool on Deriv Attention! The indicator will be sold in limited quantities!!! The previous 5 copies were sold for $250 The next 5 copies will be sold for $350 The next price is $500 Description: This trading indicator is designed for professional traders focused on scalping. Designed with the market in mind, it provides highly accurate spike trading signals. It works on the M1 timeframe and supports the following symbols: Boom 300 Index, Boom 500 Index, Boom 1000 Index,
Bill Williams Advanced
Siarhei Vashchylka
5 (4)
Bill Williams Advanced is designed for automatic chart analysis using Bill Williams' "Profitunity" system. The indicator analyzes four timeframes at once. Manual (Be sure to read before purchasing) Advantages 1. Automatically analyzes the chart using the "Profitunity" system of Bill Williams. The found signals are placed in a table in the corner of the screen. 2. Equipped with a trend filter based on the Alligator indicator. Most of the system signals are recommended to be used only accordi
TrendMaestro5
Stefano Frisetti
note: this indicator is for METATRADER4, if you want the version for METATRADER5 this is the link:  https://www.mql5.com/it/market/product/108106 TRENDMAESTRO recognizes a new TREND in the bud, he never makes mistakes. The certainty of identifying a new TREND is priceless. DESCRIPTION TRENDMAESTRO identifies a new TREND in the bud, this indicator examines the volatility, volumes and momentum to identify the moment in which there is an explosion of one or more of these data and therefore the mome
Eng Gold
Ely Alkrar Xshkaky
ENG-GOLD Scalper It is an auxiliary indicator that identifies potential targets and determines the place of entry with a stop loss that works on Heiken Ashi candles  The green lines are usually the targets, the red lines are the stop loss, and the yellow lines are the entry location.  This file is recognized on small and medium frames, usually less than the watch frame I highly recommend using XAUUSD US100 US30 USOIL 
PZ Swing Trading MT5
PZ TRADING SLU
5 (4)
Swing Trading is the first indicator designed to detect swings in the direction of the trend and possible reversal swings. It uses the baseline swing trading approach, widely described in trading literature. The indicator studies several price and time vectors to track the aggregate trend direction and detects situations in which the market is oversold or overbought and ready to correct. [ Installation Guide | Update Guide | Troubleshooting | FAQ | All Products ] Profit for market swings with
RAD CRITICAL LEVES RAD indicator tracks “Relevant Volume” in real time, identifying accumulation and distribution processes, projecting them in the chart as SUPPORT or RESISTANCE zones. Natural   support   and resistance levels are generated by Volume Accumulation and Distribution processes. As these processes evolve, levels at which the relevant volume in the market place is positioned, become difficult areas to cross upwards or downwards. By using this information, traders can identify very s
IVISTscalp5
Vadym Zhukovskyi
5 (3)
We present you the iVISTscalp5 indicator, which is not only unique, but also effective in the analysis of trading operations. This indicator is based on time data and is the result of many years of experience and deep analysis of financial markets. The iVISTscalp5 indicator is an excellent assistant for manual trading. Convenience, simplicity and visualization. All the most difficult is hidden inside. We have simplified the settings and use of the iVISTscalp5 indicator as much as possible. The i
VTrende Pro
Andrii Diachenko
5 (1)
VTrende Pro - MTF indicator for trend trading with a display panel for MT5 *** Videos can be translated into any language using subtitles (video language - Russian) Although the signals of the VTrende Pro indicator can be used as signals of a full-fledged trading system, it is recommended to use them in conjunction with the Bill Williams TS. VTrende Pro is an extended version of the VTrende indicator. Difference between Pro version and VTrende: - Time zones - Signal V - signal 1-2 waves
"Piranha" - an autonomous trading system that determines overbought and oversold levels on the chart. Red and blue zones represent overbought and oversold levels respectively. Entry points are marked with arrows: a downward arrow in the red zone for "sell" and an upward arrow in the blue zone for "buy". The Take profit level is indicated by the green moving average. Key features: Adjusting the Take profit level as the green moving average changes position. Averaging ability when a new market e
Big Player Range
Thalles Nascimento De Carvalho
5 (2)
Welcome to the "BigPlayerRange" indicator, a technical analysis tool developed to identify significant areas of interest by financial institutions in the markets. This indicator provides precise analysis of price ranges where major market players demonstrate considerable activity and interest. Key Features: Institutional Interest Area Mapping: The "BigPlayerRange" accurately highlights chart areas where financial institutions show strong activity. These points are strategically important, provi
This is arguably the most complete harmonic price formation auto-recognition indicator you can find for the MetaTrader Platform. It detects 19 different patterns, takes fibonacci projections as seriously as you do, displays the Potential Reversal Zone (PRZ) and finds suitable stop-loss and take-profit levels. [ Installation Guide | Update Guide | Troubleshooting | FAQ | All Products ] It detects 19 different harmonic price formations It plots primary, derived and complementary Fibonacci p
SMCpro
Arief
5 (1)
SMCpro MT5  Original Price  $440   ---  Currently Price  40% OFF  ( for unlimited use ) Hello World! Introducing.. SMCpro tool and Indicator for  MetaTrader 5 , a cutting-edge feature designed to revolutionize your trading experience. With innovative ICT Smart Money Concept, you gain unparalleled insight into market dynamics, empowering you to make informed trading decisions like never before. Built on the foundation of advanced algorithms and real-time data analysis, SMCpro tool and Indicat
Weis Wave with Alert MT5
Trade The Volume Waves Single Member P.C.
4.93 (15)
Rental/Lifetime Package Options and Privileges  * For optimum results the yearly or lifetime package is suggested due to live training ! Rent Monthly Six Months   Yearly/Lifetime Weis Wave with Speed with Alert+Speed Index x x x Manual  x x x Quick Set up Video x x x Blog x x x Lifetime Updates x x x Setup and Training Material x x Free Rectangle Break Alert Tool      x Discord Access Channel "The SI traders" x 2-hour live methodology training x How to trade with it:    http://
PZ Divergence Trading MT5
PZ TRADING SLU
3.75 (4)
Tricky to find and scarce in frequency, divergences are one of the most reliable trading scenarios. This indicator finds and scans for regular and hidden divergences automatically using your favourite oscillator. [ Installation Guide | Update Guide | Troubleshooting | FAQ | All Products ] Easy to trade Finds regular and hidden divergences Supports many well known oscillators Implements trading signals based on breakouts Displays suitable stop-loss and take-profit levels Configurable oscilla
Harmonic ABCD Monitor MT5
Mihail Matkovskij
5 (2)
Multi-currency, multi-timeframe, harmonic pattern indicator AB = CD. Supports sending push notifications about signals to a mobile device, messages on e-mail, as well as messages using alerts on all available currency pairs and timeframes. This indicator was based on the indicator Harmonic ABCD Universal. Version for MetaTrader 5:  https://www.mql5.com/en/market/product/44972 . See also: Harmonic ABCD Universal for MetaTrader 4 . Using modern software development methods has made the indicator a
Introduction to X3 Chart Pattern Scanner X3 Cherart Pattern Scanner is the non-repainting and non-lagging indicator detecting X3 chart patterns including Harmonic pattern, Elliott Wave pattern, X3 patterns, and Japanese Candlestick patterns. Historical patterns match with signal patterns. Hence, you can readily develop the solid trading strategy in your chart. More importantly, this superb pattern scanner can detect the optimal pattern of its kind. In addition, you can switch on and off individu
Ershov 38 parrots MT5
Aleksei Ershov
5 (1)
The indicator is designed to close positions on the market in time. For example: to take profits ahead of schedule if the price has not reached TakeProfit, and the market is turning around. The indicator analyzes the momentum, not the trend. He does not give any information about the trend. The indicator is well suited for finding divergence. The Ershov 38 Parrots indicator dynamically adjusts to the market and detects price movement impulses of medium and high amplitude. It almost does not rea
PZ Day Trading MT5
PZ TRADING SLU
2.83 (6)
This indicator detects price reversals in a zig-zag fashion, using only price action analysis and a donchian channel. It has been specifically designed for short-term trading, without repainting or backpainting at all. It is a fantastic tool for shrewd traders aiming to increase the timing of their operations. [ Installation Guide | Update Guide | Troubleshooting | FAQ | All Products ] Amazingly easy to trade It provides value on every timeframe It displays suitable SL and TP levels It impl
Tatino Super Signals is Non Repaint Indicator for Binary Option trading and Forex trading. Recommendations: Timeframe: All timeframes. For best results we recommend using it on M1, M5 and M15 timeframes. Currency pairs: All Pairs Account type: All Type Broker time: Any Brokers : Alls Binary Trading : Expired 1 Candle Buffer Buy=1, Sell=0, Entry Next Candle Recommended Forex trading stop loss : 15 pips Recommended  Forex tradingTake profit levels : 15 pips Specifications: Does not repaint  
Smooth price for Monarch
Konstantin Gruzdev
5 (1)
The Smooth Price technical indicator is used for plotting a smoothed line as close to the price of the financial instrument as possible, and serves to eliminate its noise components. The indicator is part of the Monarch trading system, but here it is presented as an independent technical analysis tool. The indicator is based on the cluster digital filter , which, unlike the ClusterSMA , is applied directly to the price time series. Smooth Price does not redraw (except the very last, zero bar) an
INDICATOR based on ARTIFICIAL INTELLIGENCE that generates possible call and put entries for binary options. the indicator works on 3 different strategies: 1) by reading volumes, it sends a signal when the price should reverse 2) through the divergence between price and volume, it sends a signal when the trend should continue or reverse 3) through the convergence between price and volume, it sends a signal when the trend should continue. the indicator works on all time frames, but
PZ Mean Reversion MT5
PZ TRADING SLU
3 (2)
Unique indicator that implements a professional and quantitative approach to mean reversion trading. It capitalizes on the fact that the price diverts and returns to the mean in a predictable and measurable fashion, which allows for clear entry and exit rules that vastly outperform non-quantitative trading strategies. [ Installation Guide | Update Guide | Troubleshooting | FAQ | All Products ] Clear trading signals Amazingly easy to trade Customizable colors and sizes Implements performance st
This is the famous Sunflower indicator for Metatrader5. This indicator marks possible tops and bottoms on price charts. The indicator identifies tops and bottoms in the asset's price history, keep in mind that the current sunflower of the last candle repaints, as it is not possible to identify a top until the market reverses and it is also not possible to identify a bottom without the market stop falling and start rising. If you are looking for a professional programmer for Metatrader5, please
ZigZag de Suavizador
Cesar Juan Flores Navarro
Teniendo una entrada de precios suavizados, los cuales son procesador por un ZigZag en tiempo real, dando como resultado un suavizador ajustado a un ZigZag. Con valores de entrada (periodo) mayores se vuelve un poco lenta en M1,, Ideal para H1, H4, D1 Trabaja bien con otros suavizadores, ya que su intersección es ideal Al iniciar empiza con mayor precisión desde el momento de activación, siendo el historial (anterior) de referencia ----------------------------------------------------------------
Super Suavizador
Cesar Juan Flores Navarro
Indicador en MQL5 que obtiene el promedio de 10 EMAS que son alineadas y procesadas según Fibonacci luego el promedio es suavizado"  Se ingresa un número de 2 a N que multiplica los EMA-Fibonacci y por consiguiente aumenta los fibonacci, resultando un promedio.   Se ingresa un número que suaviza los EMA-Fibonacci. Considerando los números 1/1 seria la suavización minima. Considerando los números 3/5 seria la suavización media. Considerando los números 10/30 seria la suavización alta.....etc
Elliot Waves Analyzer Pro
Viktor Weidenthal
3.25 (4)
Elliot Waves Analyzer Pro calculates Elliot Waves to Help Identify Trend direction and Entry Levels. Mainly for Swing Trading Strategies. Usually one would open a Position in trend direction for Wave 3 or a Correction for Wave C . This Indicator draws Target Levels for the current and next wave. Most important Rules for Elliot Wave Analysis are verified by the Indicator.  The Pro version analyzes Multiple Timeframes and shows the Subwaves and Target-Levels.   For an Overview  " Elliot Waves Anal
SMT Divergences MT5
Diego Arribas Lopez
MT4 Version SMT Divergences MT5 SMT Divergences is one of the most innovative indicators in the market. It offers the possibility of analyzing price divergences between 2 pairs. These divergences highlight and help to foresee what banks and institutions are planning to do. SMT divergences also provides you with a kill zones indicator and the possibility of filtering divergences occurring during these kill zones.  This indicator is specially powerful if applied in 2 highly correlated pairs. A pr
[ MT4 Version ] Order Block Indicator MT5 Order Block Indicator MT5 is currently the most accurate and customizable indicator in the market. It has been developed to facilitate the analysis of operations based on Order Blocks and Supply and Demand Zones. These zones are possible reversal points of a movement. Order Blocks indicate a possible accumulation of orders in one area. The price usually gets to reach and react strongly to those areas. The most relevant levels for this reaction are the c
BookMap HeatMap
Roberto Spadim
1 (3)
This Indicator creates a heatmap based on depth of market of the current symbol or another symbol. Other symbol is useful when you trade futures market and a contract has 'mini' and 'full' split. For example, in Brazil (B3 - BMF&Bovespa), WDO and DOL are future Forex contract of BRL/USD (where 1 DOL = 5 WDO) and big banks work mostly with DOL (where liquidity is important). Please use with M1 timeframe , objects are too small to be displayed at higher timeframes (MT5 limit). The number of level
Классификатор силы тренда. Показания на истории не меняет. Изменяется классификация только незакрытого бара. По идее подобен полной системе ASCTrend, сигнальный модуль которой, точнее его аппроксимация в несколько "урезанном" виде, есть в свободном доступе, а также в терминале как сигнальный индикатор SilverTrend . Точной копией системы ASCTrend не является. Работает на всех инструментах и всех временных диапазонах. Индикатор использует несколько некоррелируемых между собой алгоритмов для класси
More from author
NakaTrend
Ricardo De Andrade Nakano
"Introducing NakaTrend: Your Ultimate Trend Detector for MetaTrader 5! Ready to revolutionize your trading experience? Meet NakaTrend, your go-to indicator for identifying trend changes with precision and ease. With NakaTrend, you'll never miss another opportunity to capitalize on market shifts. When a bullish trend emerges, NakaTrend signals it with a green dollar sign, prompting you to enter a buy order. And when the tide turns bearish, a red dollar sign appears, signaling the perfect mom
FREE
NakaTrendBot
Ricardo De Andrade Nakano
Introducing NakaTrendBot - Your Ultimate Trend Trading Companion! Are you tired of missing out on opportunities when the market shifts? Look no further than NakaTrendBot, your trusted ally in navigating the dynamic world of trading trends. NakaTrendBot is more than just a robot; it's a sophisticated algorithmic powerhouse designed to detect trend changes and consolidations with precision. Leveraging cutting-edge machine learning algorithms and advanced technical analysis, NakaTrendBot conti
NakaSideBot
Ricardo De Andrade Nakano
Introducing NakaSideBot - Your Ultimate Side Market Champion! Are you tired of missing out on profits when the market changes direction? Say hello to NakaSideBot, your ultimate side market champion! This cutting-edge robot is designed to thrive in ever-changing market conditions, making it perfect for both trending and sideways markets. NakaSideBot excels when the market transitions or consolidates, seizing opportunities that others may overlook. With its advanced algorithms, it detects tre
Filter:
No reviews
Reply to review
Version 1.3 2024.04.07
Adjusted the $ position and added the function to clear the graph when removing the indicator.
Version 1.1 2024.04.07
Fixed the bug it was not calculating old bars