Master OBV FX
- Indicators
- Thalles Nascimento De Carvalho
- Version: 1.3
- Updated: 11 January 2024
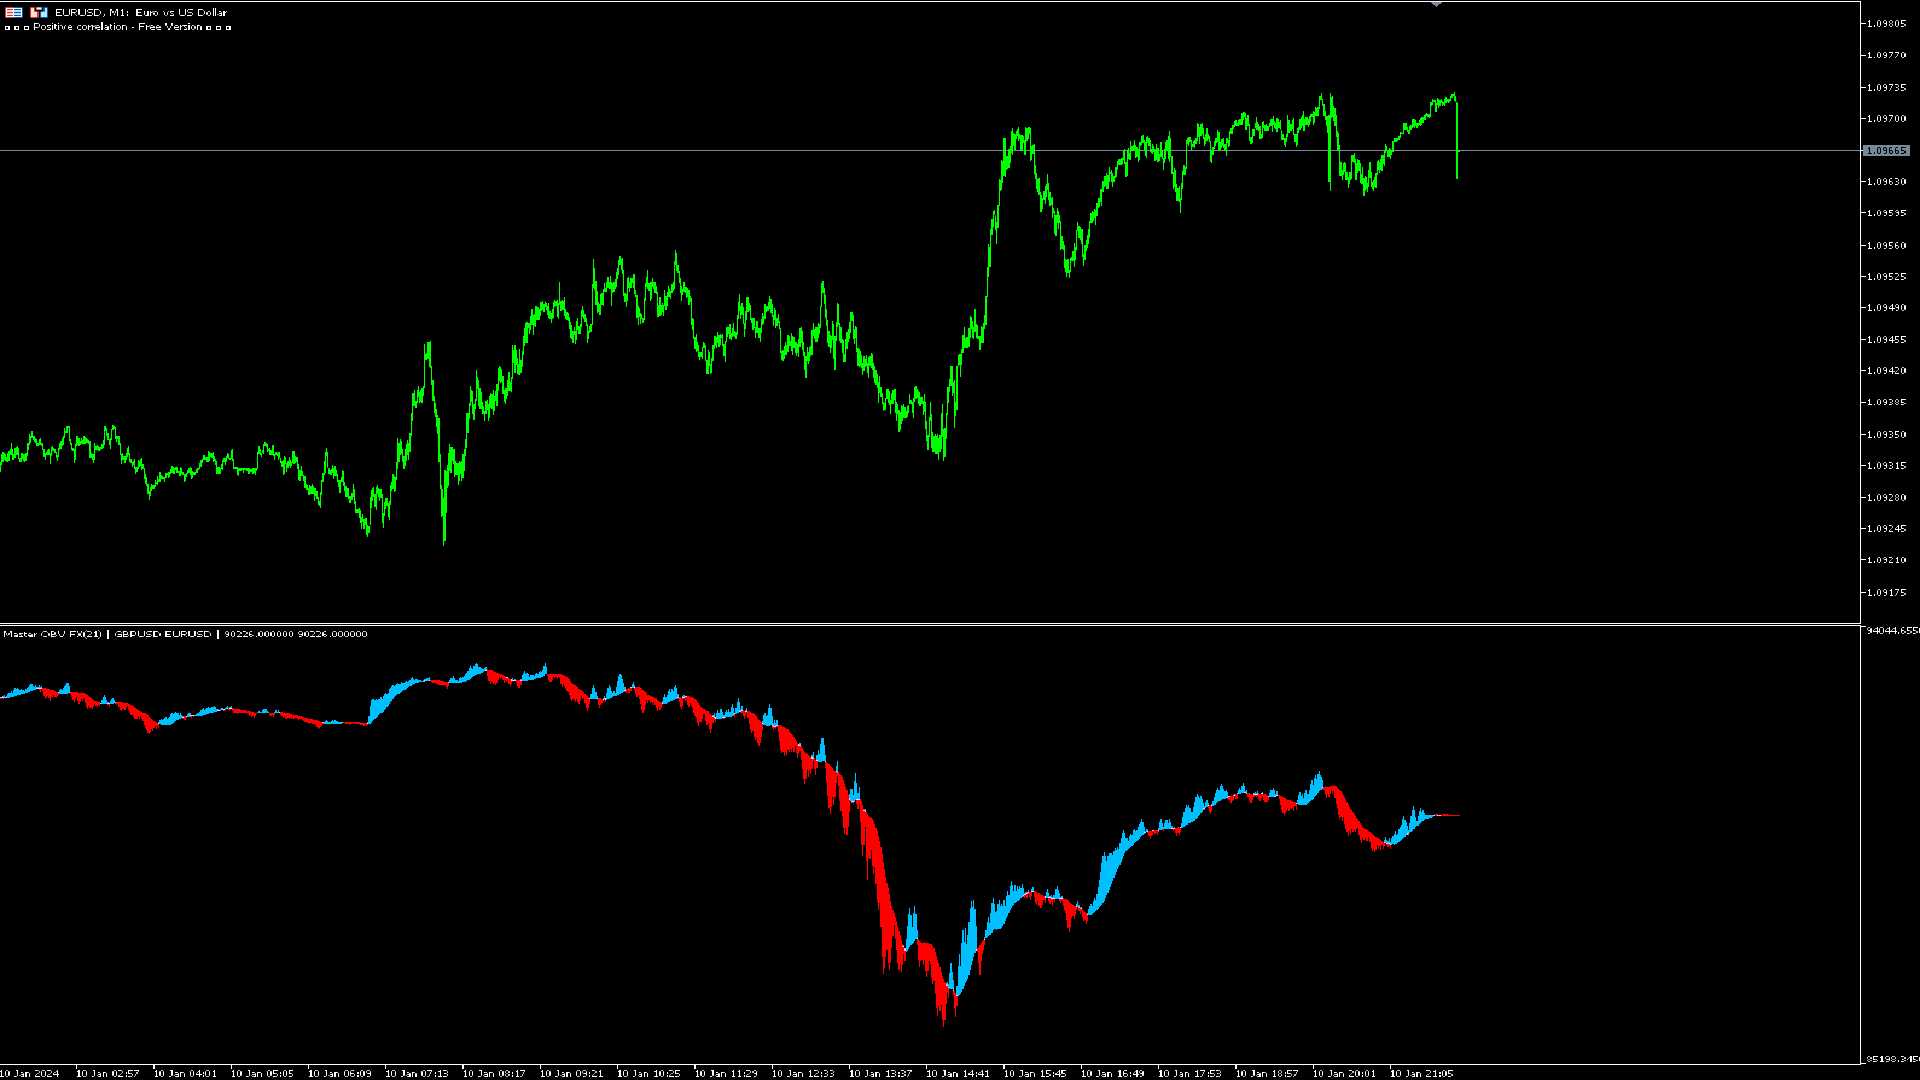
The MasterOBV indicator is a powerful technical analysis tool that utilizes volume, positive correlation, and a Moving Average (MA) to enhance trend identification in financial markets. By incorporating assets with positive correlation through the indicator menu, MasterOBV provides a refined approach to assessing the strength and direction of trends. The inclusion of the Moving Average adds additional smoothing to price movements, aiding in a more accurate tracking of the underlying trend over time.
By considering not only price movements but also trade volume and correlation between different assets, MasterOBV empowers traders to identify entry or exit opportunities with increased confidence. This strategic combination of factors makes MasterOBV an effective tool in technical analysis, offering valuable insights to assist investors in making informed decisions in the dynamic environment of the financial market.
unlimited version
https://www.mql5.com/pt/market/product/111253?source=Site+Market+My+Products+Page


Ein guter und hilfreicher Indikator.