AI Support Resistance
- Indicators
- Vladimir Karputov
- Version: 1.0
- Activations: 5
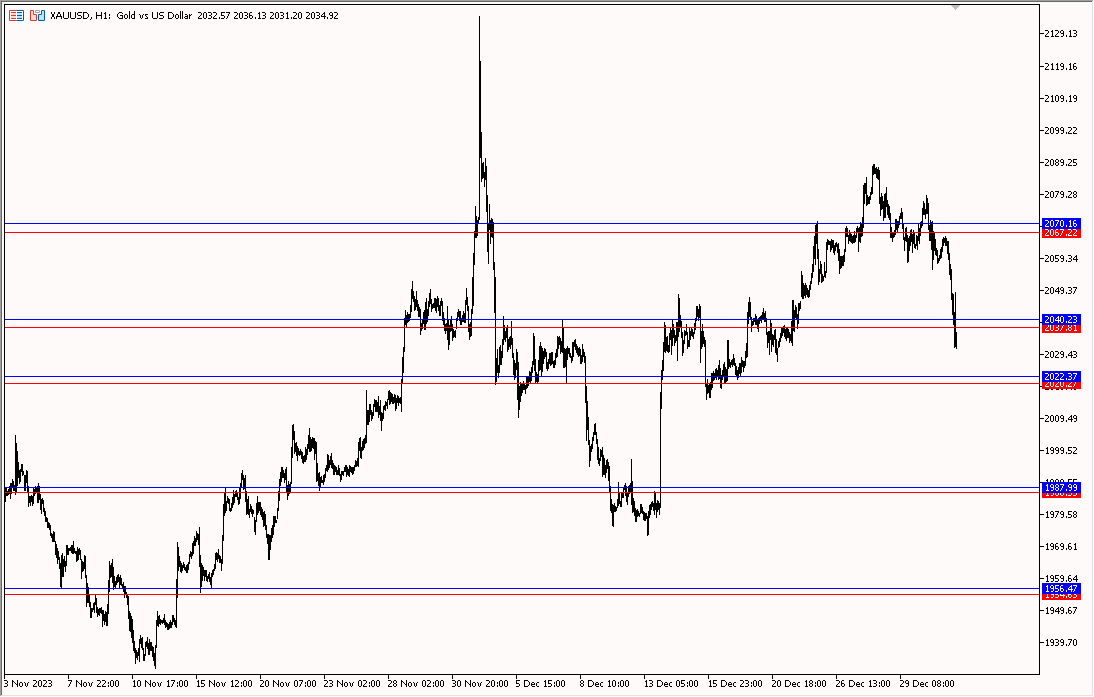
AI Support Resistance
This is an indicator that searches for the “Support” and “Resistance” lines. The search is carried out using an algorithm for numerical analysis and data processing.
There are three search options available (“mode #1”, “mode #2” and “mode #3”). Each of these options differs in its internal algorithm (at the moment these are completely internal settings, they are not available to the user). We can say that these options differ in the severity of the search.
Limitation:
At the moment, the indicator requires a certain minimum number of bars - if bars are not enough, look for the indicator.
Resource saving:
In order not to recalculate too often and not to overload the computer's calculation capabilities, the indicator searches once every 30 bars.
Line names:
The line names have either "sup_" or "res_". There is also a timeframe and internal line number.