Hexo Trend
- Indicators
- Mateus Cerqueira Lopes
- Version: 1.0
- Activations: 5
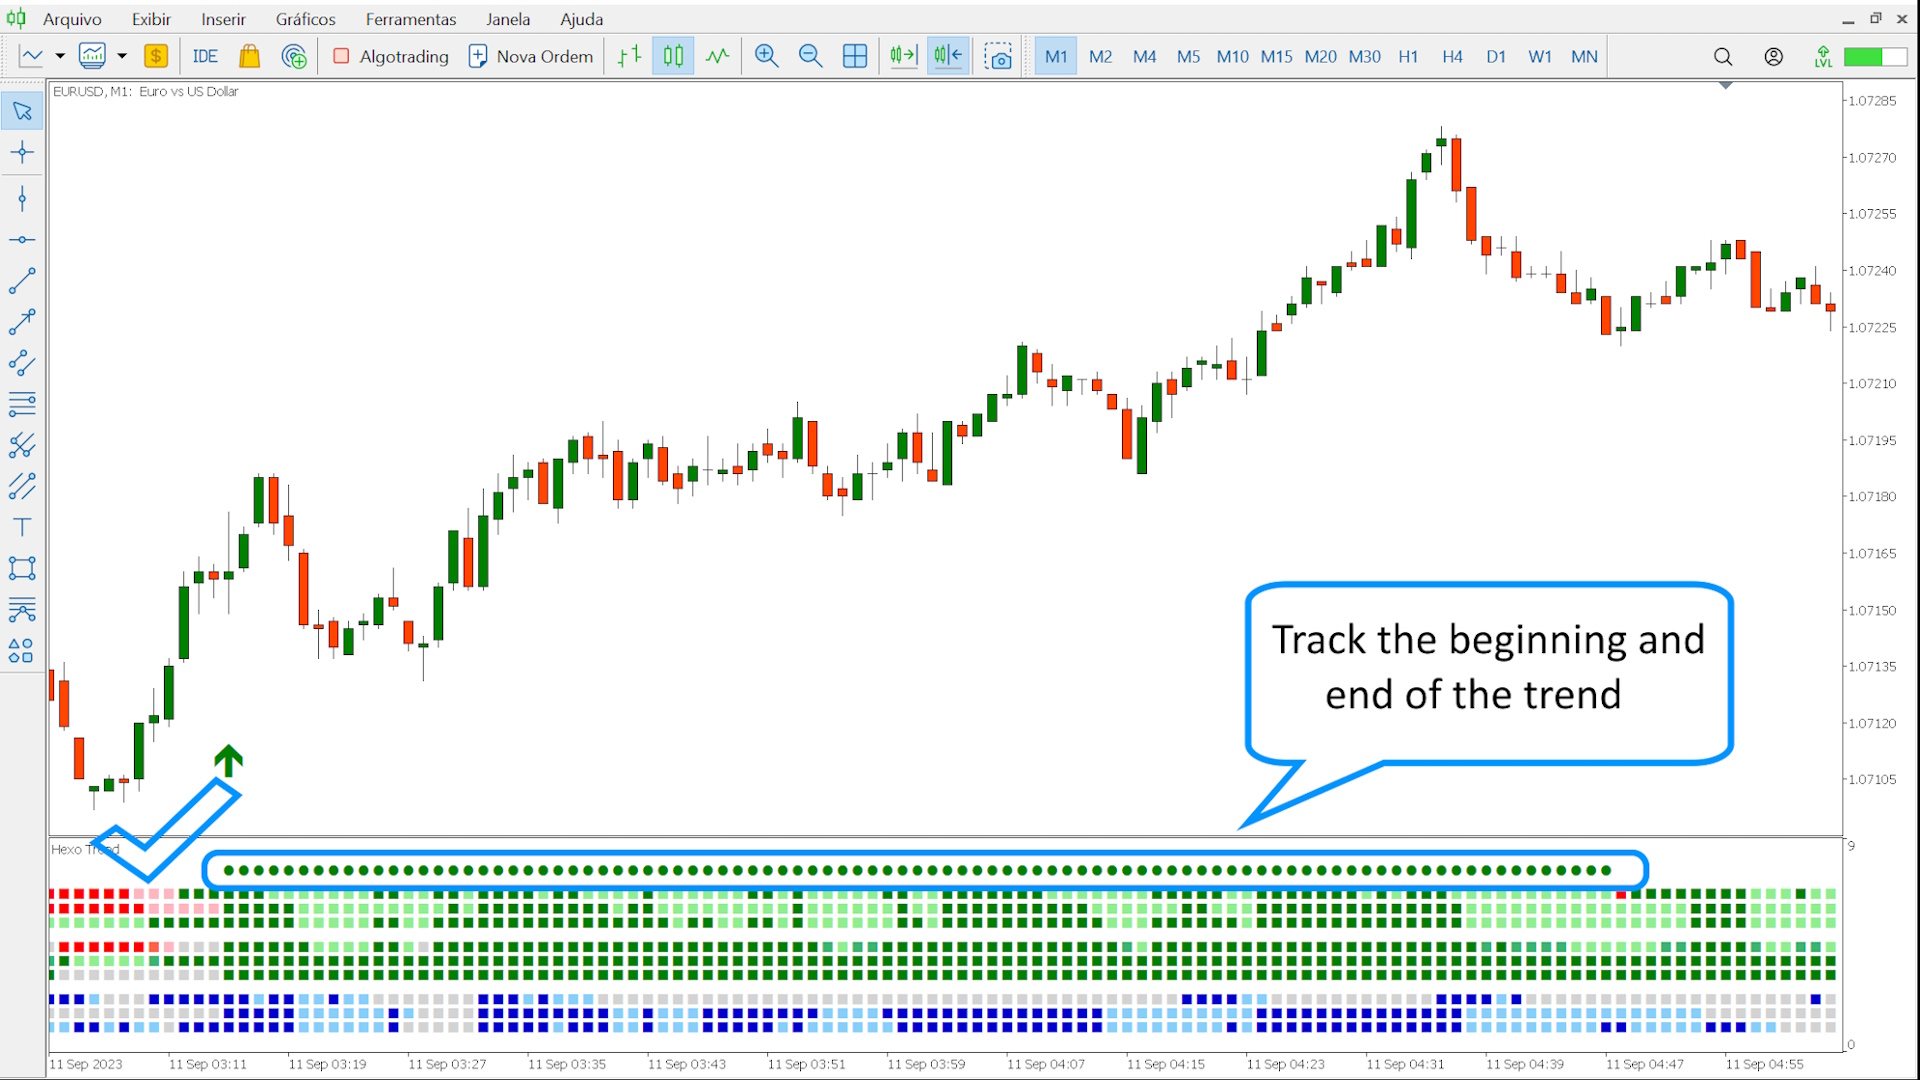
Hexo Trend is an advanced Trend Tracker that brings the latest trading technology after extensive research and development work aimed at the financial market.
Our indicator is based on the fractal theory found in the financial market, identifying trends and filtering periods of neutral market sentiment, we understand that the way to be more profitable in the market is to be a trend trade.
Trend trading is trading in the direction of the current market movement. In an upward direction: such a movement is called a bull move. In a downward direction, the trend is called bearish. Operating following the trend will mean opening positions in the same direction. Our method emphasizes the need to operate with the trend as we understand that it is better to swim with the current than against it.
Trading in the direction the market is moving, which sounds very simple but is deceptively difficult, means you are often exposed to subjectively identifying trends. Many factors determine whether your trade in the current market direction will be successful such as defining the “health” of a trend which is always a difficult task, generating questions such as:
- What direction is the trend?
- What is your strength?
- After opening a trade will the market continue to move in your direction?
- Is the trend accelerating or slowing down?
- When should I stay out and not operate?
To avoid these limitations, Hexo Trend and Hexo Zones were designed to automate the trend detection process. Its great advantage is the ability to measure the direction and acceleration of the trend and can marginally increase the accuracy of your trading.
About our indicator:
Our indicator is made up of 9 lines (plus the strategy line that we will discuss later) and its colors (which can be customized) of green tones indicate an upward trend, and red tones indicate a downward trend.
Darker tones indicate greater direction and strength of the fractals, lighter tones indicate less strength or loss of direction.
In a simple way, the indicator can be turned on as follows:
The greater the number of lines in green, the greater the probability of an uptrend. The greater the number of red lines, the greater the probability of an uptrend.
The darker shades in these lines mean the trend is stronger or gaining strength, similarly lighter shades indicate loss of strength.
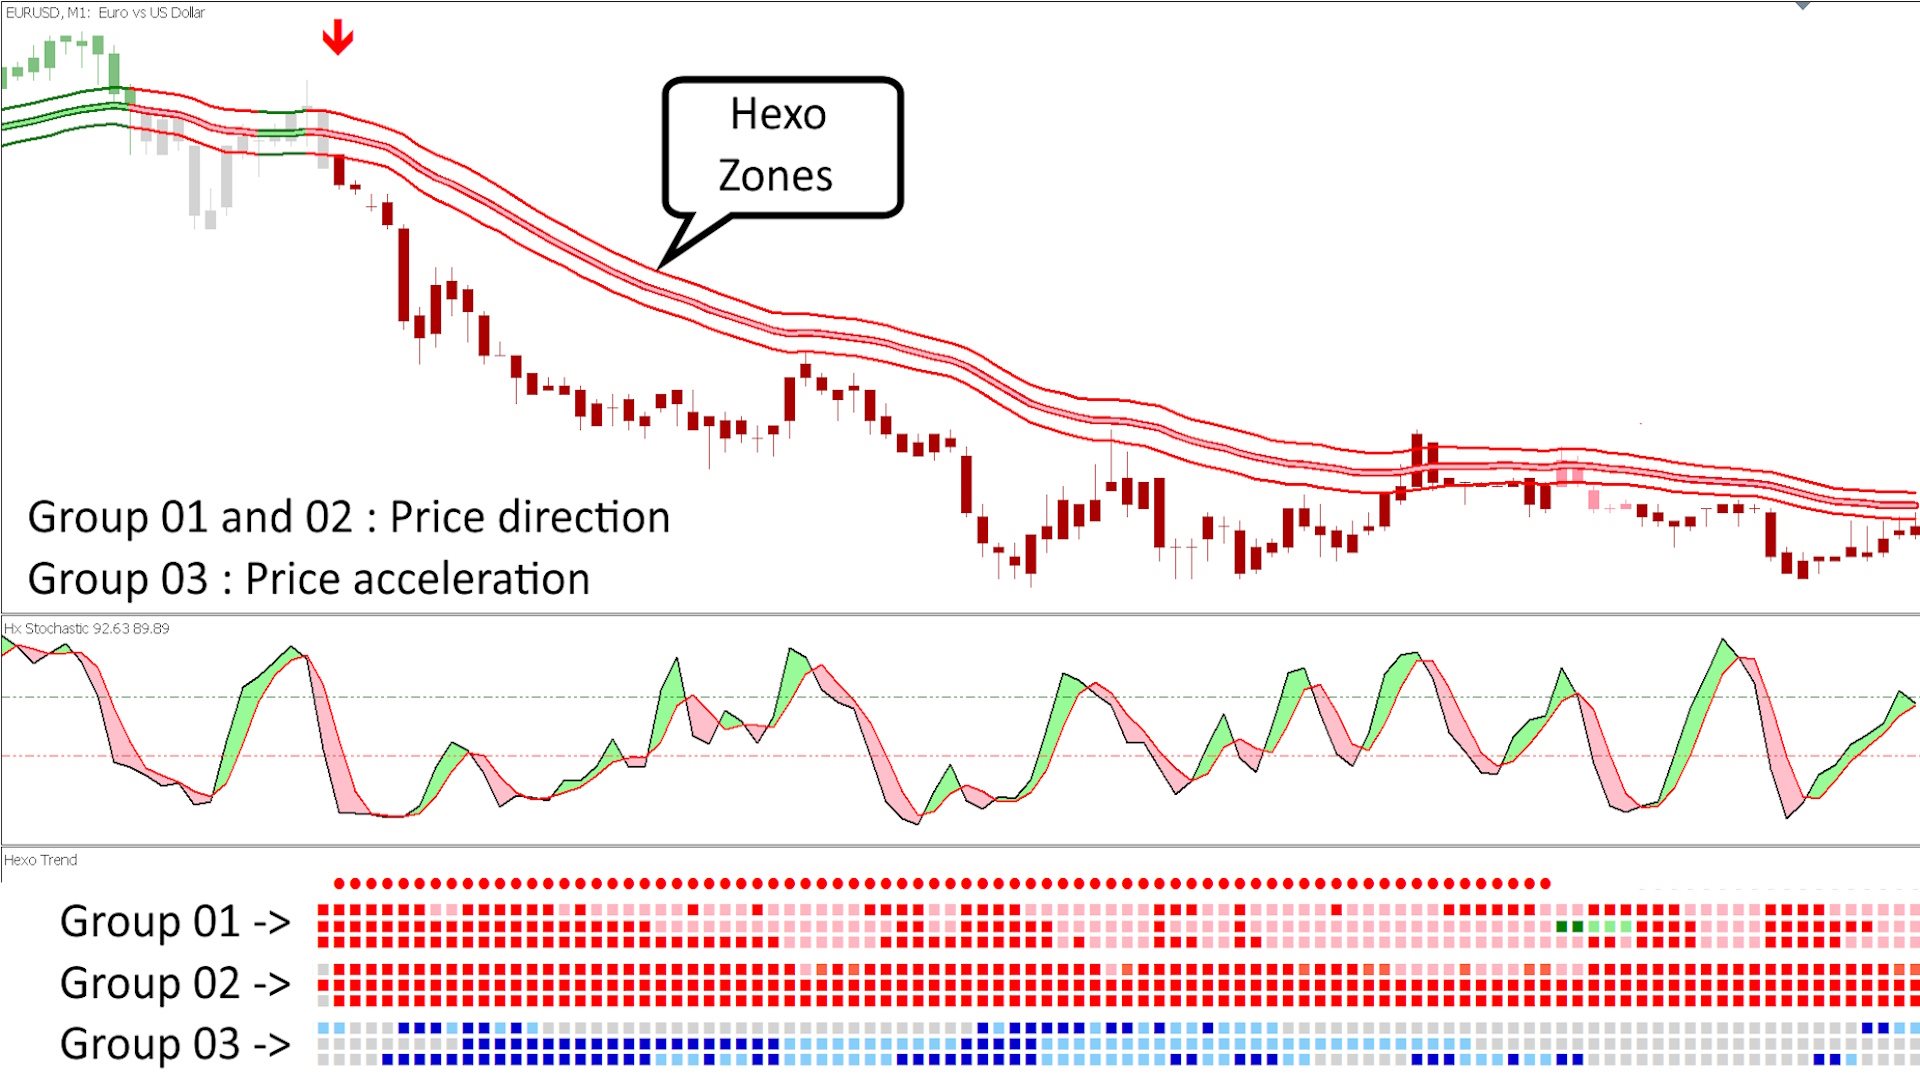
Group 01: This group monitors the price direction in the short term, being composed of four colors (green, light green, pink, red) with the green colors being an uptrend and red being a downtrend. (Lines 09 to 07)
Group 02: This group monitors the price direction in a longer term, being composed of seven colors, (light green, green, dark green, pink, red, dark red and gray) with the green colors being an uptrend and red downtrend. The darker the colors, the greater strength, with gray indicating no defined trend. (Lines 06 to 04)
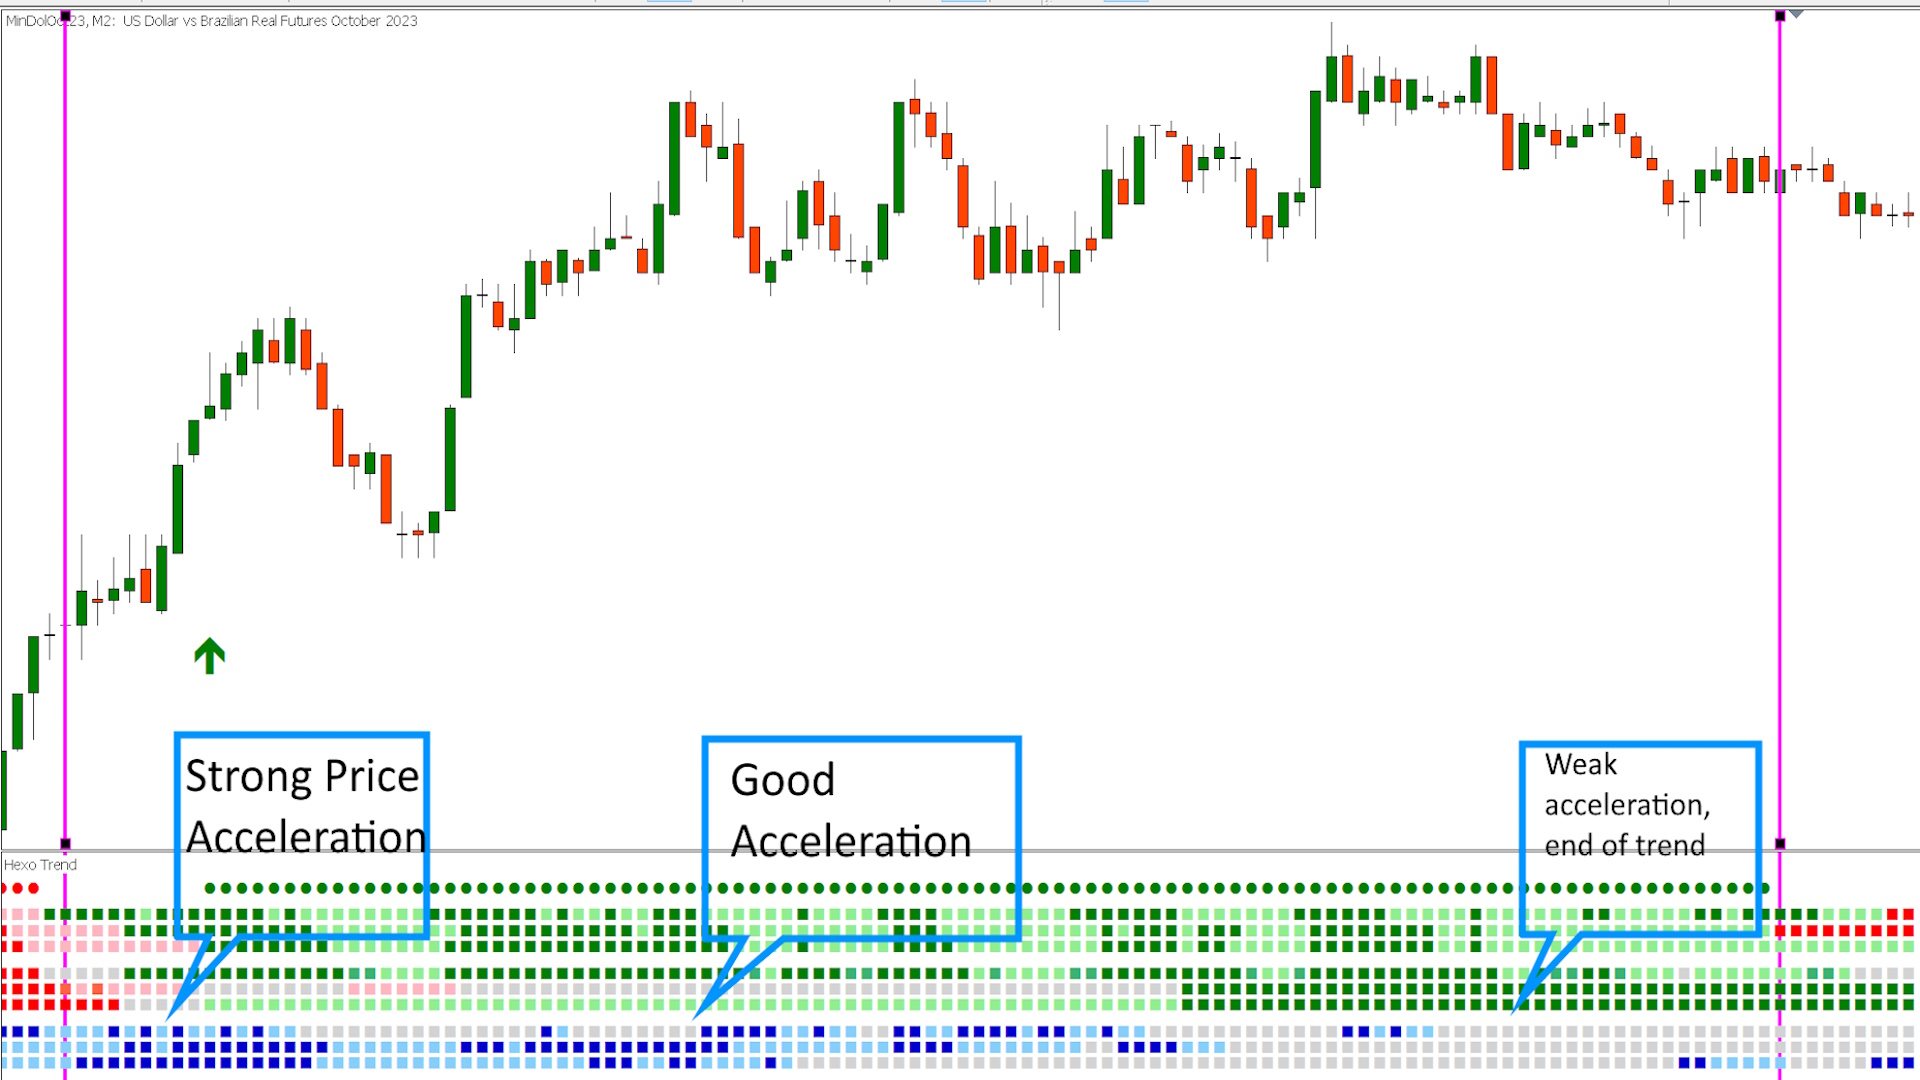
Group 03: This group does NOT indicate price direction but rather its acceleration, it is made up of three lines in two shades of blue and gray. Acceleration moments are composed of dark blue color and light blue indicates weaker acceleration or decreased acceleration. Gray color indicates no acceleration. (Lines 03 to 01)
For a good trend to be operable, in addition to direction we need acceleration. With the combination of Steering + Acceleration we have a tendency that should be considered operable.
Strategies are starting points for possible trends. This line is optional and can be turned on or off, and in the current version we have 03 strategies, these points are mapped by dots in the first line of the indicator, and by arrows on the graph. (line 10)
Strategy 01: Scalp strategy, recommended only for experienced users, tries to catch the trends, with the operator making short entries and exits most of the time. Its disadvantage is that by showing trends at the beginning we do not necessarily have good acceleration and development.
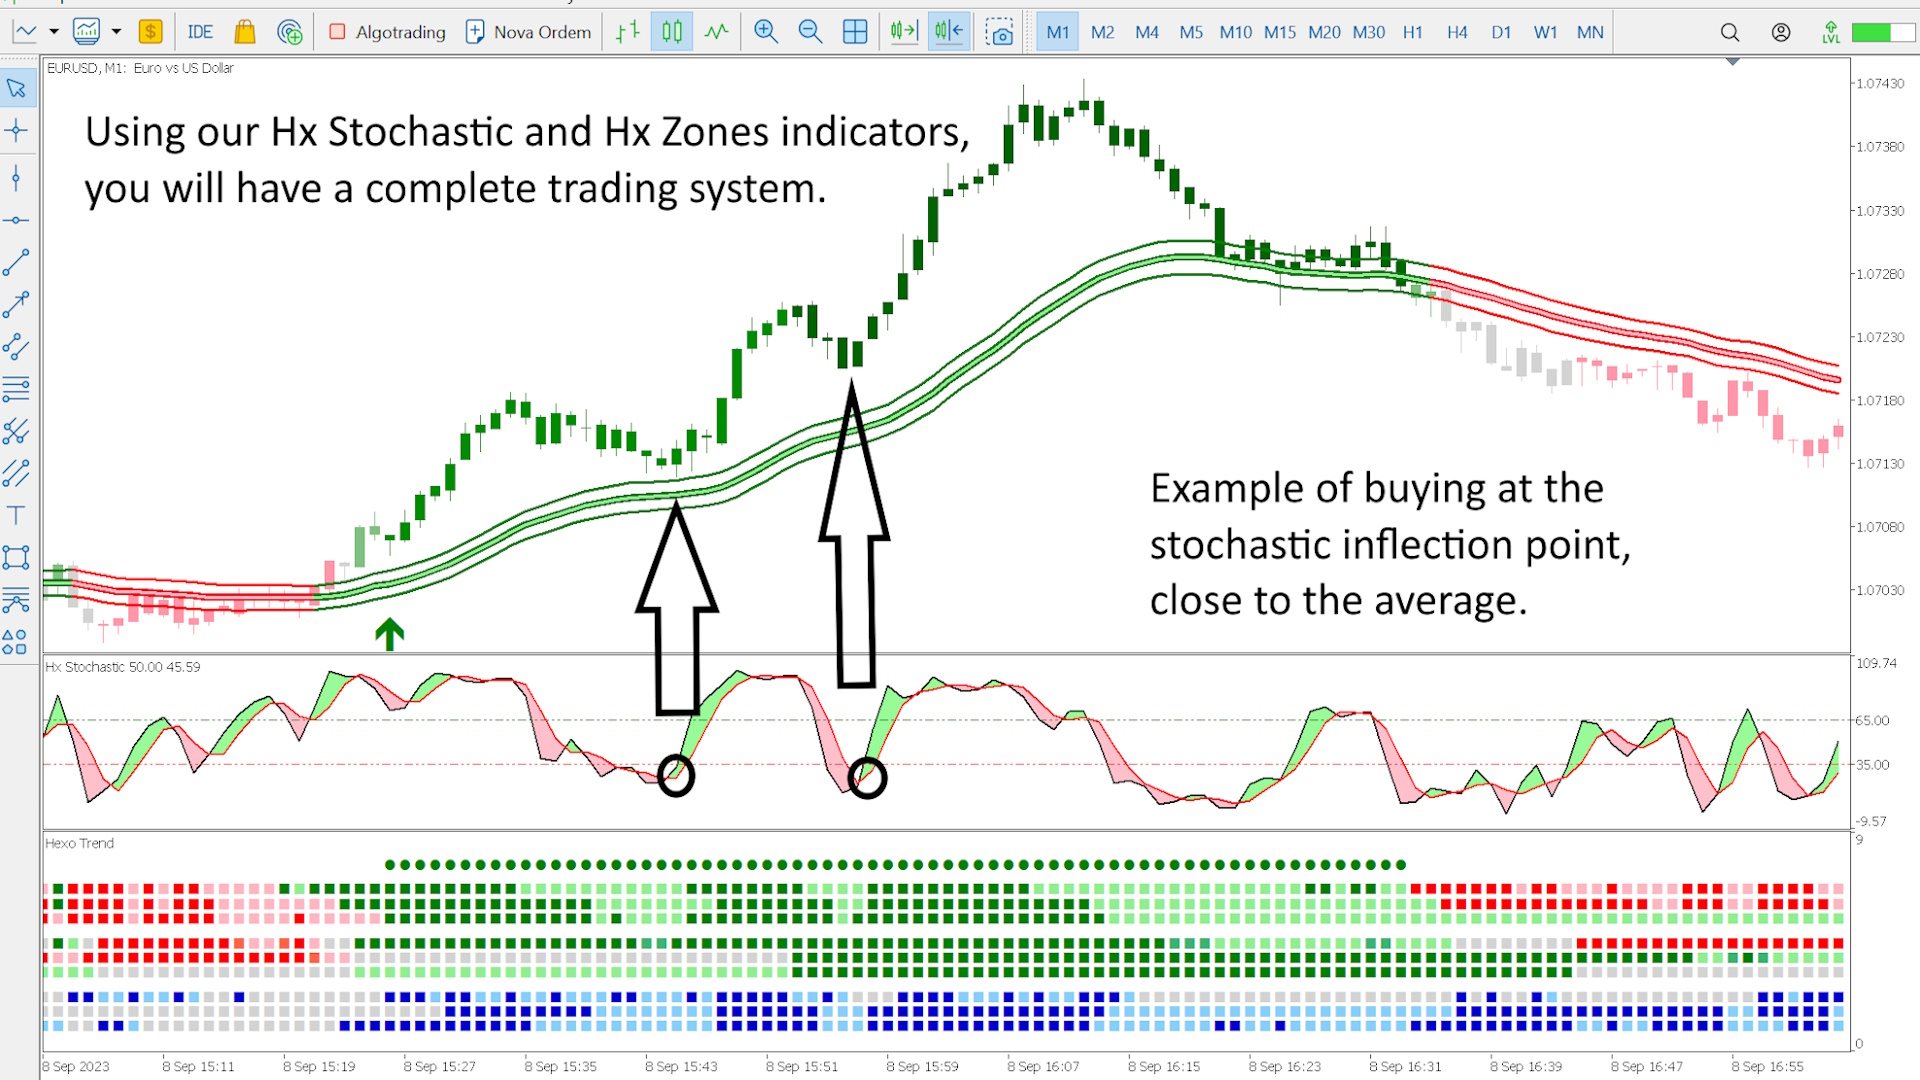
Strategy 02: Standard strategy, recommended for all users try to enter already established trends, with some development, when you see the arrows wait a few bars and monitor the health of the trend, see if it moves away from our average (Hexo Zones) if it is gaining strength and acceleration.
Strategy 03: Strategy that tries to catch the strongest phase of the trend with good development, when you see the arrows see if it moves away from our average (Hexo Zones) if it is gaining strength and acceleration. Disadvantage, the signal can happen at the end of trends.
Operation Tips:
Always observe acceleration group 03 and avoid operating in what we call the “Grey Zone”, which is when the three lines in this group are gray, that is, there is no acceleration. Many dark blue lines usually mark the beginning of good trends.
Avoid entering when the lines mix green and red colors, wait for at least four or five lines of the same color. Note: Gray lines can be ignored.
Moments of better trend formation are moments when line B12 (line 06) turns green or red. This line is not always filled but statistically this is when we have the best trends forming.
Our Hexo Zones and Hx Stochastic indicators should be used in conjunction with Hexo Trend, thus providing a complete trading system.
Our indicator is based on the fractal theory found in the financial market, identifying trends and filtering periods of neutral market sentiment, we understand that the way to be more profitable in the market is to be a trend trade.
Trend trading is trading in the direction of the current market movement. In an upward direction: such a movement is called a bull move. In a downward direction, the trend is called bearish. Operating following the trend will mean opening positions in the same direction. Our method emphasizes the need to operate with the trend as we understand that it is better to swim with the current than against it.
Trading in the direction the market is moving, which sounds very simple but is deceptively difficult, means you are often exposed to subjectively identifying trends. Many factors determine whether your trade in the current market direction will be successful such as defining the “health” of a trend which is always a difficult task, generating questions such as:
- What direction is the trend?
- What is your strength?
- After opening a trade will the market continue to move in your direction?
- Is the trend accelerating or slowing down?
- When should I stay out and not operate?
To avoid these limitations, Hexo Trend and Hexo Zones were designed to automate the trend detection process. Its great advantage is the ability to measure the direction and acceleration of the trend and can marginally increase the accuracy of your trading.
About our indicator:
Our indicator is made up of 9 lines (plus the strategy line that we will discuss later) and its colors (which can be customized) of green tones indicate an upward trend, and red tones indicate a downward trend.
Darker tones indicate greater direction and strength of the fractals, lighter tones indicate less strength or loss of direction.
In a simple way, the indicator can be turned on as follows:
The greater the number of lines in green, the greater the probability of an uptrend. The greater the number of red lines, the greater the probability of an uptrend.
The darker shades in these lines mean the trend is stronger or gaining strength, similarly lighter shades indicate loss of strength.
Group 01: This group monitors the price direction in the short term, being composed of four colors (green, light green, pink, red) with the green colors being an uptrend and red being a downtrend. (Lines 09 to 07)
Group 02: This group monitors the price direction in a longer term, being composed of seven colors, (light green, green, dark green, pink, red, dark red and gray) with the green colors being an uptrend and red downtrend. The darker the colors, the greater strength, with gray indicating no defined trend. (Lines 06 to 04)
Group 03: This group does NOT indicate price direction but rather its acceleration, it is made up of three lines in two shades of blue and gray. Acceleration moments are composed of dark blue color and light blue indicates weaker acceleration or decreased acceleration. Gray color indicates no acceleration. (Lines 03 to 01)
For a good trend to be operable, in addition to direction we need acceleration. With the combination of Steering + Acceleration we have a tendency that should be considered operable.
Strategies are starting points for possible trends. This line is optional and can be turned on or off, and in the current version we have 03 strategies, these points are mapped by dots in the first line of the indicator, and by arrows on the graph. (line 10)
Strategy 01: Scalp strategy, recommended only for experienced users, tries to catch the trends, with the operator making short entries and exits most of the time. Its disadvantage is that by showing trends at the beginning we do not necessarily have good acceleration and development.
Strategy 02: Standard strategy, recommended for all users try to enter already established trends, with some development, when you see the arrows wait a few bars and monitor the health of the trend, see if it moves away from our average (Hexo Zones) if it is gaining strength and acceleration.
Strategy 03: Strategy that tries to catch the strongest phase of the trend with good development, when you see the arrows see if it moves away from our average (Hexo Zones) if it is gaining strength and acceleration. Disadvantage, the signal can happen at the end of trends.
Operation Tips:
Always observe acceleration group 03 and avoid operating in what we call the “Grey Zone”, which is when the three lines in this group are gray, that is, there is no acceleration. Many dark blue lines usually mark the beginning of good trends.
Avoid entering when the lines mix green and red colors, wait for at least four or five lines of the same color. Note: Gray lines can be ignored.
Moments of better trend formation are moments when line B12 (line 06) turns green or red. This line is not always filled but statistically this is when we have the best trends forming.
Our Hexo Zones and Hx Stochastic indicators should be used in conjunction with Hexo Trend, thus providing a complete trading system.