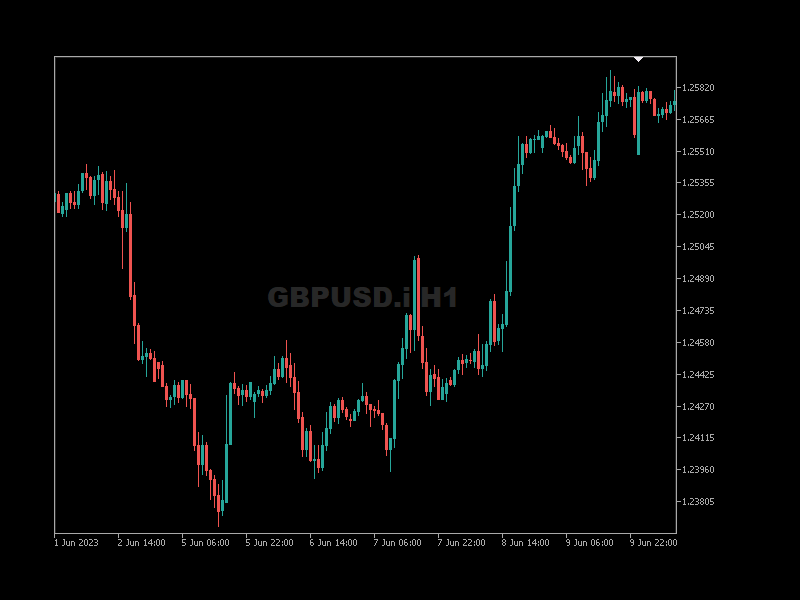
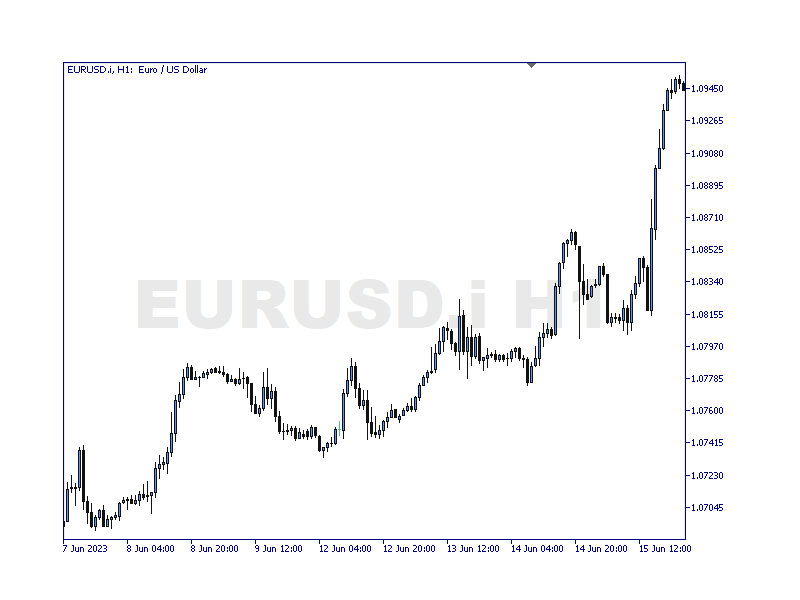
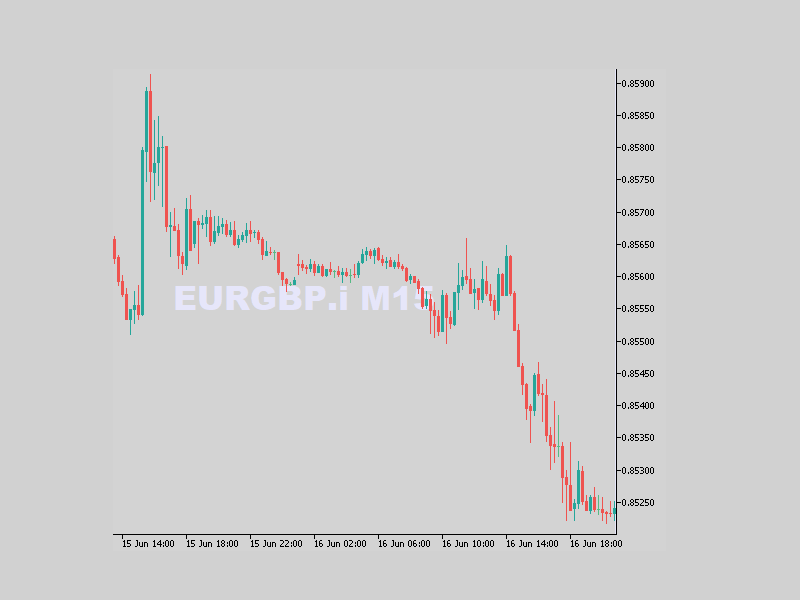
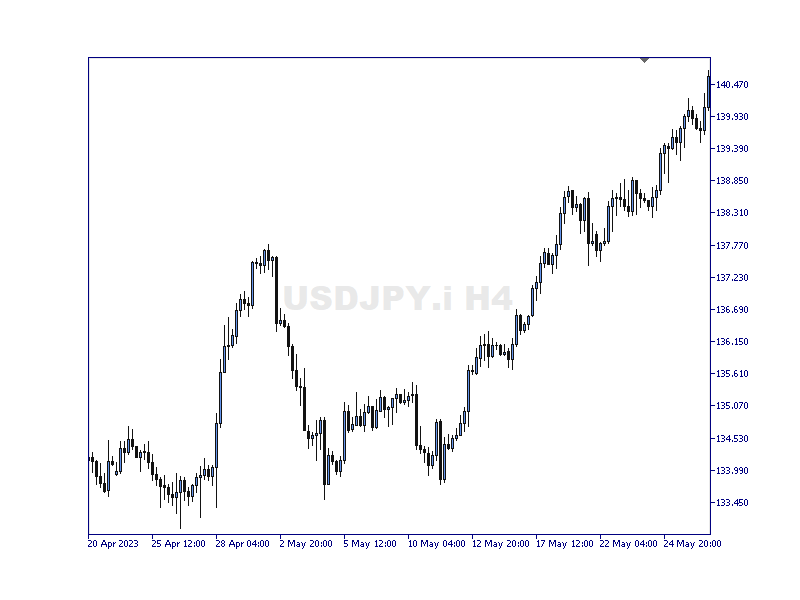
RFOC Symbol Background
- Indicators
- Ronaldo Franco De Oliveira Cardoso
- Version: 1.0
The RFOC Symbol Background was created to display the name of the asset and the current timeframe in the background of the chart.
Displaying the name of the asset at the bottom of the chart is often used by traders who are designing the screen for spectators, making it easier to identify the asset and the timeframe during a class, for example.
It is available for the user to select the font size (small, medium or large) and select the color for better viewing according to the background color of the chart so as not to impair the visualization of price readings.

This has freed me from the hassle of checking symbols and timeframes every time. Thank you!