- Installing Python and the MetaTrader5 package
- Overview of functions of the MetaTrader5 package for Python
- Connecting a Python script to the terminal and account
- Error checking: last_error
- Getting information about a trading account
- Getting information about the terminal
- Getting information about financial instruments
- Subscribing to order book changes
- Reading quotes
- Reading tick history
- Calculating margin requirements and evaluating profits
- Checking and sending a trade order
- Getting the number and list of active orders
- Getting the number and list of open positions
- Reading the history of orders and deals
Reading quotes
The Python API allows you to get arrays of prices (bars) using three functions that differ in the way you specify the range of requested data: by bar numbers or by time. All functions are similar to different forms of CopyRates.
For all functions, the first two parameters are used to specify the name of the symbol and timeframe. The timeframes are listed in the TIMEFRAME enumeration, which is similar to the enumeration ENUM_TIMEFRAMES in MQL5.
Please note: In Python, the elements of this enumeration are prefixed with TIMEFRAME_, while the elements of a similar enumeration in MQL5 are prefixed with PERIOD_.
Identifier |
Description |
|---|---|
TIMEFRAME_M1 |
1 minute |
TIMEFRAME_M2 |
2 minutes |
TIMEFRAME_M3 |
3 minutes |
TIMEFRAME_M4 |
4 minutes |
TIMEFRAME_M5 |
5 minutes |
TIMEFRAME_M6 |
6 minutes |
TIMEFRAME_M10 |
10 minutes |
TIMEFRAME_M12 |
12 minutes |
TIMEFRAME_M12 |
15 minutes |
TIMEFRAME_M20 |
20 minutes |
TIMEFRAME_M30 |
30 minutes |
TIMEFRAME_H1 |
1 hour |
TIMEFRAME_H2 |
2 hours |
TIMEFRAME_H3 |
3 hours |
TIMEFRAME_H4 |
4 hours |
TIMEFRAME_H6 |
6 hours |
TIMEFRAME_H8 |
8 hours |
TIMEFRAME_H12 |
12 hours |
TIMEFRAME_D1 |
1 day |
TIMEFRAME_W1 |
1 week |
TIMEFRAME_MN1 |
1 month |
All three functions return bars as a numpy batch array with named columns time, open, high, low, close, tick_volume, spread, and real_volume. The numpy.ndarray array is a more efficient analog of named tuples. To access columns, use square bracket notation, array['column'].
None is returned if an error occurs.
All function parameters are mandatory and unnamed.
numpy.ndarray copy_rates_from(symbol, timeframe, date_from, count)
The copy_rates_from function requests bars starting from the specified date (date_from) in the number of count bars. The date can be set by the datetime object, or as the number of seconds since 1970.01.01.
When creating the datetime object, Python uses the local time zone, while the MetaTrader 5 terminal stores tick and bar open times in UTC (GMT, no offset). Therefore, to execute functions that use time, it is necessary to create datetime variables in UTC. To configure timezones, you can use the pytz package. For example (see MQL5/Scripts/MQL5Book/Python/eurusdrates.py):
from datetime import datetime
|
A sample of received data:
(1641567600, 1.12975, 1.13226, 1.12922, 1.13017, 8325, 0, 0)
|
numpy.ndarray copy_rates_from_pos(symbol, timeframe, start, count)
The copy_rates_from_pos function requests bars starting from the specified start index, in the quantity of count.
The MetaTrader 5 terminal renders bars only within the limits of the history available to the user on the charts. The number of bars that are available to the user is set in the settings by the parameter "Max. bars in the window".
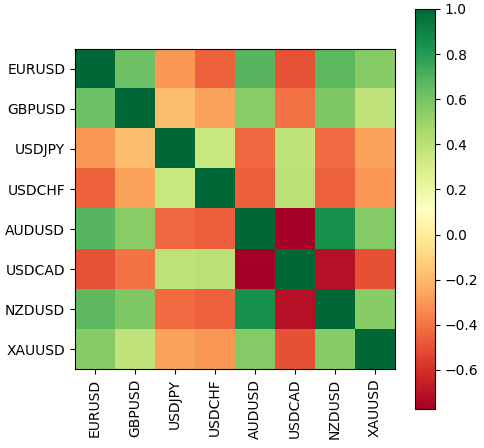
The following example (MQL5/Scripts/MQL5Book/Python/ratescorr.py) shows a graphic representation of the correlation matrix of several currencies based on quotes.
import MetaTrader5 as mt5
|
The image file ratescorr.png is formed in the sandbox of the current working copy of MetaTrader 5. Interactive display of an image in a separate window using a call to plt.show() may not work if your Python installation does not include the Optional Features "tcl/tk and IDLE" or if you do not add the pip install.tk package.

Forex currency correlation matrix
numpy.ndarray copy_rates_range(symbol, timeframe, date_from, date_to)
The copy_rates_range function allows you to get bars in the specified date and time range, between date_from and date_to: both values are given as the number of seconds since the beginning of 1970, in the UTC time zone (because Python uses datetime local timezone, you should convert using the module pytz). The result includes bars with times of opening, time >= date_from and time <= date_to.
In the following script, we will request bars in a specific time range.
from datetime import datetime
|
An example of the result:
time open high low close tick_volume spread real_volume 0 2020-01-10 00:00:00 109.513 109.527 109.505 109.521 43 2 0 1 2020-01-10 00:05:00 109.521 109.549 109.518 109.543 215 8 0 2 2020-01-10 00:10:00 109.543 109.543 109.466 109.505 98 10 0 3 2020-01-10 00:15:00 109.504 109.534 109.502 109.517 155 8 0 4 2020-01-10 00:20:00 109.517 109.539 109.513 109.527 71 4 0 5 2020-01-10 00:25:00 109.526 109.537 109.484 109.520 106 9 0 6 2020-01-10 00:30:00 109.520 109.524 109.508 109.510 205 7 0
|