Netsrac SR Dashboard
- Indicadores
- Carsten Pflug
- Versão: 2.20
- Atualizado: 22 outubro 2020
- Ativações: 15
Big summer sale. Save up to 40% on my products. SR dashboard - save 10$!
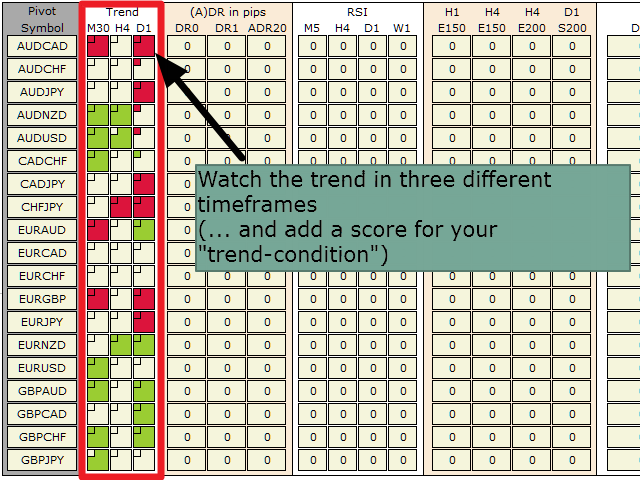
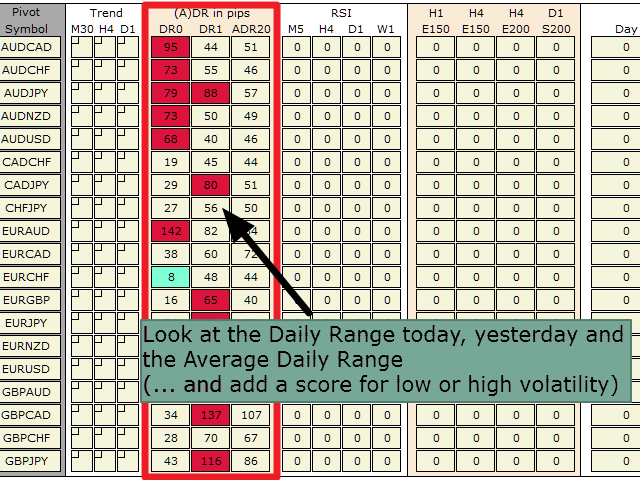
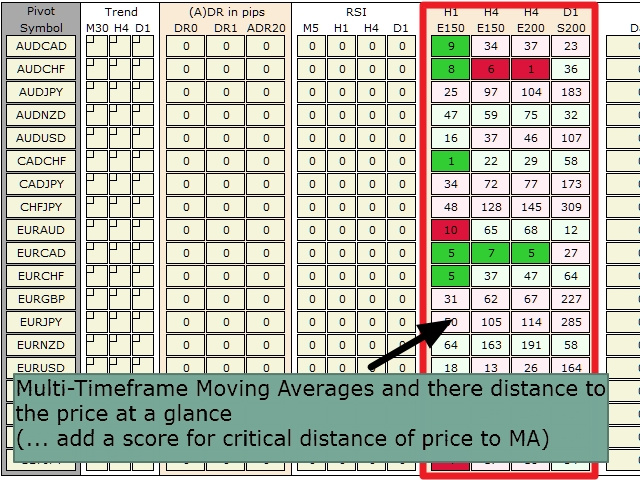
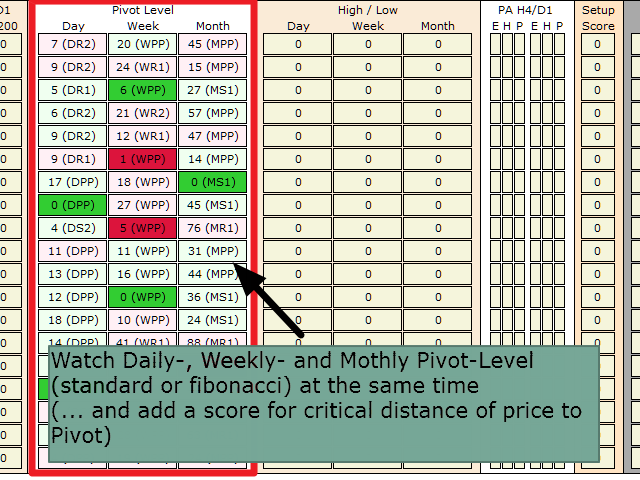
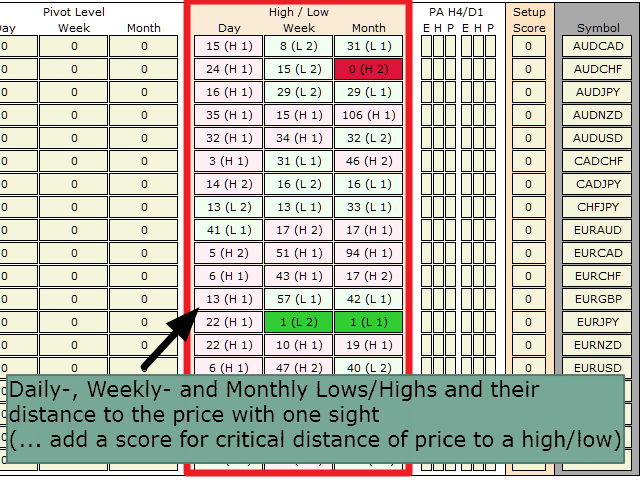
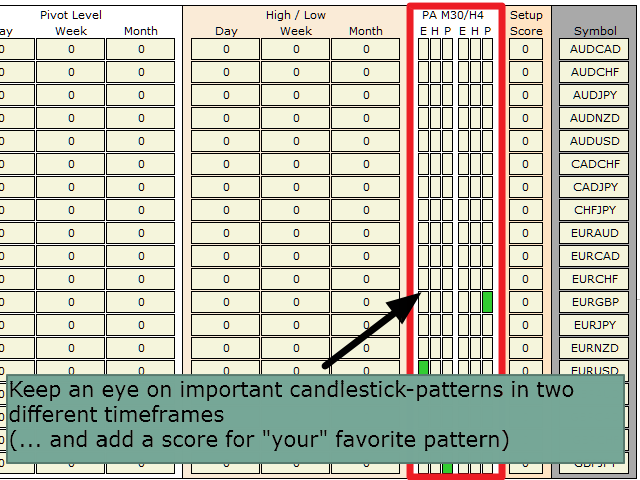
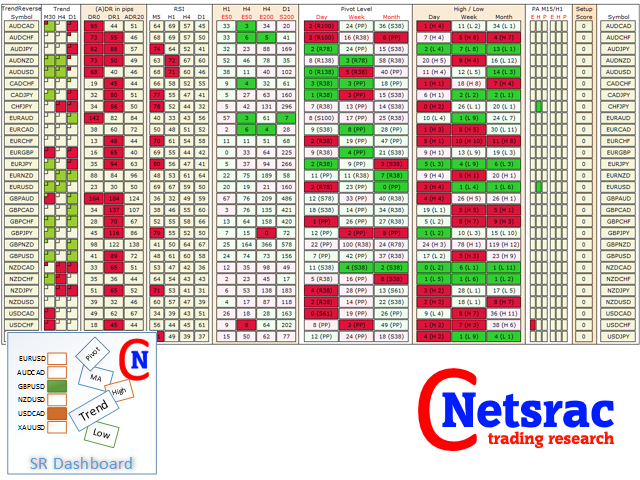
With the SR Dashboard, you get a powerful tool to control some of the most important information in trading. Assemble a setup according to your strategy and get informed as soon as this setup is valid. Assign scores to defined conditions and let the Dashboard find them. Choose from Trend, Average Daily Range, RSI, Moving Averages, Pivot (Daily, Weekly, Monthly), Highs and Lows, Candlestick Patterns.
Note: This indicator cannot be used in the Strategy Tester. The demo version here from the market does not work. Please use the free version of the indicator for testing: https://www.mql5.com/de/market/product/34863
What can you do with this tool?
With the SR Dashboard, you will be able to find some interesting trading setups in a faster and smarter way. Some of these setups are described in our new blog series:
- Using the "Netsrac SR Dashboard" (quick guide)
- Trading Pinbars
- Quick Set-Gets with the Dashboard
- Trade the Engulfing Pattern
- Weekly pivot as potential reversal points
- Scalping the short term trend
- Trend trading with important moving averages
- Volatility outbreak
- ... (may continue)
Manual


great product really helps you out with your trading