Alain Verleyen
|
11+ years
experience
|
5
products
|
81
demo versions
|
|
302
jobs
|
0
signals
|
0
subscribers
|
Visit our all-new Stein Investments Welcome Page to get the latest information, updates and trading strategies at https://www.mql5.com/en/blogs/post/755375
Follow our daily analysis channel at https://www.mql5.com/en/channels/morningbriefing
Our portfolio on the Market at https://www.mql5.com/en/users/blueball/seller
If there are questions, just contact us and we'll be happy to help.
All the best and happy trading
Alain
____________________________________________________________________
Please note I don't take freelance jobs any more. Thanks for your understandings.


Alain Verleyen

1
Lorentzos Roussos
2023.08.10
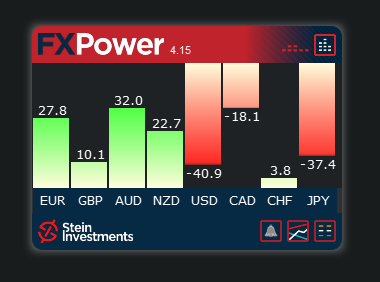
start the bar gradient from the background color instead of white and add rectangle borders with a color slightly brighter than the background .