|
11+ 年
经验
|
3
产品
|
397
演示版
|
|
0
工作
|
0
信号
|
0
订阅者
|
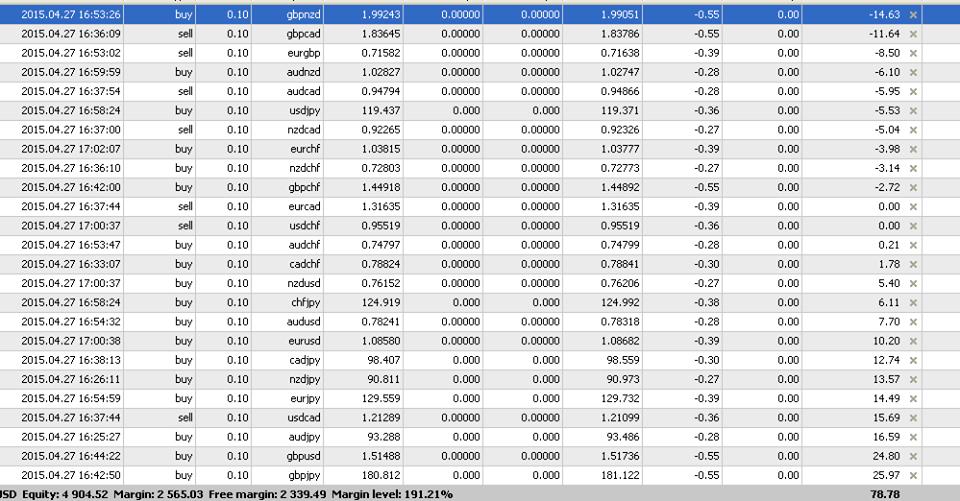
基于纯数学的外汇MT4机器人!
世界上许多事情是不确定的,并受概率规则的约束。 我的头脑中有一个模型,将来会有什么变化,数字模型越好越好预测未来。
我与电脑模型一起尝试捕捉现实统计。 这些往往是非常复杂的,涉及大量的变量。
过去的模拟依赖于重复的随机抽样近似某些结果的概率,是外汇变量中使用的一种方法,并在我的机器人中练习。
信号提供者的提供者!
世界上许多事情是不确定的,并受概率规则的约束。 我的头脑中有一个模型,将来会有什么变化,数字模型越好越好预测未来。
我与电脑模型一起尝试捕捉现实统计。 这些往往是非常复杂的,涉及大量的变量。
过去的模拟依赖于重复的随机抽样近似某些结果的概率,是外汇变量中使用的一种方法,并在我的机器人中练习。
信号提供者的提供者!