已发布的产品
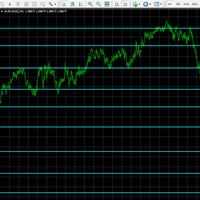
A powerful chart indicator which intelligently analyses Index, FX & Commodity prices to identify the strongest support and resistance price boundaries. Each line shows where prices consistently close, while the frequency of these matching prices is quoted to reflect each boundary strength. Use these predictive boundaries to identify pivot points, resistance and support levels for crossover, trending, reversal and channel strategies. For FX pairs, set volatility filter = 1 For Indices & Commodit

可靠的专家顾问,用于交易纳斯达克,成绩令人印象深刻。
该算法检测到中高波动性价格波动,并且只在利润高度可靠的情况下参与。
查看截图,了解连续12个月以上的稳定表现,通常每月生成30笔交易。
根据需要以固定货币金额获利并实施止损。
通过TimeZoneAdjust设置正确的时区以匹配您本地计算机时间至关重要:英国=0,纽约=-5,柏林=1,利雅得=3,迪拜=4,曼谷=7,东京=9,悉尼=11
建议使用1分钟时间段,交易重点是美国市场开放时间0930-1100(美国时间)/1430-1700(英国时间)
该算法针对纳斯达克进行了优化,因此避免将其部署在其他金融工具上。
记得在市场波动性高的时期特别小心地使用交易机器人,并进行监督。
通过michael@organicstrategy.net与我联系
感谢您的下载!