Syarif Nur Arief / 卖家
已发布的产品

MACD is well known indicator that still can be use for prediction where price will go next few minutes, hours or even weekly With colored bar of Macd, your eyes can easily catch when color is changed based what market price movement to find any early trend on market. here is the parameter of the indicator: TF_MACD , default is 1 Hour , this mean you can see clearly MACD of 1 Hour TimeFrame on Lower TimeFrame. InpPrice , default is Price Close , this is original MACD parameter from Metaquotes st
FREE

We never know what market price will go on next second. That's why a trader needs to find a good way to have a good exit strategy. Quadro Multi Grid Scalper is a High Frequency Grid scalper using Dynamic Fibo Level, with only 3 maximum Opened order each cycle, will make less risk to your account. This EA uses Averaging exit system with changable martingale settings, and uses total profit target to closing all. Recommended Broker Parameters: Low spread less than 1 pip (you will have fast open an

This is an old and well-known strategy from the book "Sure Fire Hedging Strategy", but have more Advance Parameter than anyother old style Hedge Averaging EA. This strategy is using a hedge order with a higher lot size for the last (opposite) order and will receive profit if your free margin is huge enough to handle. A good money management is needed for using this system. No Pending order used on this EA, because using pending order will have more high risk order slipage and Spread can be diff

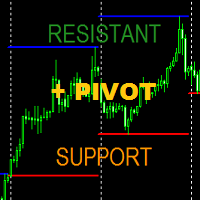
Indicator can drawing Support Level (Lowest price of choosed Time Frame) and Resistance Level (Highest price of choosed Time Frame), and this indicator can drawing last of Pivot Level from the Last of Support Resistance Level. Support and Resistance based Highest and Lowest at choosed Time Frame can be your next good experience for your forex trade to maximize your trade win and lost ratio.
Parameter : _S_and_R__Setup_ , Default is # SUPPORT AND RESISTANT # , No Need To Change Drawin

Super grid nineth (ninth) generation is another grid type EA on this huge forex system population, this EA not using any indicator to avoid any fake signaling to open or closing position orders. This EA will open pending order stop and limit in the first time EA run, then maintain all opened order with unique way to balancing account free margin and make equity growth. This EA have unique system not like anyother grid EA, with correct setup and run on max 3 pairs in one account, this EA capable

Gold Eye is one of advance profesional expert that use deep neural network to catch probability of true trend on XauUsd market,
this expert can be run on forex pairs also (Default setup is for XauUsd).
This expert can be set as trend grid follower, or can be set as like hedging system but with flat lot size (not using martingale).
Then unique setup for Money Profit/Loss management is the good things not like any others paid expert here on Mql5. # EA MUST BACKTEST USING TIME_FRAME_001 # PARAMETER

This EA can predict early trend on market, scan early trend from M5 to W1, This EA not martingale, not a hedging, not averaging and not grid. And this EA only open/close position once (only 1 opened order) every 8 hours. EA parameters : Trade_Set_AUTO , Default is ## AUTO Trade Setting ## , Mean Note for below parameter. LOT_SIZE_AUTO_TRADE , Default is 0.01 , Mean Lot Size to be traded is 0.01 Lot, Can be changed depend your account balance, (0.01 Lot Per 200 usd initial balance). A

如此多的 EA 和 Copy Signal 正在使用带有 mar 的平均网格系统,甚至使用固定手数,它们在变化中有点差,还有他们一次同时下订单 3-5 的方式,这些很快就会成为定时炸弹 或后者会破坏您的帐户。
我在这里有超过 8 年的经验,我发现了网格平均系统的新方法,不像任何其他网格平均 EA 或任何使用网格平均系统的复制信号。
我的网格对于每个单独的未平仓头寸都有更动态的点差,并且与任何其他 EA 不同的是更动态的个人获利,所以通过这种方式,图表上最高或最低市场价格的未平仓头寸不再过多。
可以放置所有对,我将指导可以设置多远的点差和止盈,但是我的 EA 仍然是一个网格系统,必须对使用手数和最大未平仓头寸设置多少进行严格的资金管理,
最后一句话,我的 EA 比任何其他网格 EA 都更有效,您可以在测试仪上进行测试并进行比较。
这是 EA 参数;
Setup1,默认为Lot & TP Setting,无需更改 Lots ,默认为0.01,是开仓的手数 TakeProfit ,默认为 500.0,止盈(点数) xxxx ,默认为空,不用改 Setup2,默认是Start

Overview [TEMA MOVING AVERAGE CHANNEL] is a precision-engineered Expert Advisor designed to catch market spikes and ride profitable moves with minimal guesswork.
Using a multi-timeframe SPIKE detection system , it blends short-term momentum with higher-timeframe confirmation for maximum accuracy. Key Features 4 Trade Levels – From conservative (Level 0) to extreme (Level 3). Multi-Timeframe SPIKE Analysis – Current TF + 2 higher TF filters. Instant Trade Activation – Enter right at