
|
6+ 年
经验
|
0
产品
|
0
演示版
|
|
0
工作
|
0
信号
|
0
订阅者
|
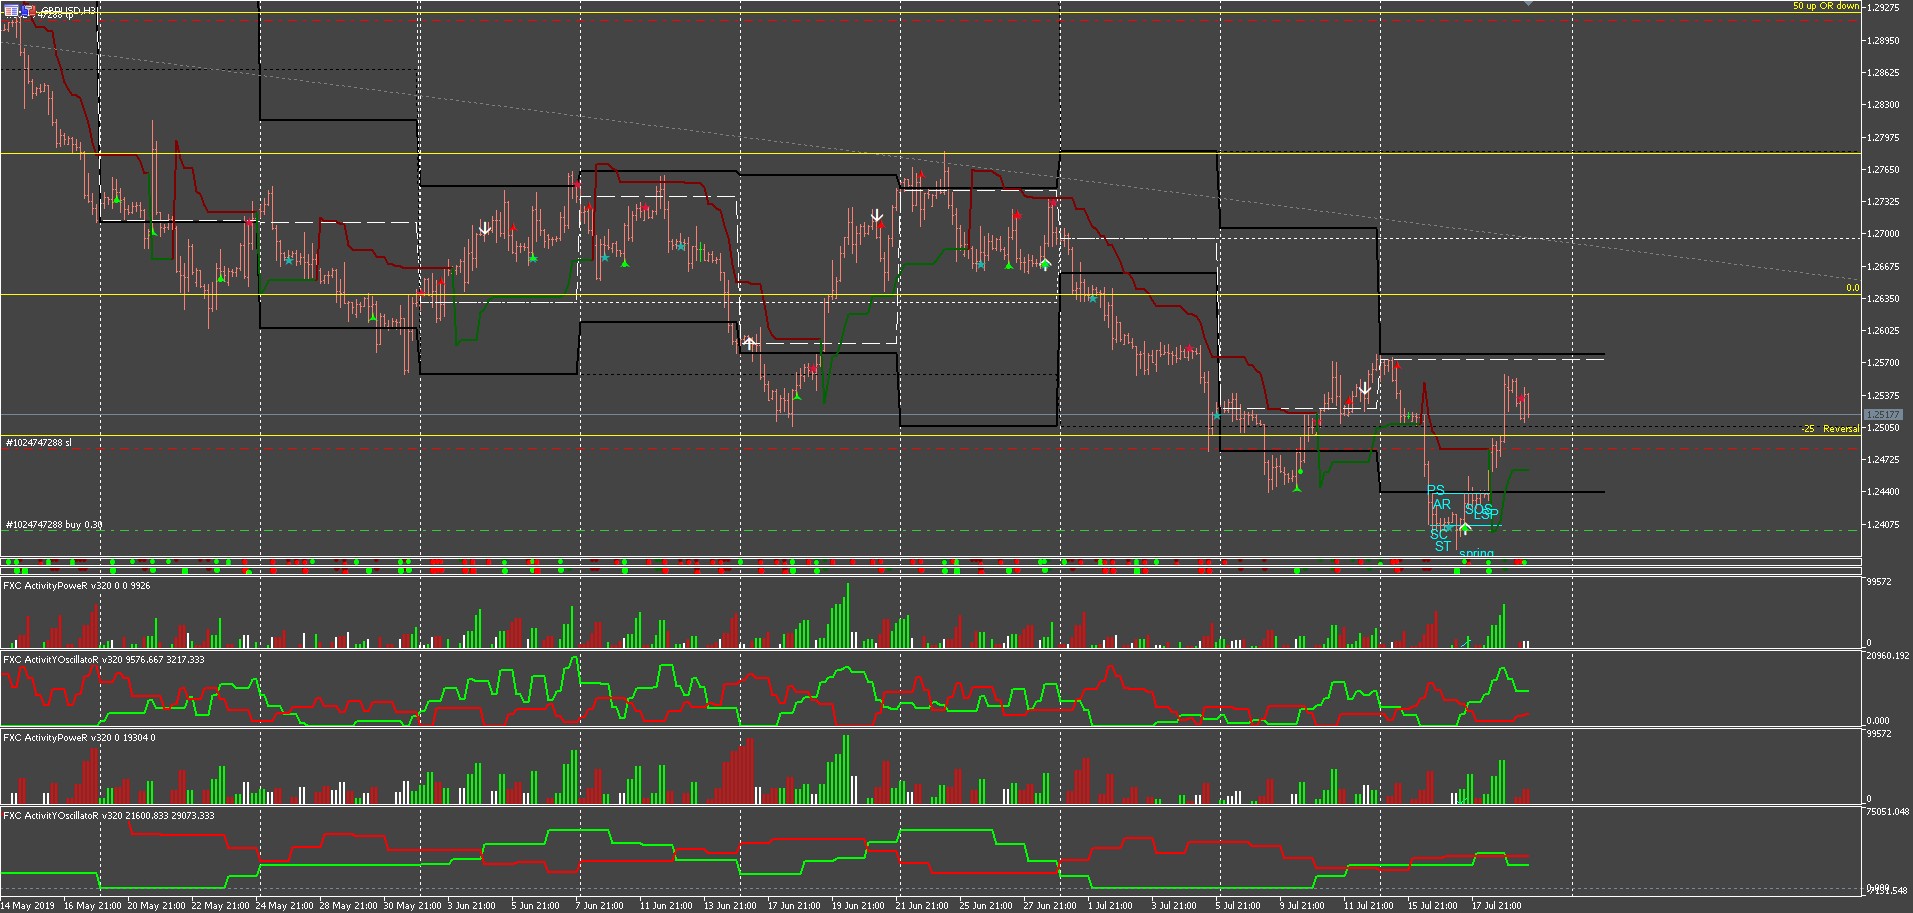
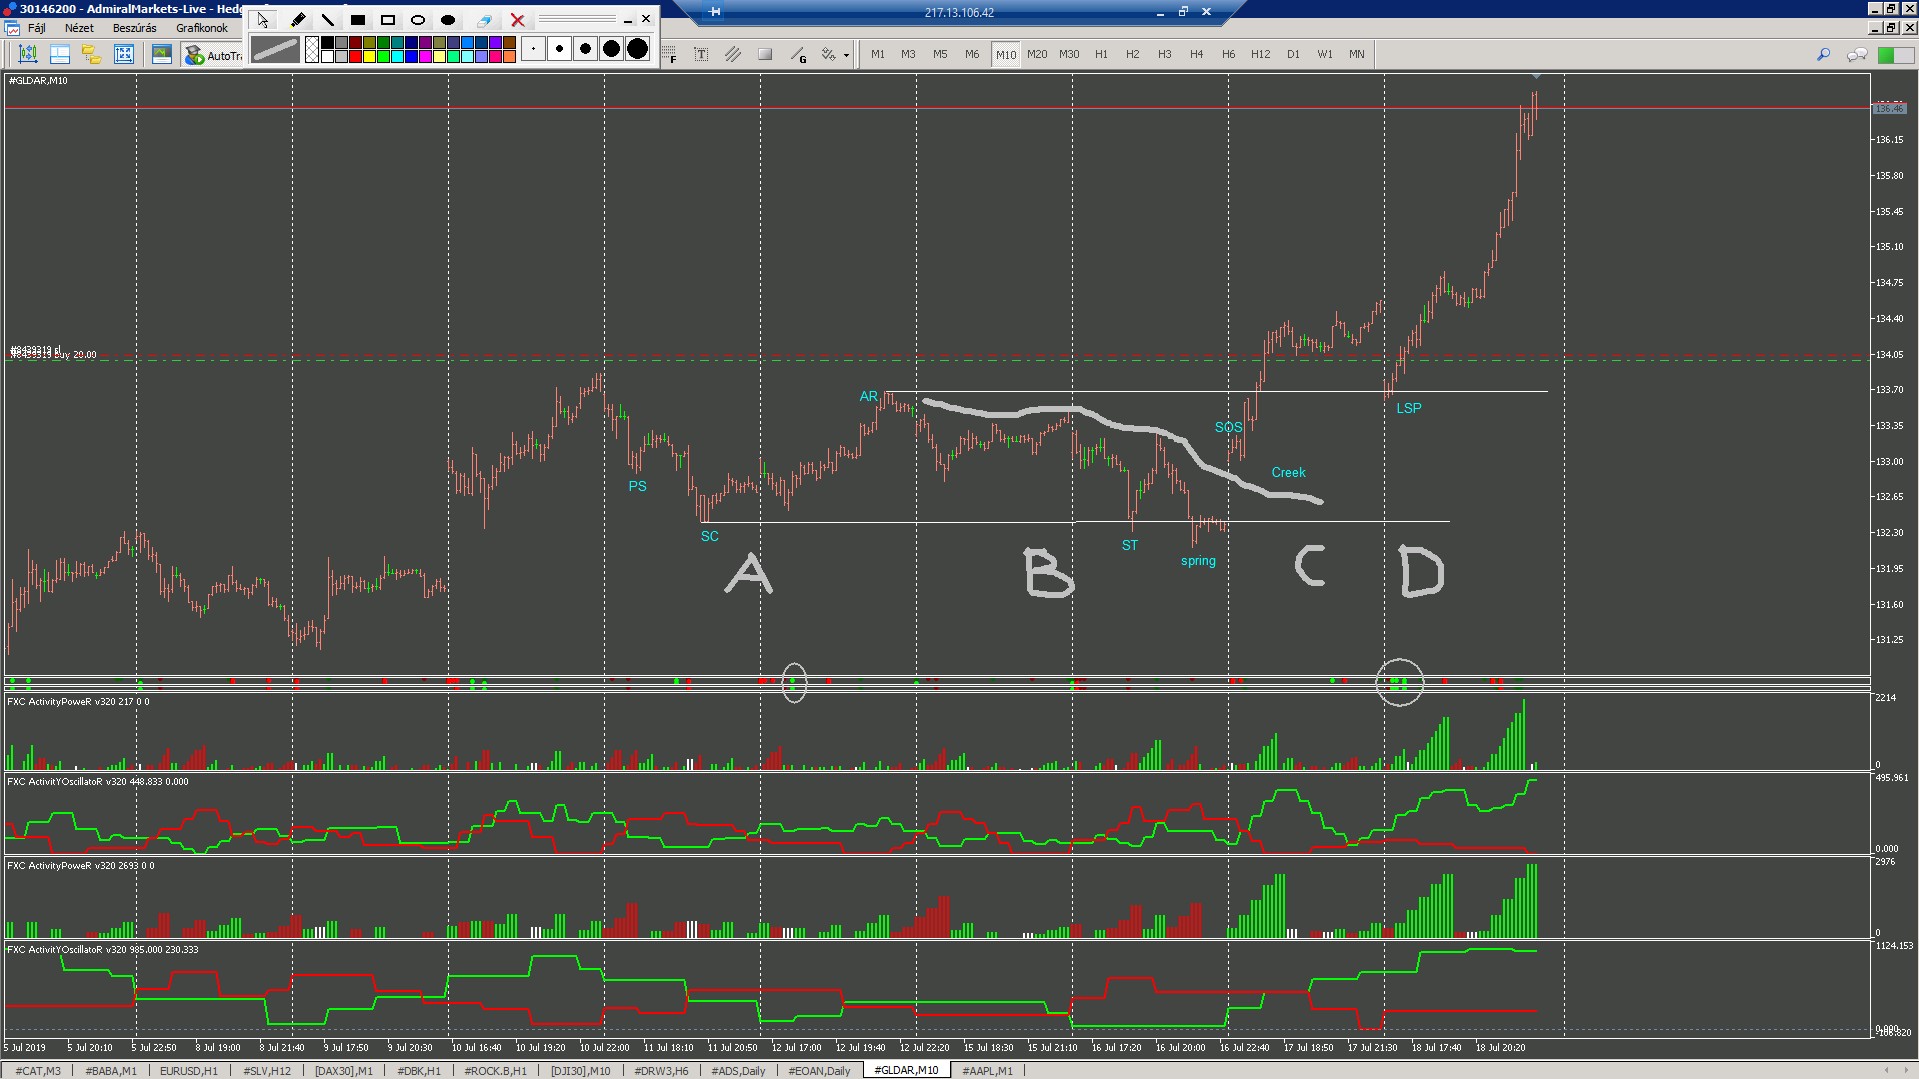
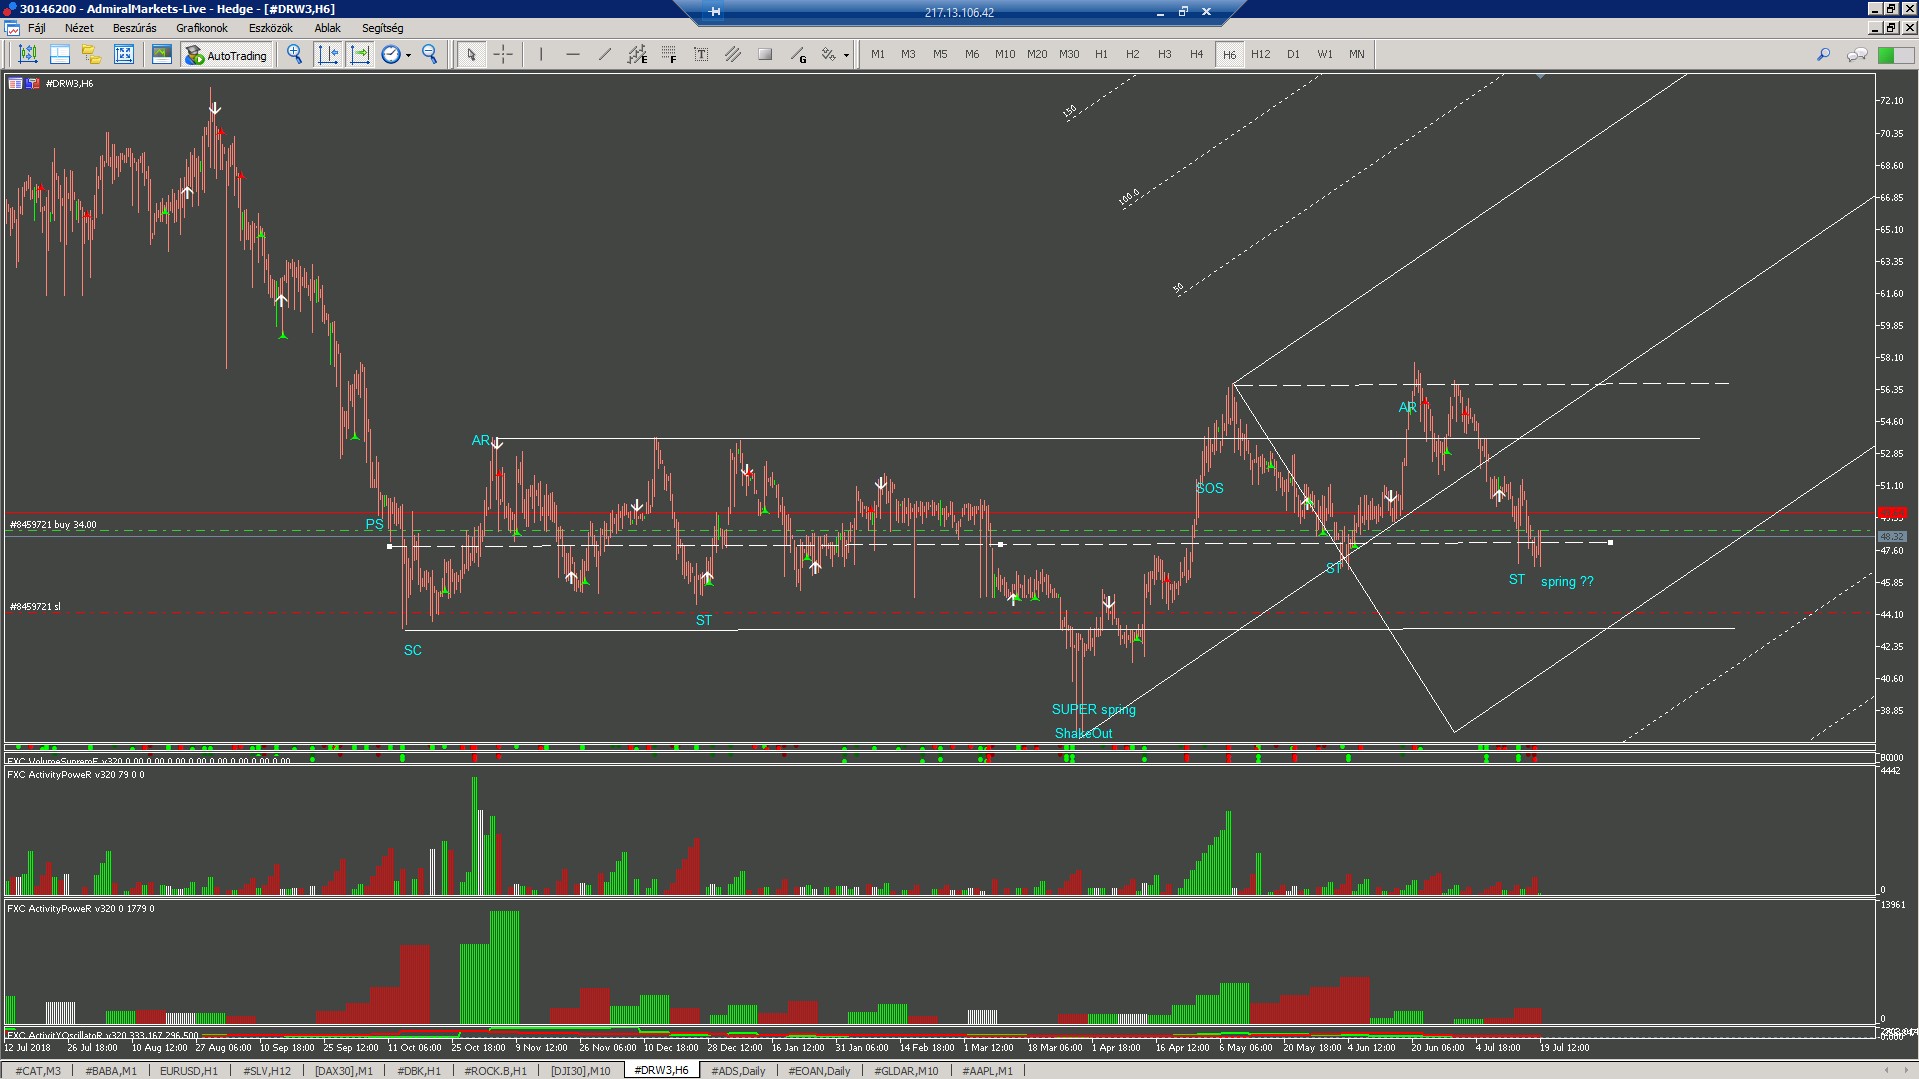
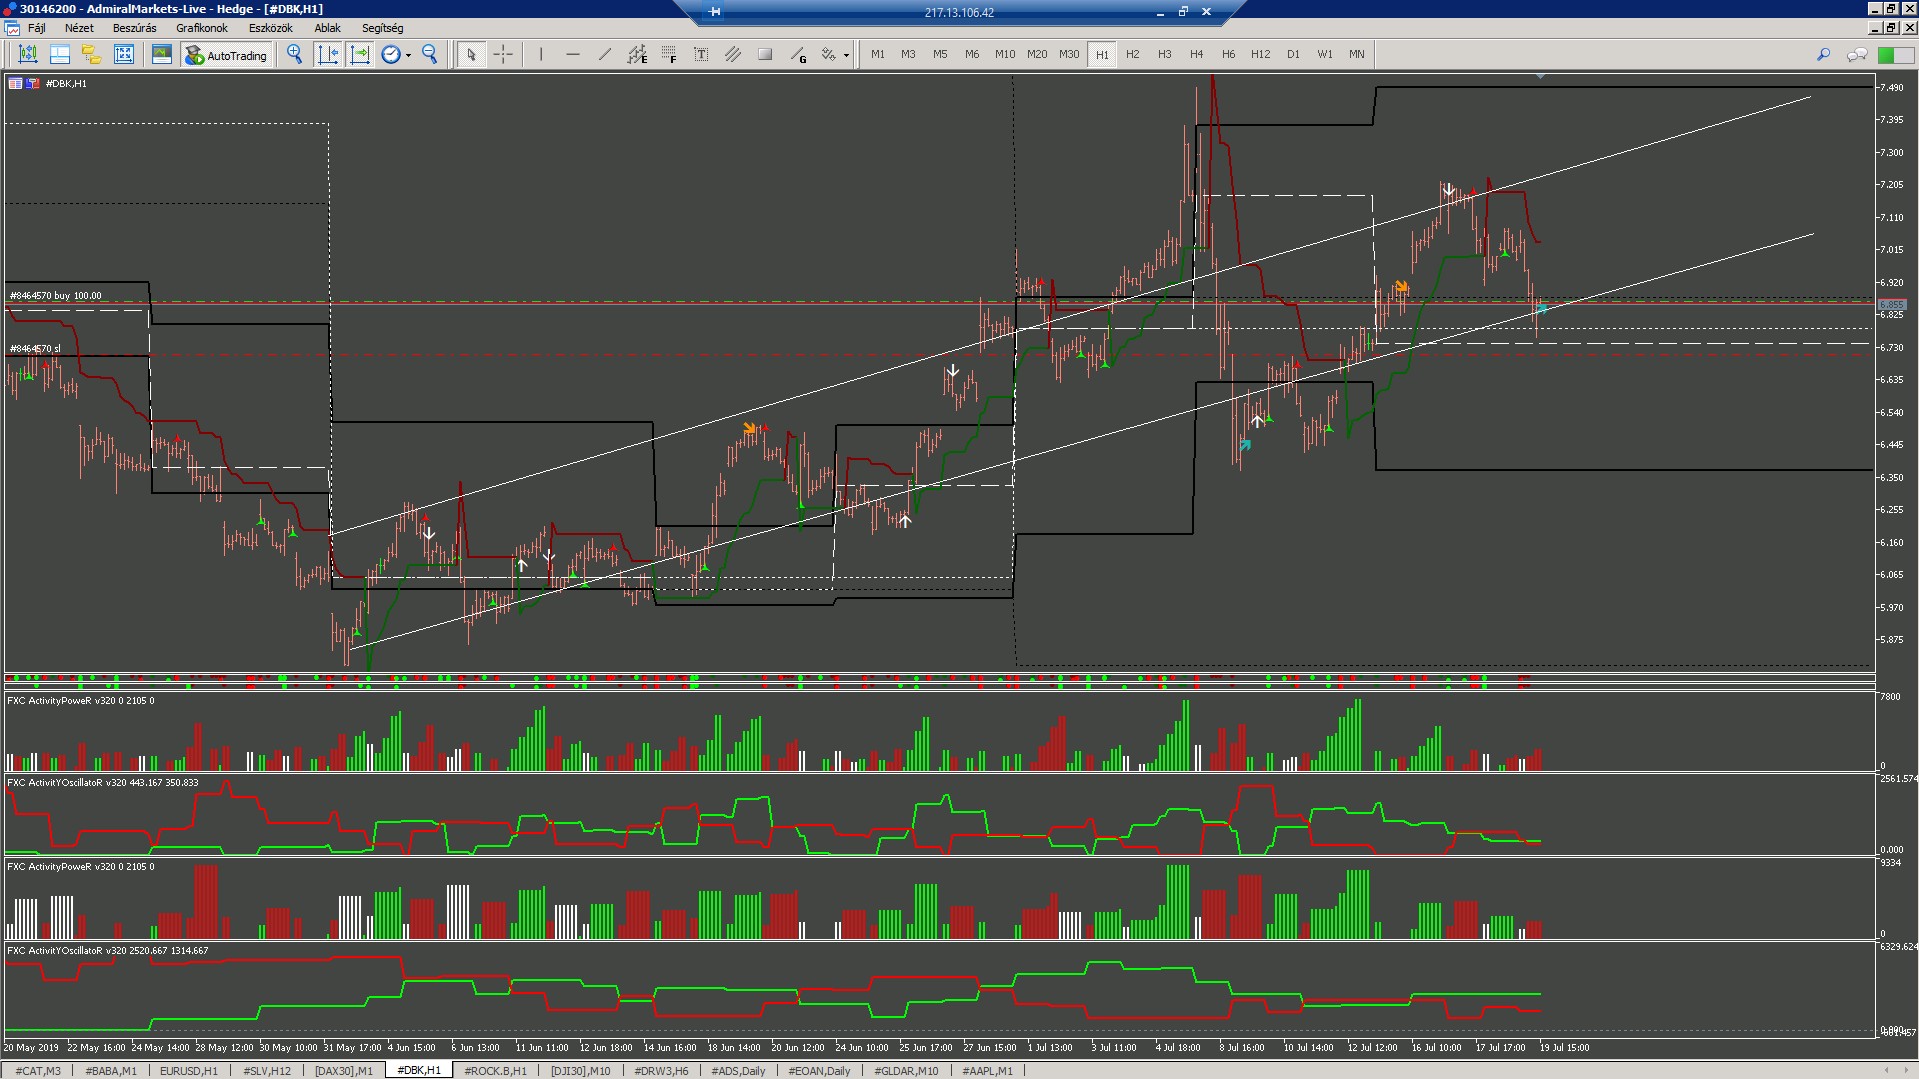
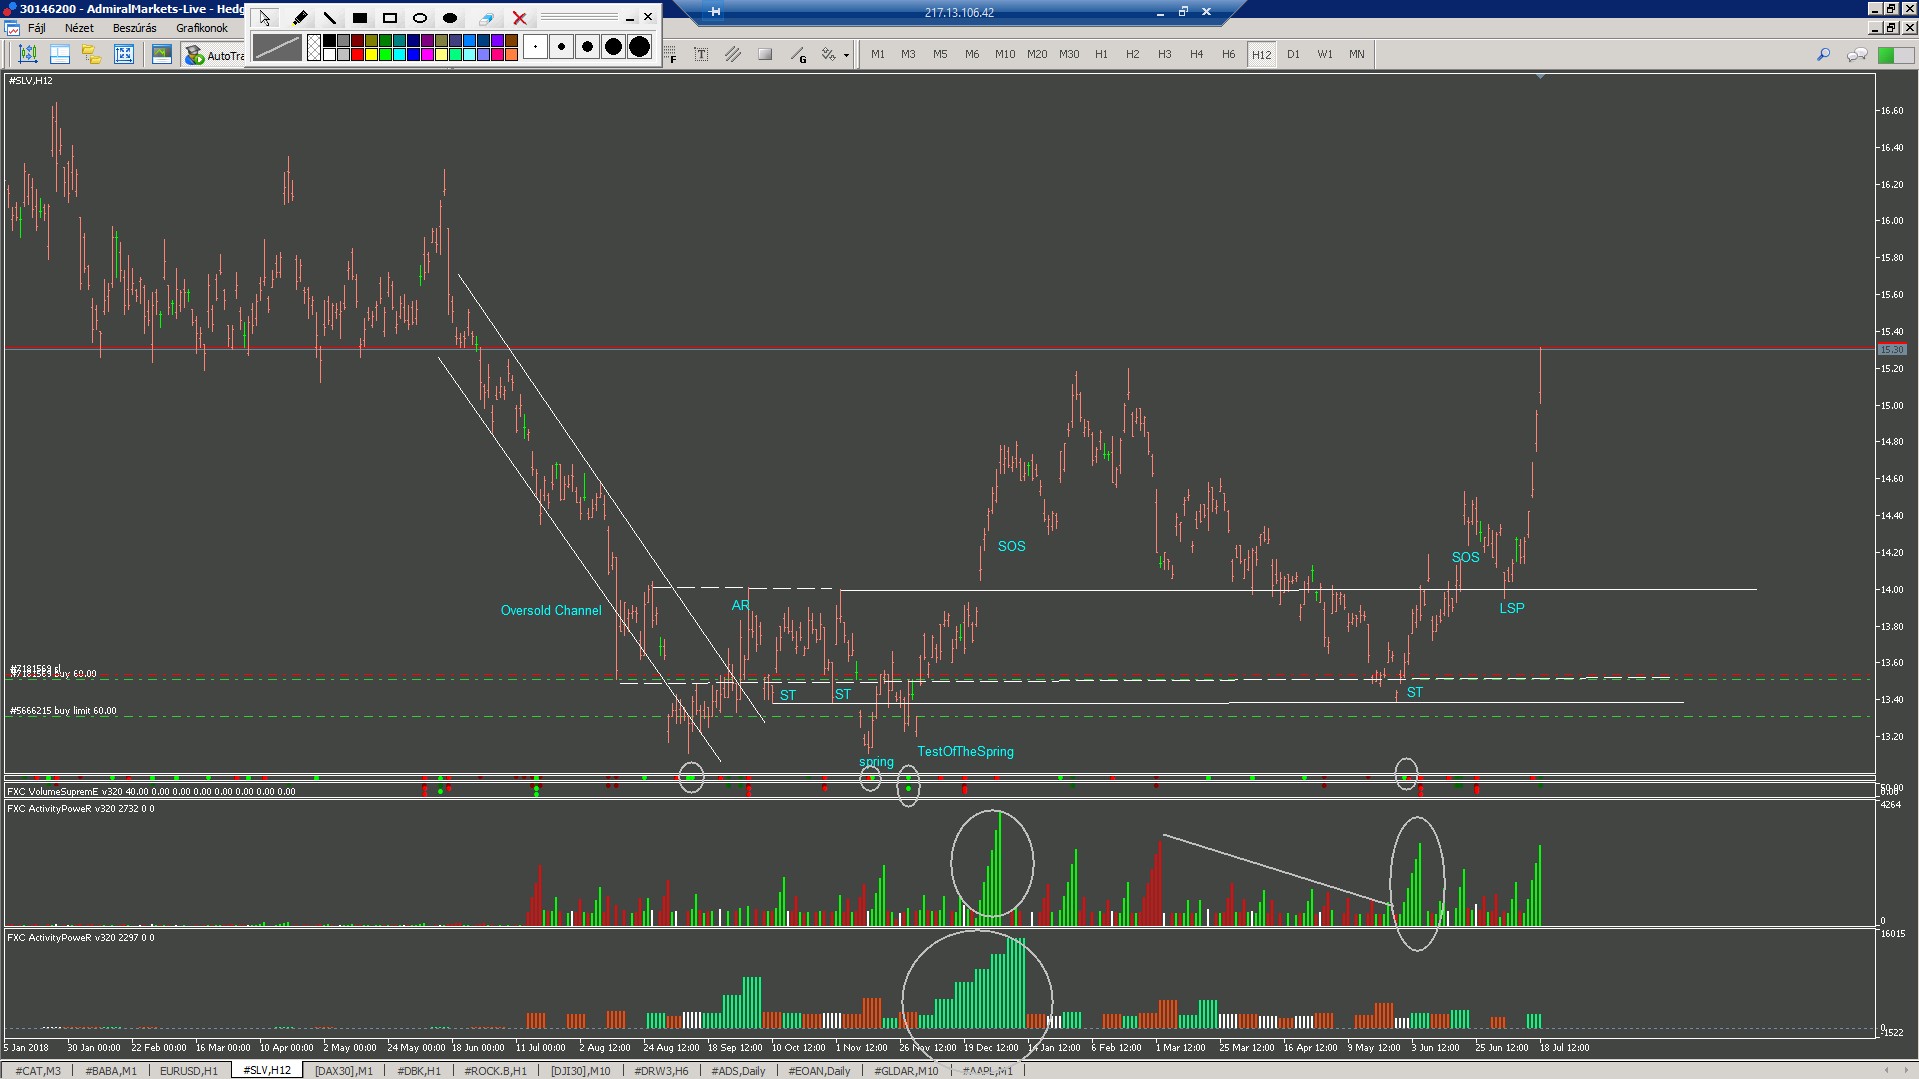
"Digital Adoption of the Wyckoff Method.
Powered by Insights from David Weis' Landmark Webinar:
Weis on Wyckoff, Support/Resistance, and Waves."
Powered by Insights from David Weis' Landmark Webinar:
Weis on Wyckoff, Support/Resistance, and Waves."

Zoltan Nemet

· 1
Joe V
2022.01.16
I just have a question. The example you have of the (FXC ActivityPowerR v321 3956 0 0) . I like to looks of this one, but my question is, how do I set it up