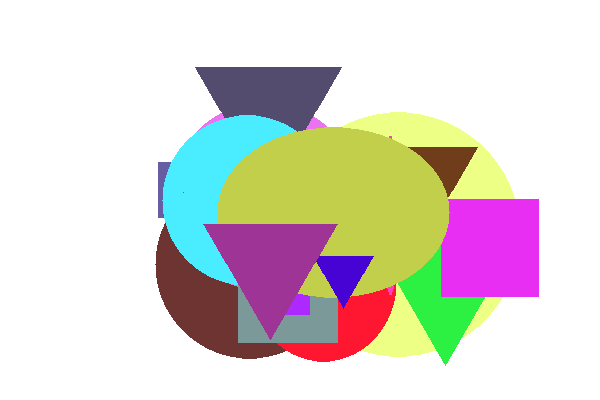
保存图像到文件:ResourceSave
借助 MQL5 API,你可以使用 ResourceSave 函数将资源写入 BMP 文件。该框架目前仅支持图像资源。
bool ResourceSave(const string resource, const string filename)
resource 和 filename 参数分别指定资源和文件的名称。资源名称必须以 "::" 开头。文件名可以包含相对于 MQL5/Files 文件夹的路径。如有必要,该函数将创建所有中间子目录。如果指定的文件存在,它将被覆盖。
函数成功时返回 true。
为了测试此函数的操作,最好创建一个原始图像。我们正好有适合这个的图像。
作为 OOP 学习的一部分,在 类和接口一章中,我们开始了一系列关于图形形状的示例:从 类定义 一节中的第一个版本 Shapes1.mq5 到 嵌套类型中的最后一个版本 Shapes6.mq5。那时我们还无法进行绘图,直到关于图形对象的章节,我们才能够在 ObjectShapesDraw.mq5脚本中实现可视化。现在,在学习了图形资源之后,是时候进行另一次“升级”了。
在新版本的 ResourceShapesDraw.mq5 脚本中,我们将绘制这些形状。为了更容易地与先前版本比较更改,我们将保留相同的形状集:矩形、正方形、椭圆形、圆形和三角形。这样做是为了举例说明,而不是因为有什么限制我们绘图:相反,在扩展形状集、视觉效果和标签方面存在潜力。我们将通过几个示例来了解这些特性,从当前的这个开始。但是,请注意,本书的范围无法演示所有应用。
在生成并绘制形状后,我们将生成的资源保存到文件中。
形状类层次结构的基础是具有 draw 方法的 Shape 类。
class Shape
{
public:
...
virtual void draw() = 0;
...
}
|
在派生类中,它是基于图形对象实现的,通过调用 ObjectCreate 并随后使用 ObjectSet 函数设置对象。这种绘图的共享画布是图表本身。
现在我们需要根据特定的形状在某个共享资源中绘制像素。最好将公共资源和修改其中像素的方法分配到一个单独的类中,或者更好的是,一个接口中。
抽象实体将使我们不必与创建和配置资源的方法产生联系。特别是,我们的下一个实现会将资源放置在 OBJ_BITMAP_LABEL 对象中(正如我们在本章中已经做过的那样),而对于某些情况,可能只需要在内存中生成图像并保存到磁盘而无需绘制(许多交易者喜欢定期捕获图表状态)。
我们称这个接口为 Drawing。
interface Drawing
{
void point(const float x1, const float y1, const uint pixel);
void line(const int x1, const int y1, const int x2, const int y2, const color clr);
void rect(const int x1, const int y1, const int x2, const int y2, const color clr);
};
|
这里只有三个最基本的绘图方法,对于本例来说已经足够了。
point 方法是公共的(这使得可以绘制一个单独的点),但在某种意义上它是低级的,因为所有其他方法都将通过它来实现。这就是为什么其中的坐标是真实的,并且像素的内容是 uint 类型的现成值。这将允许在必要时应用各种抗锯齿算法,以使形状看起来不会因像素化而出现阶梯状。这里我们不讨论这个问题。
考虑到接口,Shape::draw 方法变为以下形式:
virtual void draw(Drawing *drawing) = 0;
|
然后,在 Rectangle 类中,很容易将矩形的绘制委托给新的接口。
class Rectangle : public Shape
{
protected:
int dx, dy; // size (width, height)
...
public:
void draw(Drawing *drawing) override
{
// x, y - anchor point (center) in Shape
drawing.rect(x – dx / 2, y – dy / 2, x + dx / 2, y + dy / 2, backgroundColor);
}
};
|
绘制椭圆需要更多的努力。
class Ellipse : public Shape
{
protected:
int dx, dy; // large and small radii
...
public:
void draw(Drawing *drawing) override
{
// (x, y) - center
const int hh = dy * dy;
const int ww = dx * dx;
const int hhww = hh * ww;
int x0 = dx;
int step = 0;
// main horizontal diameter
drawing.line(x - dx, y, x + dx, y, backgroundColor);
// horizontal lines in the upper and lower half, symmetrically decreasing in length
for(int j = 1; j <= dy; j++)
{
for(int x1 = x0 - (step - 1); x1 > 0; --x1)
{
if(x1 * x1 * hh + j * j * ww <= hhww)
{
step = x0 - x1;
break;
}
}
x0 -= step;
drawing.line(x - x0, y - j, x + x0, y - j, backgroundColor);
drawing.line(x - x0, y + j, x + x0, y + j, backgroundColor);
}
}
};
|
最后,对于三角形,渲染实现如下。
class Triangle: public Shape
{
protected:
int dx; // one size, because triangles are equilateral
...
public:
virtual void draw(Drawing *drawing) override
{
// (x, y) - center
// R = a * sqrt(3) / 3
// p0: x, y + R
// p1: x - R * cos(30), y - R * sin(30)
// p2: x + R * cos(30), y - R * sin(30)
// Pythagorean height: dx * dx = dx * dx / 4 + h * h
// sqrt(dx * dx * 3/4) = h
const double R = dx * sqrt(3) / 3;
const double H = sqrt(dx * dx * 3 / 4);
const double angle = H / (dx / 2);
// main vertical line (triangle height)
const int base = y + (int)(R - H);
drawing.line(x, y + (int)R, x, base, backgroundColor);
// smaller vertical lines left and right, symmetrical
for(int j = 1; j <= dx / 2; ++j)
{
drawing.line(x - j, y + (int)(R - angle * j), x - j, base, backgroundColor);
drawing.line(x + j, y + (int)(R - angle * j), x + j, base, backgroundColor);
}
}
};
|
现在,我们转向派生自 Drawing 接口的 MyDrawing 类。正是 MyDrawing 必须在形状中接口方法调用的指导下,确保某个资源显示在位图中。因此,该类描述了图形对象 (object) 和资源 (sheet) 名称的变量,以及用于存储图像的 uint 类型 data 数组。此外,我们移动了先前在 OnStart 处理程序中声明的形状数组 shapes。由于 MyDrawing 负责绘制所有形状,因此最好在这里管理它们的集合。
class MyDrawing: public Drawing
{
const string object; // object with bitmap
const string sheet; // resource
uint data[]; // pixels
int width, height; // dimensions
AutoPtr<Shape> shapes[]; // figures/shapes
const uint bg; // background color
...
|
在构造函数中,我们为整个图表的大小创建一个图形对象,并为 data 数组分配内存。画布用零(表示“黑色透明”)或 background 参数中传递的任何值填充,然后基于它创建一个资源。默认情况下,资源名称以字母 'D' 开头并包含当前图表的 ID,但你可以指定其他名称。
public:
MyDrawing(const uint background = 0, const string s = NULL) :
object((s == NULL ? "Drawing" : s)),
sheet("::" + (s == NULL ? "D" + (string)ChartID() : s)), bg(background)
{
width = (int)ChartGetInteger(0, CHART_WIDTH_IN_PIXELS);
height = (int)ChartGetInteger(0, CHART_HEIGHT_IN_PIXELS);
ArrayResize(data, width * height);
ArrayInitialize(data, background);
ResourceCreate(sheet, data, width, height, 0, 0, width, COLOR_FORMAT_ARGB_NORMALIZE);
ObjectCreate(0, object, OBJ_BITMAP_LABEL, 0, 0, 0);
ObjectSetInteger(0, object, OBJPROP_XDISTANCE, 0);
ObjectSetInteger(0, object, OBJPROP_YDISTANCE, 0);
ObjectSetInteger(0, object, OBJPROP_XSIZE, width);
ObjectSetInteger(0, object, OBJPROP_YSIZE, height);
ObjectSetString(0, object, OBJPROP_BMPFILE, sheet);
}
|
调用代码可以使用 resource 方法找出资源的名称。
string resource() const
{
return sheet;
}
|
资源和对象在析构函数中被移除。
~MyDrawing()
{
ResourceFree(sheet);
ObjectDelete(0, object);
}
|
push 方法填充形状数组。
Shape *push(Shape *shape)
{
shapes[EXPAND(shapes)] = shape;
return shape;
}
|
draw 方法绘制形状。它只是在循环中调用每个形状的 draw 方法,然后更新资源和图表。
void draw()
{
for(int i = 0; i < ArraySize(shapes); ++i)
{
shapes[i][].draw(&this);
}
ResourceCreate(sheet, data, width, height, 0, 0, width, COLOR_FORMAT_ARGB_NORMALIZE);
ChartRedraw();
}
|
下面是最重要的方法,它们是 Drawing 接口的方法,并且实际实现绘图。
我们从 point 方法开始,我们暂时以简化形式呈现它(我们稍后会处理改进)。
virtual void point(const float x1, const float y1, const uint pixel) override
{
const int x_main = (int)MathRound(x1);
const int y_main = (int)MathRound(y1);
const int index = y_main * width + x_main;
if(index >= 0 && index < ArraySize(data))
{
data[index] = pixel;
}
}
|
基于 point,很容易实现直线绘制。当起点和终点的坐标在某个维度上匹配时,我们使用 rect 方法进行绘制,因为直线是单位厚度矩形的退化情况。
virtual void line(const int x1, const int y1, const int x2, const int y2, const color clr) override
{
if(x1 == x2) rect(x1, y1, x1, y2, clr);
else if(y1 == y2) rect(x1, y1, x2, y1, clr);
else
{
const uint pixel = ColorToARGB(clr);
double angle = 1.0 * (y2 - y1) / (x2 - x1);
if(fabs(angle) < 1) // step along the axis with the largest distance, x
{
const int sign = x2 > x1 ? +1 : -1;
for(int i = 0; i <= fabs(x2 - x1); ++i)
{
const float p = (float)(y1 + sign * i * angle);
point(x1 + sign * i, p, pixel);
}
}
else // or y-step
{
const int sign = y2 > y1 ? +1 : -1;
for(int i = 0; i <= fabs(y2 - y1); ++i)
{
const float p = (float)(x1 + sign * i / angle);
point(p, y1 + sign * i, pixel);
}
}
}
}
|
这是 rect 方法。
virtual void rect(const int x1, const int y1, const int x2, const int y2, const color clr) override
{
const uint pixel = ColorToARGB(clr);
for(int i = fmin(x1, x2); i <= fmax(x1, x2); ++i)
{
for(int j = fmin(y1, y2); j <= fmax(y1, y2); ++j)
{
point(i, j, pixel);
}
}
}
|
现在我们需要修改 OnStart 处理程序,脚本就准备好了。
首先,我们设置图表(隐藏所有元素)。理论上,这不是必需的:这样做是为了与原型脚本匹配。
void OnStart()
{
ChartSetInteger(0, CHART_SHOW, false);
...
|
接下来,我们描述 MyDrawing 类的对象,生成预定数量的随机形状(这里一切保持不变,包括 addRandomShape 生成器和等于 21 的 FIGURES 宏),在资源中绘制它们,并在图表上的对象中显示它们。
MyDrawing raster;
for(int i = 0; i < FIGURES; ++i)
{
raster.push(addRandomShape());
}
raster.draw(); // display the initial state
...
|
在 ObjectShapesDraw.mq5 示例中,我们启动了一个无限循环,在其中随机移动图形块。我们在这里重复这个技巧。这里我们需要添加 MyDrawing 类,因为形状数组存储在其中。我们编写一个简单的 shake 方法。
class MyDrawing: public Drawing
{
public:
...
void shake()
{
ArrayInitialize(data, bg);
for(int i = 0; i < ArraySize(shapes); ++i)
{
shapes[i][].move(random(20) - 10, random(20) - 10);
}
}
...
};
|
然后,在 OnStart 中,我们可以在循环中使用新方法,直到用户停止动画。
void OnStart()
{
...
while(!IsStopped())
{
Sleep(250);
raster.shake();
raster.draw();
}
...
}
|
至此,先前示例的功能实际上已经重复了。但是我们需要添加将图像保存到文件的功能。所以,我们添加一个输入参数 SaveImage。
input bool SaveImage = false;
|
当它设置为 true 时,检查 ResourceSave 函数的性能。
void OnStart()
{
...
if(SaveImage)
{
const string filename = "temp.bmp";
if(ResourceSave(raster.resource(), filename))
{
Print("Bitmap image saved: ", filename);
}
else
{
Print("Can't save image ", filename, ", ", E2S(_LastError));
}
}
}
|
另外,既然我们谈论的是输入变量,让用户选择一个背景并将结果值传递给 MyDrawing 构造函数。
input color BackgroundColor = clrNONE;
void OnStart()
{
...
MyDrawing raster(BackgroundColor != clrNONE ? ColorToARGB(BackgroundColor) : 0);
...
}
|
那么,一切都为第一次测试做好了准备。
如果运行 ResourceShapesDraw.mq5 脚本,图表将形成如下图所示的图像。

带有随机形状集的资源位图
将此图像与我们在 ObjectShapesDraw.mq5示例中看到的图像进行比较时,结果表明我们的新渲染方式与终端显示对象的方式有所不同。尽管形状和颜色是正确的,但形状重叠的地方以不同的方式指示。
我们的脚本用指定的颜色绘制形状,按照它们在数组中出现的顺序将它们叠加在一起。后面的形状会覆盖前面的形状。另一方面,终端在重叠的地方应用某种颜色混合(反转)。
两种方法都有其存在的理由,这里没有错误。然而,在绘图时是否可以达到类似的效果?
我们完全控制绘图过程,因此不仅可以应用终端的效果,还可以应用任何效果。
除了原始的简单绘图方式外,让我们再实现几种模式。所有这些都总结在 COLOR_EFFECT 枚举中。
enum COLOR_EFFECT
{
PLAIN, // simple drawing with overlap (default)
COMPLEMENT, // draw with a complementary color (like in the terminal)
BLENDING_XOR, // mixing colors with XOR '^'
DIMMING_SUM, // "darken" colors with '+'
LIGHTEN_OR, // "lighten" colors with '|'
};
|
我们添加一个输入变量来选择模式。
input COLOR_EFFECT ColorEffect = PLAIN;
|
我们在 MyDrawing 类中支持这些模式。首先,我们描述相应的字段和方法。
class MyDrawing: public Drawing
{
...
COLOR_EFFECT xormode;
...
public:
void setColorEffect(const COLOR_EFFECT x)
{
xormode = x;
}
...
|
然后,我们改进 point 方法。
virtual void point(const float x1, const float y1, const uint pixel) override
{
...
if(index >= 0 && index < ArraySize(data))
{
switch(xormode)
{
case COMPLEMENT:
data[index] = (pixel ^ (1 - data[index])); // blending with complementary color
break;
case BLENDING_XOR:
data[index] = (pixel & 0xFF000000) | (pixel ^ data[index]); // direct mixing (XOR)
break;
case DIMMING_SUM:
data[index] = (pixel + data[index]); // "darkening" (SUM)
break;
case LIGHTEN_OR:
data[index] = (pixel & 0xFF000000) | (pixel | data[index]); // "lightening" (OR)
break;
case PLAIN:
default:
data[index] = pixel;
}
}
}
|
你可以尝试以不同的模式运行脚本并比较结果。不要忘记自定义背景的功能。这是一个颜色变亮效果的示例。

带有颜色变亮混合的形状图像
为了直观地看到效果的差异,你可以关闭颜色随机化和形状移动。对象的标准重叠方式对应于 COMPLEMENT 常量。
作为最后的实验,启用 SaveImage 选项。在 OnStart 处理程序中,当生成带有图像的文件名时,我们现在使用当前模式的名称。我们需要在文件中获取图表上图像的副本。
...
if(SaveImage)
{
const string filename = EnumToString(ColorEffect) + ".bmp";
if(ResourceSave(raster.resource(), filename))
...
|
对于我们界面中更复杂的图形构造,Drawing 可能不够用。因此,可以使用 MetaTrader 5 附带的或 mql5.com 代码库中可用的现成绘图类。特别是,请查看 MQL5/Include/Canvas/Canvas.mqh 文件。

