Evgeny Raspaev / 프로필
- 정보
|
8+ 년도
경험
|
9
제품
|
50
데몬 버전
|
|
0
작업
|
0
거래 신호
|
0
구독자
|
MACD Filter Introducing MACD Filter – a fresh take on the beloved MACD (Moving Average Convergence Divergence) indicator, developed specifically for the MetaTrader 5 platform. By applying the Fisher Transform for filtering and refining data, MACD Filter creates smoother lines, eliminating noise and providing clearer signals. Fisher Transform Filtering: Normalizes and smooths MACD data. This leads to smooth, less chaotic lines compared to traditional MACD, reducing false signals and simplifying
Air Elemental A Tool for Traders: Air Elemental was created with the goal of automating the trading process. Now you can focus on your other activities, knowing that the advisor will carefully monitor the market and execute trades based on in-depth analytical data. This allows you to concentrate on other important aspects of life without being distracted by constant monitoring. Minimum Settings: I understand that stability and predictability are crucial for successful trading
A trend indicator that is suitable for both novice and professional traders. The indicator's algorithm filters out minor price fluctuations while highlighting the main trend movements. First trend PRO is suitable for inexperienced traders. The indicator shows entry points and the current direction of price movement. Thanks to this, you will always be aware of the current market situation. Advantages of First trend PRO: First trend PRO is suitable for all MetaTrader 5 symbols: currencies, metals
Индикатор Envelopes gaussian - это стандартный Envelopes с обработкой фильтром Гаусса. Преимущество данного индикатора в меньшем запаздывание от стандартного индикатора. Входные параметры: Period - период индикатора по умолчанию 14 Deviation - ширина канала по умолчанию 0.1 Shift - смещение индикаторных линий от цены в барах. По умолчанию 0 Индикатор пригоден для использования в советниках Буфер №0 — верхняя линия индикатора; Буфер №1 — нижняя линия
Indicator Summary The indicator dashboard displays values and trading actions, as well as provides a summary of trading actions based on 11 built-in indicators. Built-in Indicators: RSI (Relative Strength Index) - A crossover from the overbought zone downwards is a sell signal. A crossover from the oversold zone upwards is a buy signal. When fluctuating in the zone between overbought and oversold, the signal is formed depending on the value's position relative to 50. Above 50 indicates a
Trend indicator with a confirmation signal. A histogram is plotted at the bottom of the chart with a signal strength of 1 to 2 for a buy signal and -1 to -2 for a sell signal. The indicator applies to all periods of the chart and to all currency pairs. On the main chart, arrows are drawn signaling entry into the transaction. The info panel with at the price of entry into the transaction current price profit in points information on the current signal - purchase or sale. The indicator is set to
Oscillator trading signals - это динамический индикатор, определяющий состояние к продолжению тенденции роста или падению цены торгового инструмента и отсечению зон с нежелательной торговлей. Индикатор состоит из 2 линий осцилляторов. Медленная и быстрая сигнальная линия. Шкала отображения перевернутая. Зоны вблизи 0 свидетельствуют о тенденции роста цены валютной пары. Зоны -100 свидетельствуют о падении цены валютной пары. На основном графике в виде стрелок отображается потенциально
The function of the multi-time frame is added. Error correction.

Индикатор Trade in trend предназначен для торговли по тренду. Сила тренда определяется шириной линии. Узкая линия - начало или конец тренда. Широкая линия свидетельствует о высокой силе тренда. Резкая смена ширины линии свидетельствует, с большой вероятностью, об окончании тенденции. Сигналы индикатора Не против покупки: переход с красной линии в белую цена отразилась от белой линии индикатора цена находится выше белой линии индикатора Не против продажи: переход с белой линии в
You did a great job on Trade the trend and I wonder why it is not so popular here. I have two suggestions that can make this tool a market hit. 1. It needs sound alerts and email push notifications because people will not be on their computers 24 hours in a day to catch a new treend. 2. A complimentary trend scanner on the top right corner of the screen with multi-currency pairs will be wonderful. With that, people will just look at their screen and know which pairs to go to. I don't know anything about writing mql5 codes but these are my suggestions on how to make your product better. I await your response. Thank you
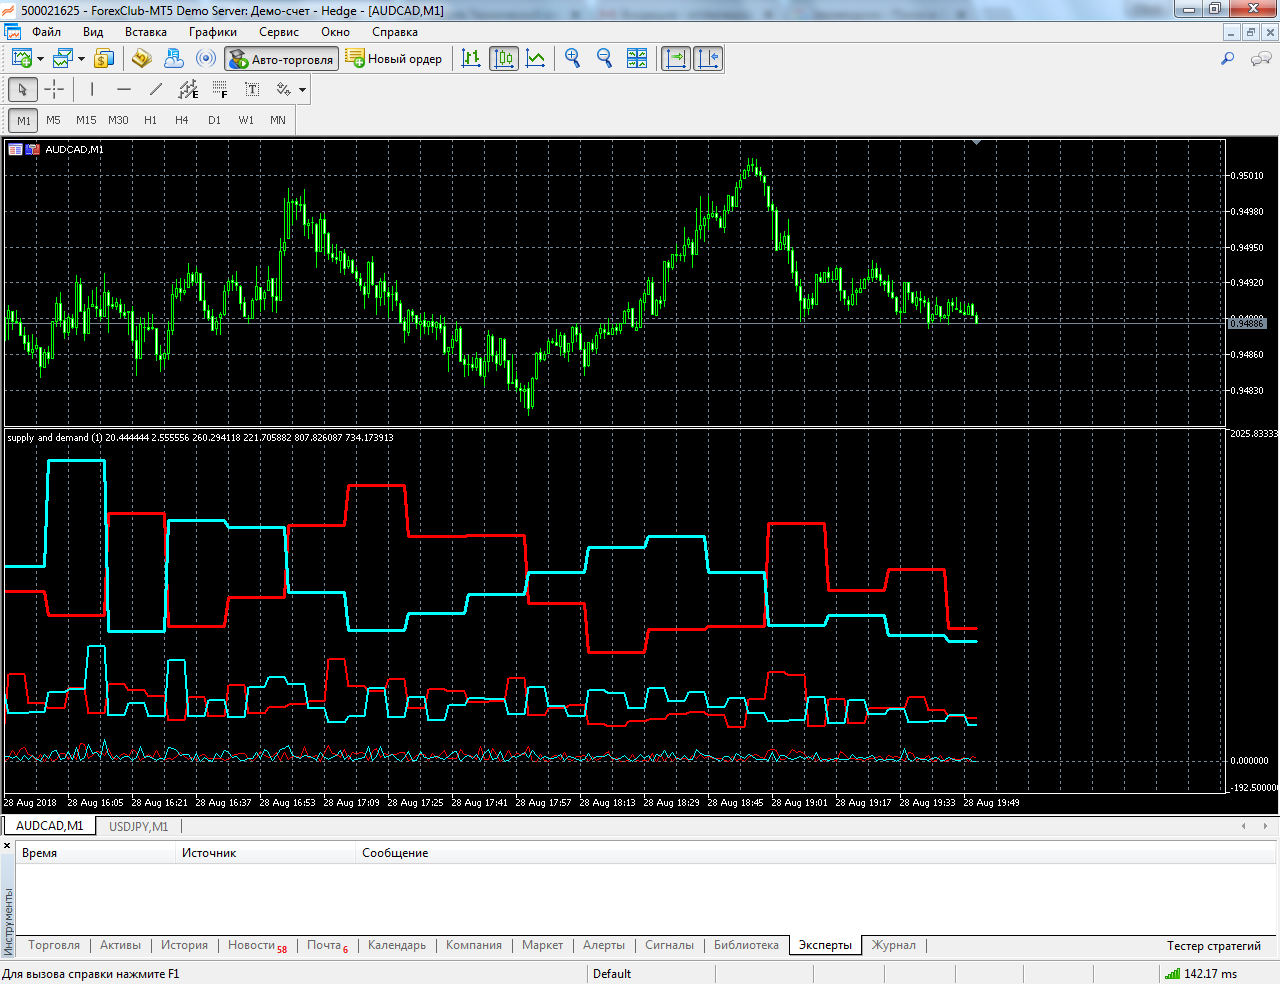
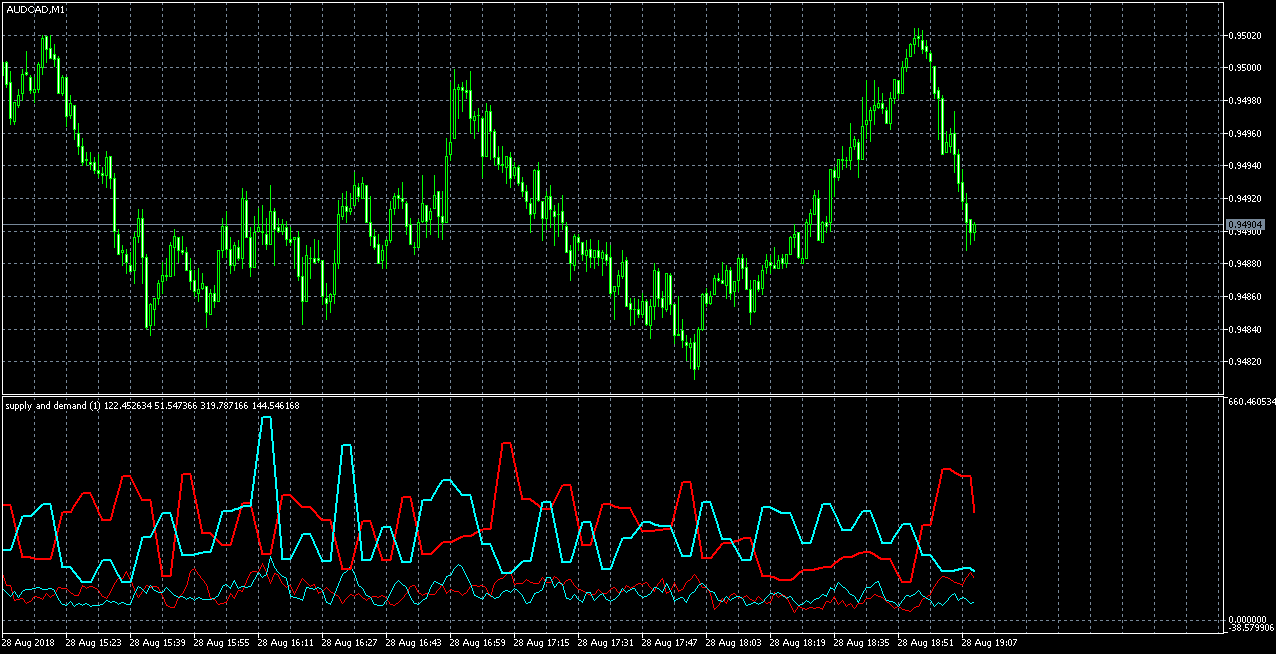
The indicator shows supply and demand degenerated through tick volume. The red line is the supply line. The blue line is the demand line. The green line is the total volume line. Typical situations of indicator readings: red is higher than blue - supply is higher than demand - the price is falling. blue is higher than red - demand is higher than supply - the price is growing. the red and blue lines tend to go down, but the blue is above the red - demand prevails, the price rises, but


