Suleiman Alhawamdah
Suleiman Alhawamdah
  • 정보
8+ 년도
경험
11
제품
115
데모 버전
0
작업
0
거래 신호
0
구독자
Indicators developer
공유 제품
Suleiman Levels
리뷰: 4
80.00 USD

اسم المصدر:   مؤشر أسعار الأسهم الخاص بمؤشر القوة النسبية 2 "مستويات سليمان" 지표와 "RSI Trend V" شكرا جزيلا. يبلغ عدد مستويات سليمان 9,800 مليون جنيه إسترليني، وهو ما يزيد عن 9,800 مليون دولار أمريكي شكرا جزيلا. شكرا جزيلا. مستويات سليمان في اللعبة: 노란색 박스 (자금 흐름 감지)   - 노란색 박스 설명: ""الحصول على معلومات إضافية عن العمل" 기능 - 처음부터 개발됨": 특정 캔들에서 은행 및 기관의 자금 유입을 감지합니다. هذا هو السبب في أن هذا هو ما يحدث في المستقبل. اسم المنتج: """"""""""""""   " 지표 기능 - 처음부터 개발됨": 재표시되지 독창적인 컬러 레벨 시스템

Suleiman Alhawamdah 출시돈 제품

중요: 이 전문가는 데이터 다운로드 전용이며 어떠한 거래 작업도 실행하지 않습니다. 전문가 자문 기능: 정확하고 올바르며 빠르게 과거 데이터를 다운로드합니다. 필요성: 때때로 도형, 그래픽, 선, 화살표를 포함한 특정 지표가 차트에 배치되거나 시간 프레임을 전환할 때 이상하게 동작하는 것을 알 수 있습니다. 도형과 선이 메인 화면에서 부자연스럽게 움직일 수 있습니다. 이 문제는 일부 지표가 필요로 하는 데이터가 부족하기 때문에 발생합니다. 사용 단계: 새 창에서 새로운 통화 쌍을 엽니다. 전문가 자문을 새로운 통화 쌍으로 드래그합니다. 짧은 시간 내에 필요한 과거 데이터가 다운로드됩니다. 플랫폼 화면 하단의 ToolBox 섹션에서 Experts 탭(설명 이미지에 표시된 대로)에 메시지와 알림이 표시됩니다. 다운로드가 성공적으로 완료되었음을 확인하는 메시지가 나타납니다: "통화 쌍이 성공적으로 다운로드되었습니다." 완료 후 창을 닫습니다. 중요한 경고: 전문가 자문 설정에는

Suleiman Alhawamdah
Suleiman Alhawamdah
The new update "RSI Trend V 5.00" to display the previous Fibonacci levels that appeared with the previous arrow.
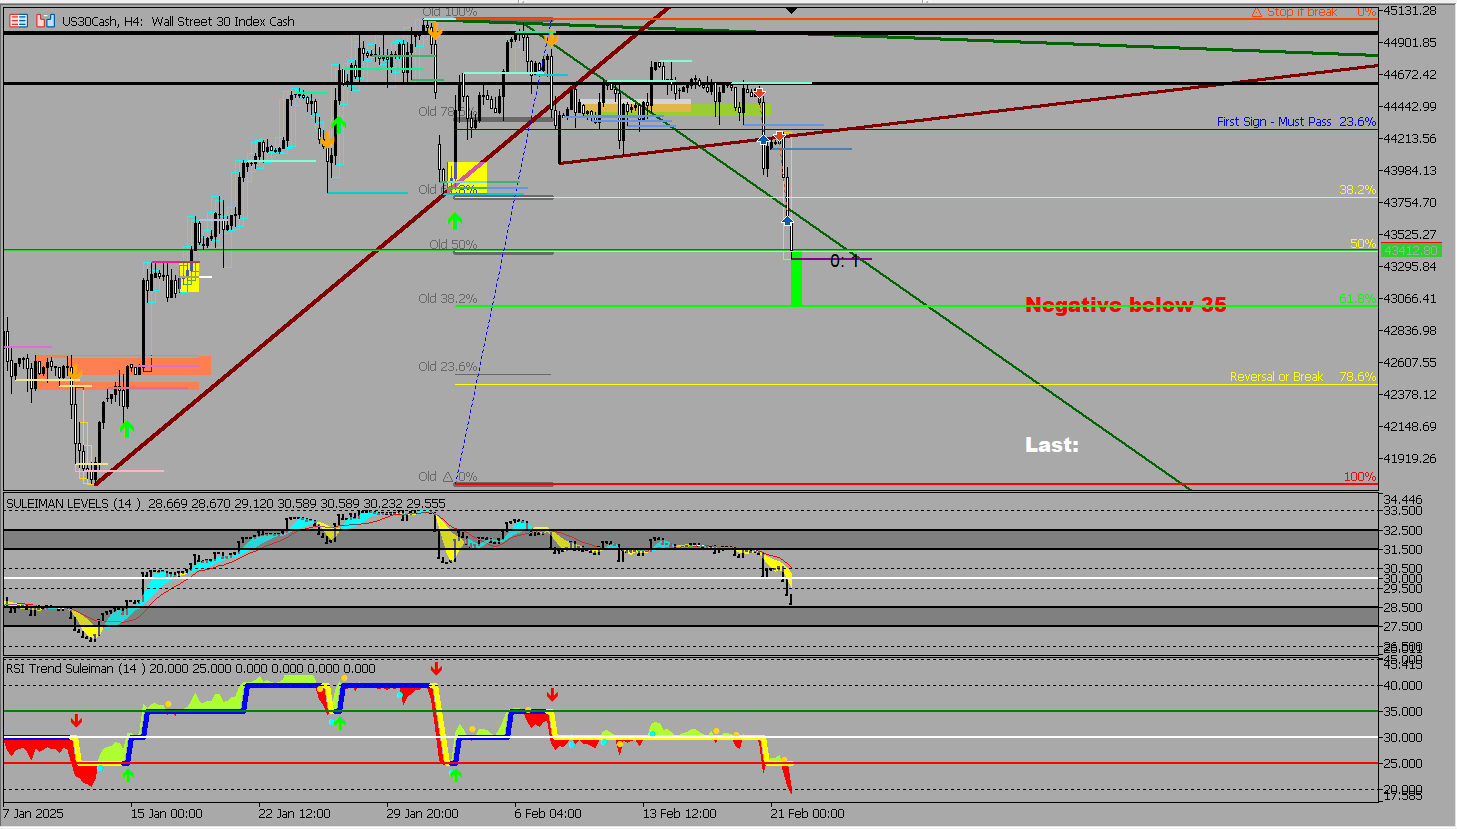
Also, a new good sell trade for US30CASH. I entered the trade based on the 1-hour chart analysis using my indicators Suleiman Levels and RSI Trend V, but here is how it looks on the 4-hour chart. It appears that the price has reached the area marked with a green shaded rectangle and is touching the 50 Fibonacci level.
Suleiman Alhawamdah
Suleiman Alhawamdah
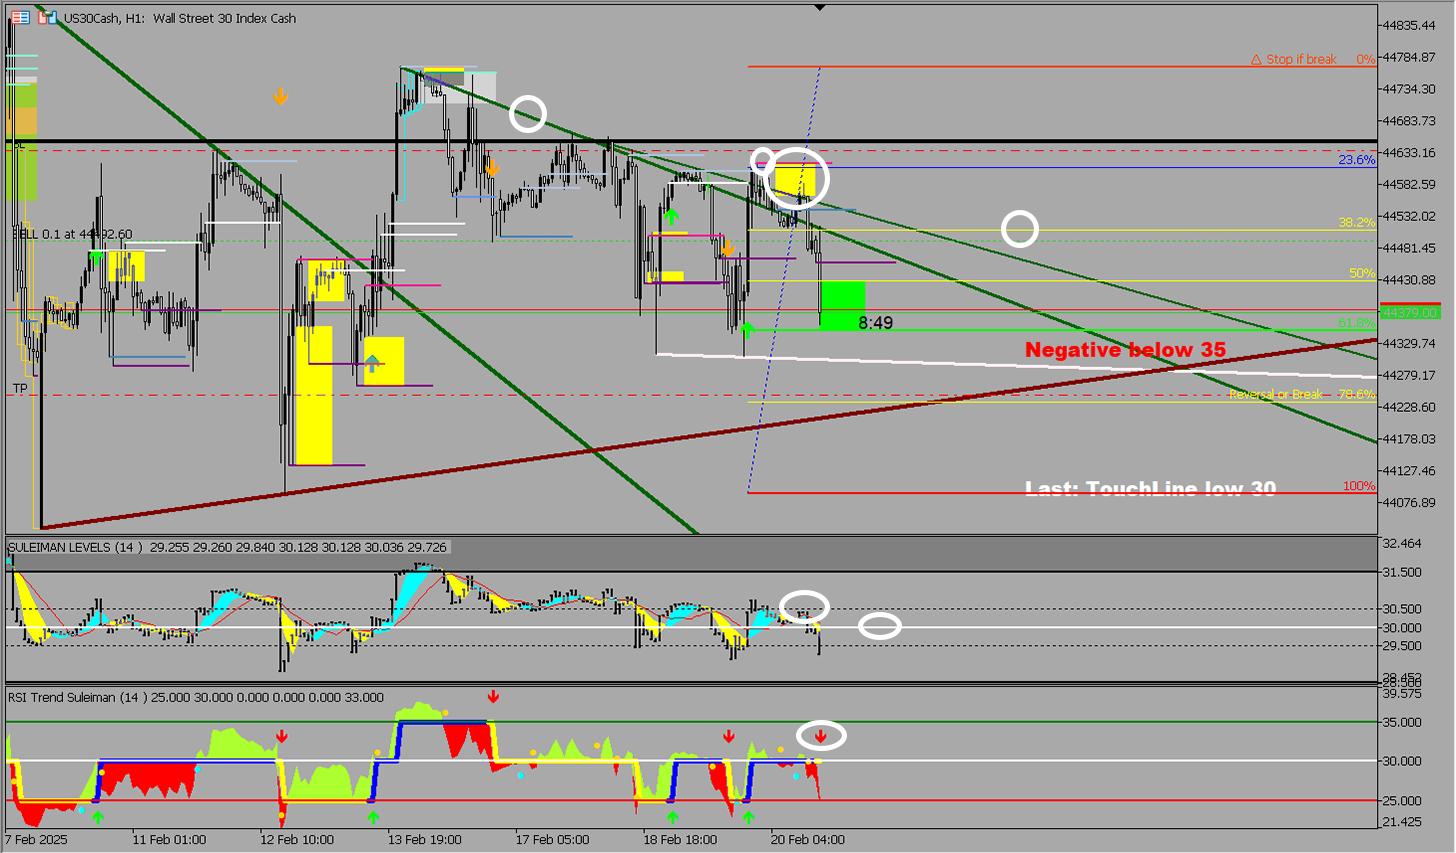
Example of my analysis for the #US30CASH pair on 1-hour timeframe using my indicators Suleiman Levels and RSI Trend V, It was a quick successful trade, and I was unable to change the take profit position to a second target area.
Suleiman Alhawamdah
Suleiman Alhawamdah
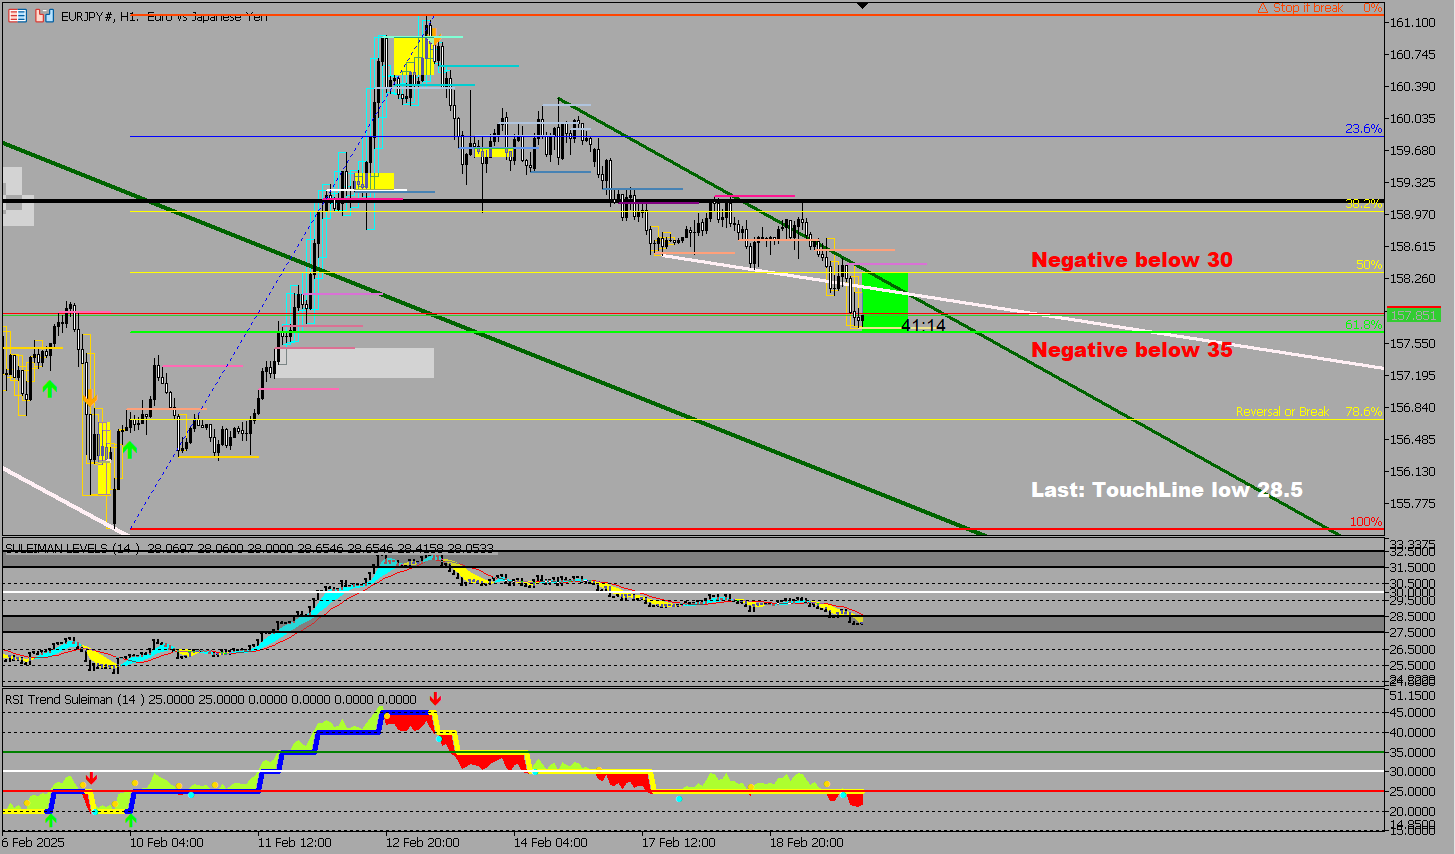
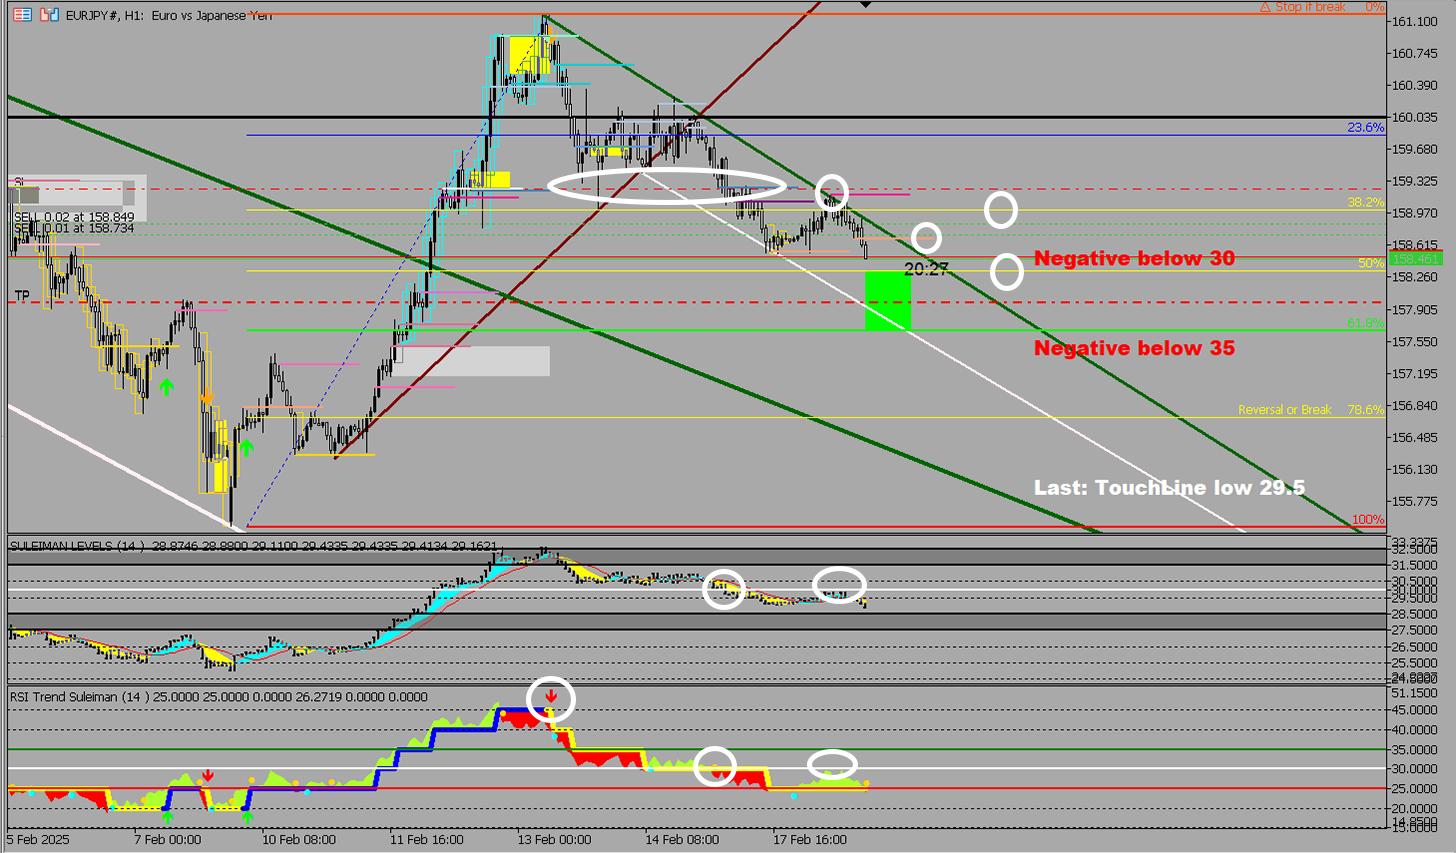
second image #EURJPY targets being reached
Suleiman Alhawamdah
Suleiman Alhawamdah
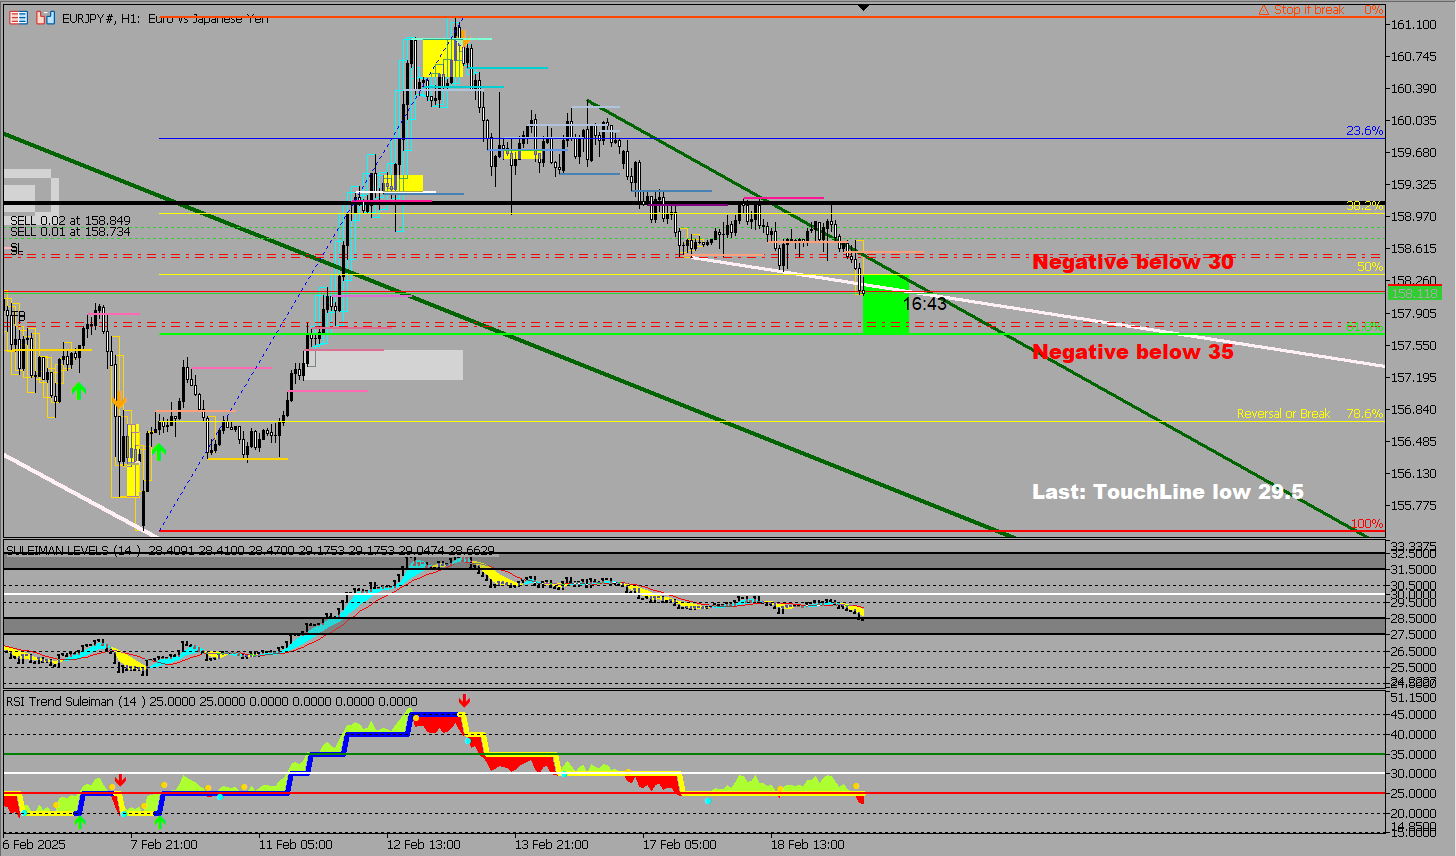
Example of my analysis for the #EURJPY pair on 1-hour timeframe using my indicators Suleiman Levels and RSI Trend V, with their targets being reached just a while ago.
Suleiman Alhawamdah
Suleiman Alhawamdah
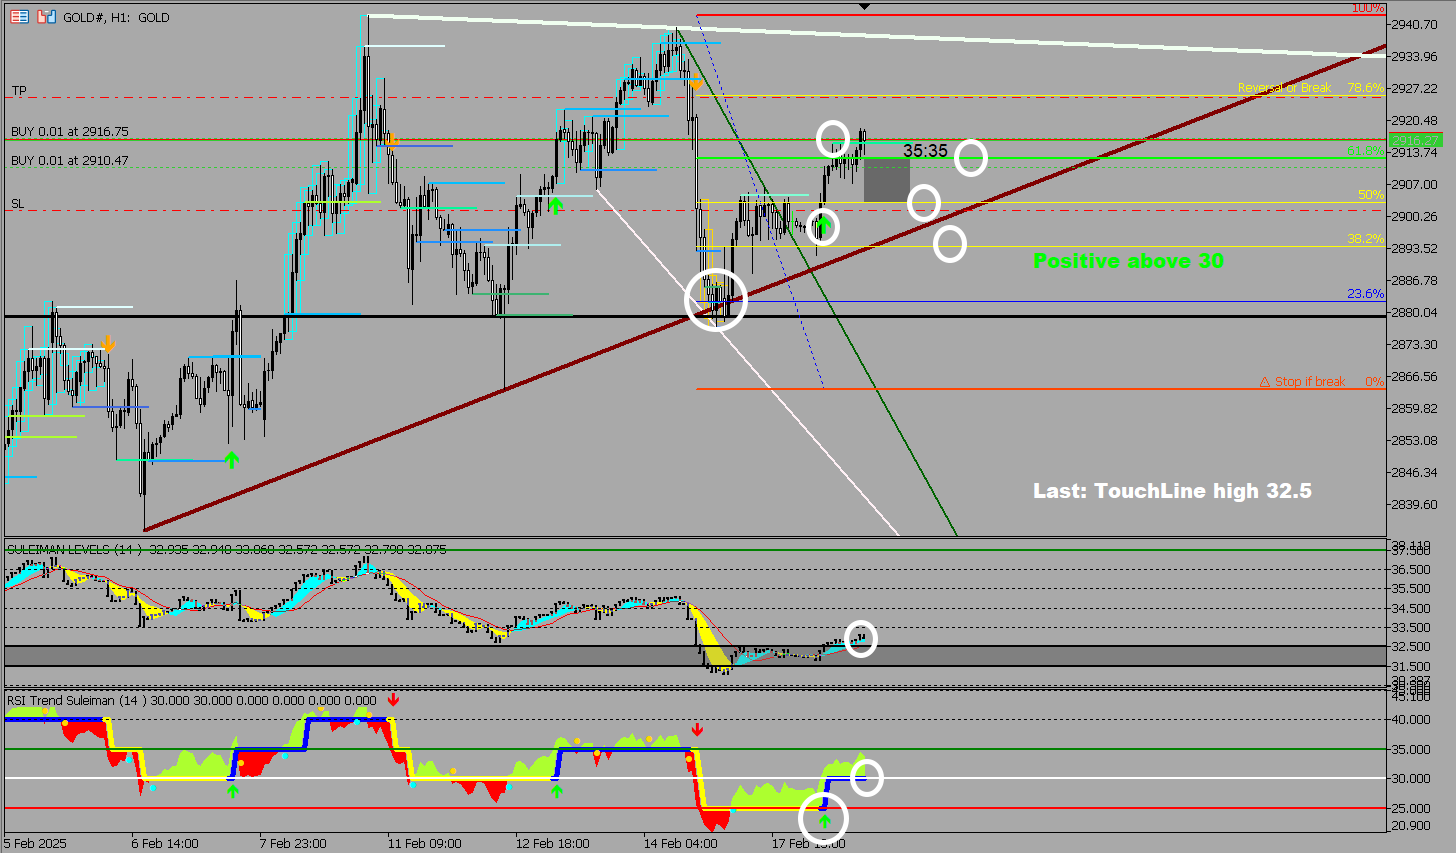
The second Gold trade has reached its target.
Suleiman Alhawamdah
Suleiman Alhawamdah
My outlook 2 is based on analysis on 1-hour timeframe, and of course, it is subject to error due to market fluctuations and news.
Suleiman Alhawamdah
Suleiman Alhawamdah 2025.02.19
Done.. target reached
Suleiman Alhawamdah
Suleiman Alhawamdah
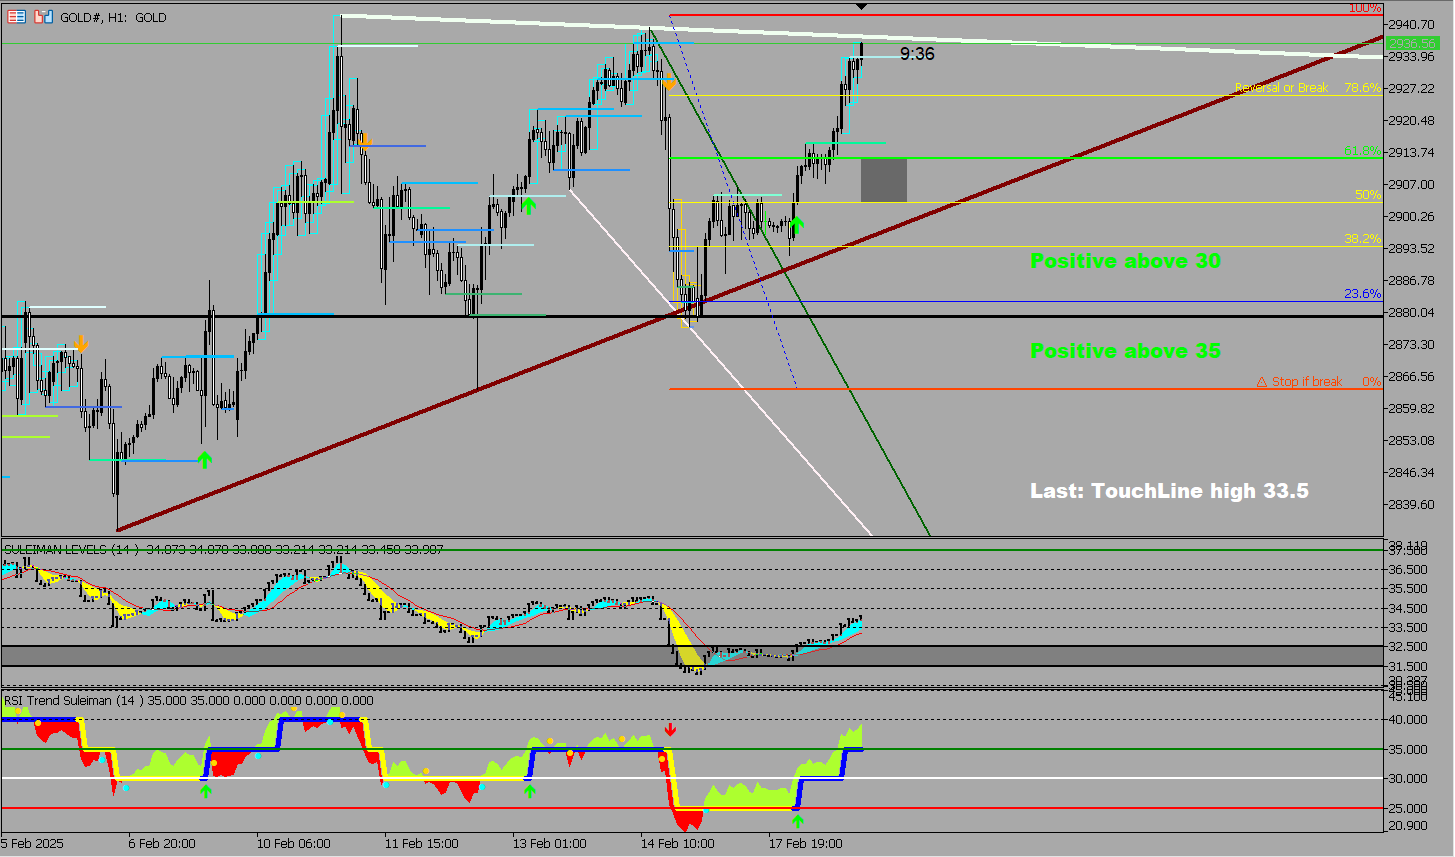
My outlook is based on analysis on 1-hour timeframe, and of course, it is subject to error due to market fluctuations and news.
Suleiman Alhawamdah
Suleiman Alhawamdah 2025.02.18
Done.. target reached
Suleiman Alhawamdah
Suleiman Alhawamdah
Update RSI Trend V 4.10:

Added 23.6 level.
Adjusted the main Fibonacci line.
Modified the custom number used to search for the best peak and trough after the arrows appear.
Suleiman Alhawamdah
Suleiman Alhawamdah
SULEIMAN LEVELS & RSI Trend V 4
Suleiman Alhawamdah 출시돈 제품

65.00 USD

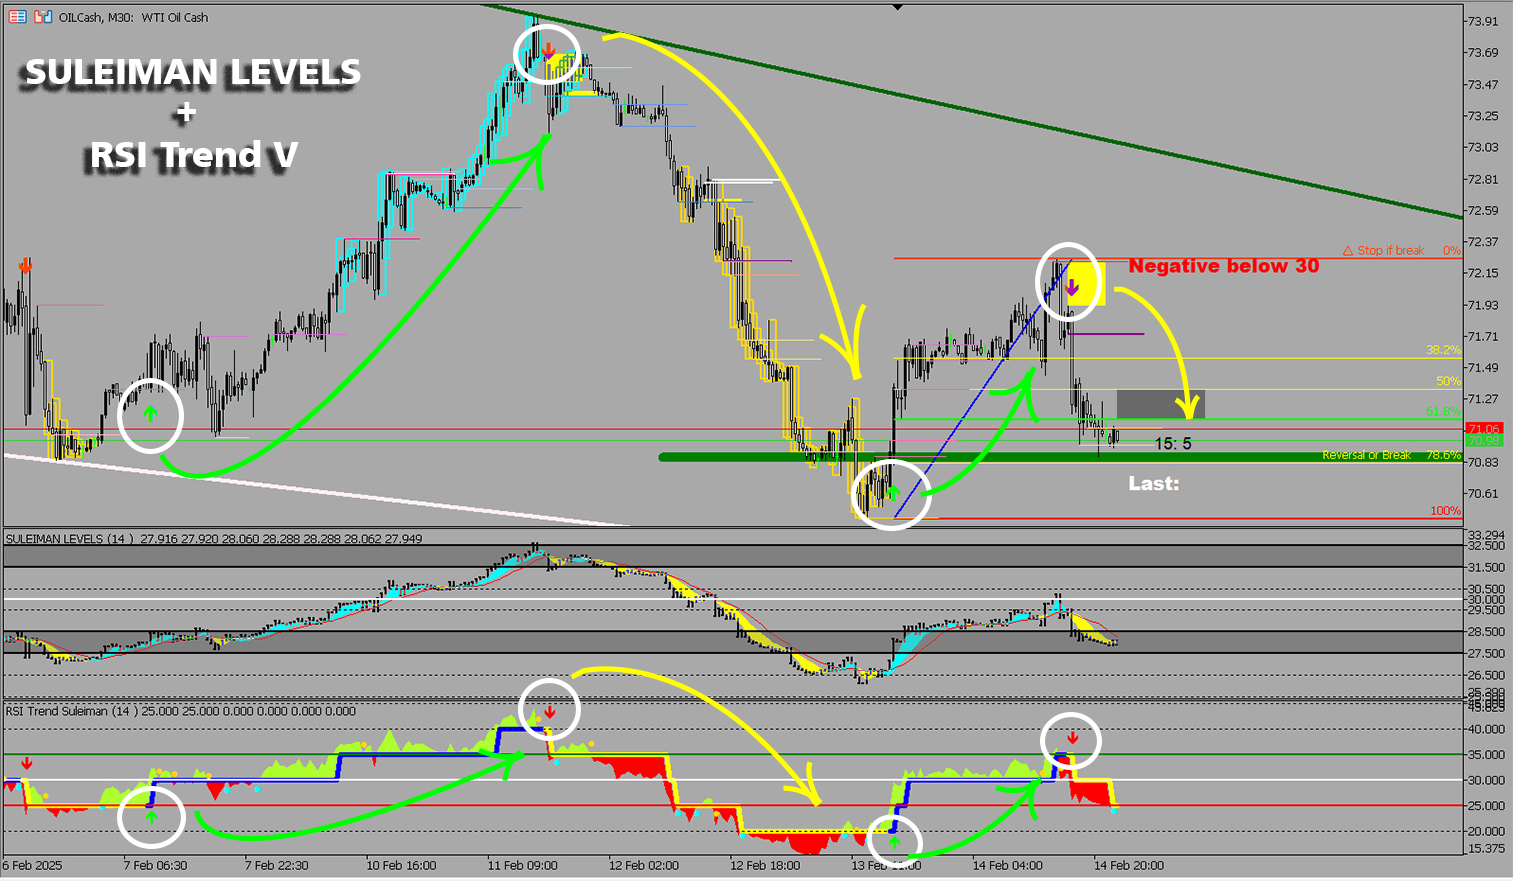
중요한 참고 사항: 스크린샷에 표시된 "일부 이미지" 는 제 인디케이터인 Suleiman Levels Indicator 및 RSI Trend V Indicator 에서 가져온 것입니다. RSI Trend V Indicator 는 트렌드 식별을 위해 설계되었으며, 피보나치와 통합되어 목표 구역과 잠재적인 반전 지점을 결정합니다. 이는 전체적인 트렌드 방향을 판단하는 데 매우 강력하고 엄격하며 유용한 인디케이터입니다. 가격 움직임이 반전될 가능성이 있는 영역에서 상승 및 하락 화살표가 나타납니다. 그러나 집중해야 할 주요 요소는 다음과 같습니다. Thick blue line - 상승 추세 Thick yellow line - 하락 추세 Green cloud above the thick green line Red cloud below the thick yellow line Bullish and bearish arrows 새로운 화살표가 표시될 때 나타나는 피보나치 수준을 고려하는 것이