Subrata Das
Subrata Das
5 (1)
  • 정보
1 년도
경험
14
제품
4
데모 버전
0
작업
0
거래 신호
0
구독자
Hello! I am Subrata Das (Subho), a passionate Trader and professional MQL Developer from India.
With years of experience in the financial markets, I bridge the gap between manual trading logic and automated execution. I believe that to write great code, one must first understand the market. My goal is to empower traders with high-quality, bug-free, and profitable tools.
🔹 My Expertise:
MQL4 & MQL5 Development: Creating robust Expert Advisors (EAs), Custom Indicators, and Utilities.
Strategy Automation: Specializing in Price Action, Liquidity Concepts, and Smart Money Concepts (SMC).
Risk Management: Every tool I build prioritizes capital protection and smart execution.
Whether you are looking for a reliable trading robot or need a custom solution for your strategy, I am here to turn your ideas into automated reality.
🚀 Code. Trade. Automate.
Feel free to browse my products or contact me for custom projects
Subrata Das
Subrata Das
DEMO ACCOUNT TRADE :- WITH ALEART SYSTEM
Subrata Das 출시돈 제품

Subho Impulse Signals & Overlays: Trend Table, Impulse Candles, Smart Trail and Reversal Zones for MT5 Short description (for the title line): Trend table, impulse-colored candles, large Buy/Sell start arrows, Smart Trail zones and reversal channels in one chart overlay. Overview Subho Impulse Signals & Overlays is a chart overlay for MetaTrader 5. It combines four tools on the main chart window so you can read trend direction, momentum strength and stretched price areas without opening

Subrata Das
Subrata Das
🚀 A SPECIAL GIFT FOR THE MQ5 COMMUNITY!

I have decided to bring you 2 FREE INDICATORS EVERY WEEK! 🎁

Your support and encouragement mean a lot to me. ❤️

If you support my work, it will motivate me to work harder and develop more useful indicators for this amazing community.

My goal is to share something valuable with you every week and keep bringing new tools, innovative concepts, and useful trading indicators.

Your Support = My Motivation! 🔥

Stay Connected. Keep Supporting. Keep Growing.

Let's build something amazing together! 👑

— SuVo
Subrata Das
Subrata Das
Title: Subho Impulse Signals & Overlays

Short description:
All-in-one chart overlay that colors candles by trend and momentum impulse, and adds a trend line, trail zones and reversal channels.

Full description:

Subho Impulse Signals & Overlays combines several visual tools in one indicator, so you can read market direction and momentum at a glance.

Features

Impulse candles. Candles are colored by checking three things together: trend direction, momentum and trend velocity.
Bright green or red: trend, momentum and velocity all agree (confirmed).
Teal or purple: trend and momentum agree, but velocity does not (unconfirmed).
Blue: flat trend, or trend and momentum disagree (neutral).
Fresh vs extended impulse. Each new impulse is marked as fresh (triangle) or extended (small dot, faded color). Extended means momentum was already overbought or oversold when the impulse began.
Present Trend line. A color-changing trend line (green in uptrend, red in downtrend). Candles can follow this line instead of the impulse colors.
Smart Trail zones. A trailing zone under price in an uptrend (blue) and above price in a downtrend (red).
Reversal channels. Layered Keltner-style channels (red above, cyan below) that highlight stretched price areas.
Alerts. A terminal alert when a bullish or bearish impulse starts (on bar close).
Chart watermark with adjustable text, size and visibility.

Settings

Candle color mode: Impulse Angle or Present Trend
Trend length, flat threshold and slope lookback
Momentum length, minimum move and confirmation bars
Fresh/extended classification and adaptive overbought/oversold levels
Trend velocity filter on or off
Custom colors for all five impulse states
Toggle for each part (channels, Smart Trail, trend line, impulse marks, alerts)

How to use
Attach the indicator to any symbol and timeframe. Use the candle colors to see when trend and momentum are aligned, and the Smart Trail and channels for context. It works best combined with your own analysis and risk management.
Subrata Das
Subrata Das
SCALPER PRO - BY SUVO

Fast, clean trend-signal indicator for scalpers and intraday traders.

SCALPER PRO combines a SuperTrend-based signal engine, a Cirrus trend cloud, an ADX sideways filter and automatic TP/SL levels on one chart.

Key Features

Buy / Sell signals: arrows appear when price crosses the SuperTrend line (factor 7, ATR 10).
Cirrus Cloud: a two-layer range-filter cloud with trend-colored edge lines. Candles stay visible on top of the cloud, and cloud transparency is adjustable.
Sideways filter: an ADX-based marker shows when the market is ranging, so you can avoid low-quality setups.
Automatic TP/SL levels: Entry, Stop Loss and TP1 / TP2 / TP3 are calculated from ATR at each signal. Levels are shown as labels and optional lines.
Alerts: a pop-up alert on every new Buy or Sell signal, issued on bar close.
Works on any symbol and timeframe: Forex, Gold, Indices, Crypto and more.

How to Use

Attach the indicator to the chart and turn on Show Cirrus Cloud.
A Buy arrow (up) or Sell arrow (down) marks a new signal.
Use the cloud color and direction as trend confirmation.
Avoid signals while the purple sideways dots are printing.
Enable Show TP/SL Levels to see Entry, Stop Loss and the three targets.

Input Parameters

Parameter Description
Show Cirrus Cloud Show or hide the cloud and signal arrows
Bearish / Bullish Cloud Color Cloud colors
Cloud Transparency % Make the cloud lighter or stronger
Show TP/SL Levels Show Entry, SL, TP1-TP3 labels
Show Lines Draw horizontal lines for the levels
Line Style Solid / Dashed / Dotted
Decimals Price decimals in the labels
Risk % (ATR multiplier) Stop distance multiplier
ATR Length ATR period for stop calculation
ADX Sideways Threshold Below this ADX value the market is marked as sideways
Enable Alerts Turn pop-up alerts on or off

Notes

The indicator is non-repainting on closed bars. The signal on the current, unfinished bar can change until the bar closes.
Choose your own lot size and risk. Always test on a demo account first.

Risk Warning: Trading Forex, CFDs and other leveraged products involves a high level of risk and may not be suitable for everyone. This indicator is a technical analysis tool and does not guarantee profit. Past performance does not indicate future results.
Subrata Das 출시돈 제품

SCALPER PRO - BY SUVO Fast, clean trend-signal indicator for scalpers and intraday traders. SCALPER PRO combines a SuperTrend-based signal engine, a Cirrus trend cloud, an ADX sideways filter and automatic TP/SL levels on one chart. Key Features Buy / Sell signals: arrows appear when price crosses the SuperTrend line (factor 7, ATR 10). Cirrus Cloud: a two-layer range-filter cloud with trend-colored edge lines. Candles stay visible on top of the cloud, and cloud transparency is adjustable

Subrata Das
Subrata Das
FRACTAL CONCEPT
Subrata Das
Subrata Das
FRACTAL CONCEPT
Subrata Das
Subrata Das
HTF CANDLE -(FRACTAL CONCEPT)
Subrata Das
Subrata Das
How to Use: Fractal Concept by SUVO
English (for the MQL5 Market page)
1. Installation
Attach the indicator to any chart: drag it from the Navigator, or double-click it.
Enable “Allow DLL imports” is not needed.
Open Market Watch (Ctrl+M) and add the correlated symbols you want to use for SMT (see step 5).
Open the Inputs tab to adjust settings, or leave the defaults.
2. Reading the chart

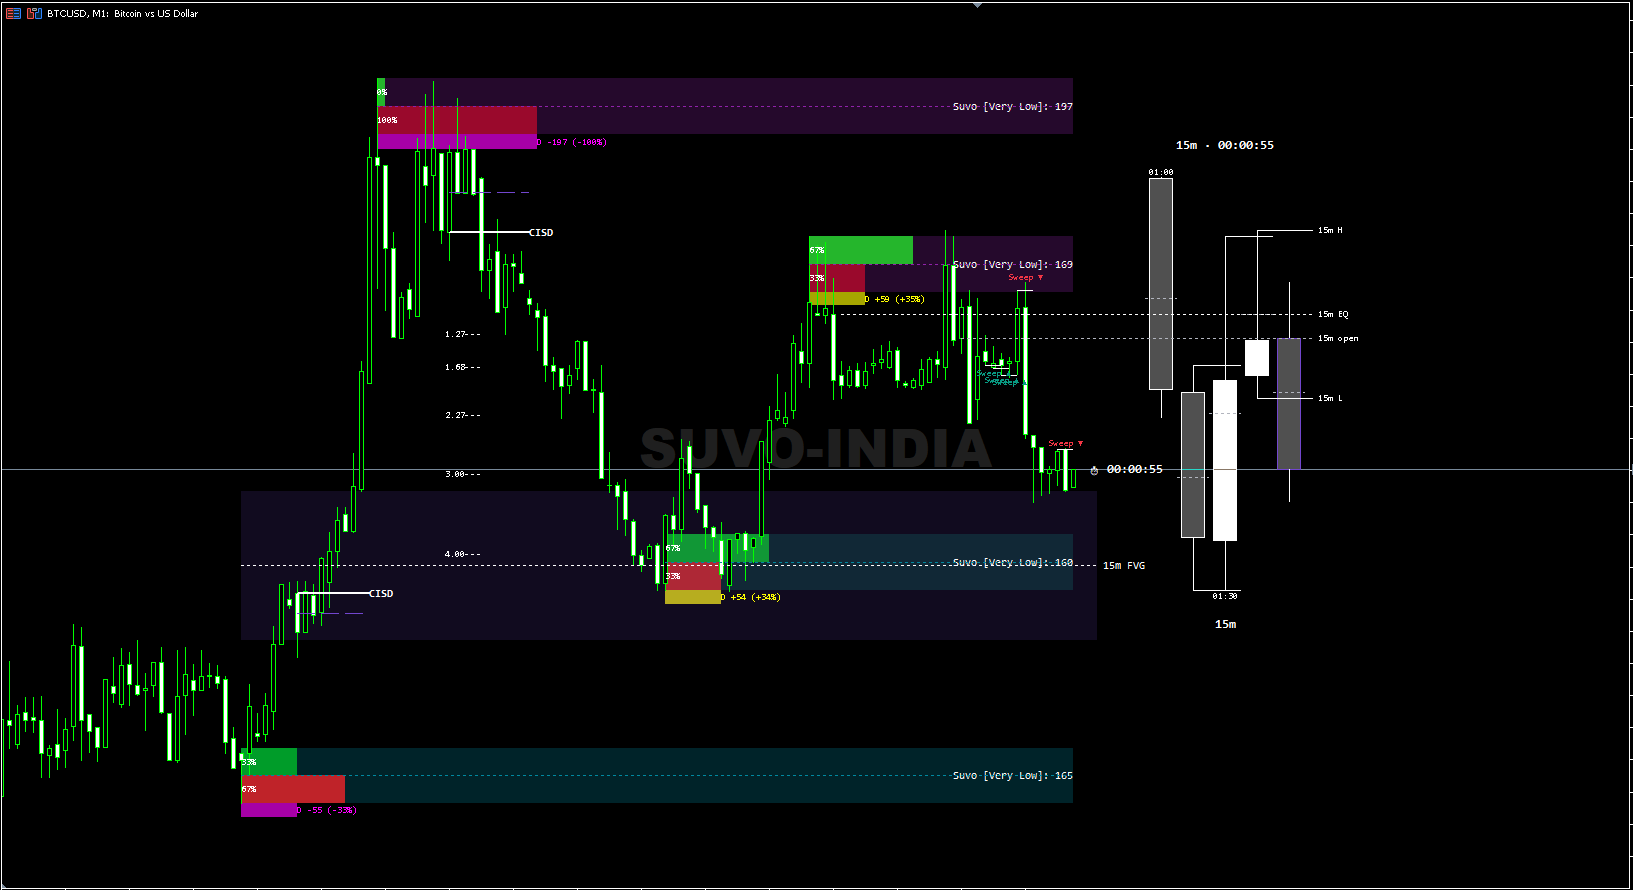
Liquidity zones (volumetric order blocks)

A zone below price is buy liquidity (support). A zone above price is sell liquidity (resistance).
Inside each zone: the top half shows buy volume %, the bottom half shows sell volume %.
The strip below the zone shows delta (buy volume minus sell volume). Green means buyers led, red means sellers led.
The label shows the liquidity rating and total volume, for example Suvo [High]: 12.5K.
When price closes through a zone (or wicks through, if you chose Wick), it is mitigated. With “Keep Swept Zones” ON it stays grey as “Swept Liq”, otherwise it is removed.

CISD

A CISD line appears after a run of candles in one direction ends and price closes back through the origin of that run.
The short dotted lines near the confirming candle (1.27, 1.68, 2.27, 3, 4) are standard deviation targets.
If price closes back through the CISD level, the CISD is considered failed and is removed (or shown faded with “Keep failed CISD”).

HTF candle block (right side of the chart)

These are higher-timeframe candles, chosen automatically from your chart timeframe.
The timer next to the name is the time left on the forming HTF candle.
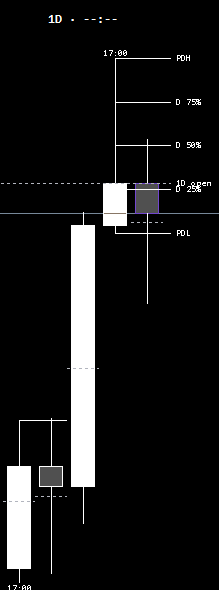
Lines to the right: previous high/low (PDH/PDL etc.), 25/50/75% of the previous range on D/W/M, the HTF open, and the previous candle EQ.
The EQ line is solid while closes stay on the same side as the candle’s open, and dotted once a close crosses it.
Small times above the high and below the low show when each extreme was made.

HTF FVG

Shaded boxes with a dotted mid line and the label 4H FVG (or your HTF). They disappear once price closes through the far side.

SMT

A violet line from the reference high/low to the candle that took it. The label shows the assets that diverged, for example US500+US30.
Meaning: your chart symbol took a high/low while a correlated symbol did not (or the opposite). This is a divergence between related markets.

Candle sweep

Sweep ▼ (red) marks a candle that took the previous high and closed back below it.
Sweep ▲ (green) marks a candle that took the previous low and closed back above it.
The line shows the level that was swept.
3. Dashboard

The panel shows symbol and timeframe, candle timers, the sweep on the last closed candle, the last sweep and how many bars ago, the HTF sweep, the number of active buy/sell zones, the last CISD, and the active theme. A price-side timer (⏱) also follows the live candle.

4. Suggested workflow
Bias: look at the HTF candle block. Where is price relative to the previous high/low, and the previous EQ? Is there an HTF FVG nearby?
Area: find a liquidity zone near that level.
Trigger: wait for a sweep, a CISD, or an SMT in your direction.
Manage: use the CISD deviation levels or the next zone as reference targets, and your own risk rules.

Use it as confluence, not as a stand-alone signal. Test on a demo account first.

5. Key settings
Setting What it does
Pivot Left / Right Length How strict a swing must be to create a zone. Larger means fewer zones.
Max Zones (Per Side) How many buy and sell zones stay on the chart.
Mitigation Method Candle Close or Wick decides when a zone is used up.
Keep Swept Zones Keeps used zones grey instead of deleting them.
Extension Mode How far right the zones extend.
CISD size filter Ignores very small runs. Raise it for fewer, cleaner CISDs.
Auto timeframe (HTF) Picks the HTF from your chart timeframe. Turn off to choose your own.
Candles / Bars right of price Number of HTF candles and the distance from live price.
Hours to add to broker time (NY) Set this to match your broker server time so the NY time labels are right.
SMT symbols 1-4 and Invert Type your broker’s exact symbol names. Tick Invert for inverse markets (for example the dollar index against a currency pair).
SMT timeframes Choose which timeframes are checked.
Dashboard corner / text size Position and size of the panel.
Theme Adaptation Auto detects dark/light chart. You can force Dark or Light.
6. Tips
Too many objects? Lower Max Zones, turn off Candle midpoints, or reduce SMT timeframes.
No SMT showing? Check that the asset symbols are spelled exactly as your broker names them, appear in Market Watch, and have history loaded (open each symbol chart once).
HTF block hidden or cramped? Keep “Push chart left” ON and adjust “Chart shift size %”.
Text hard to read after changing the chart colours? Wait a second for the theme refresh, or set the theme manually.
FVG not lining up with the HTF block? Set the FVG “Bars right of price used by the HTF block” to the same value as the HTF block’s “Bars right of price”.
The indicator refreshes zones on each new bar and timers every second. It does not trade.
Subrata Das
Subrata Das
Product name

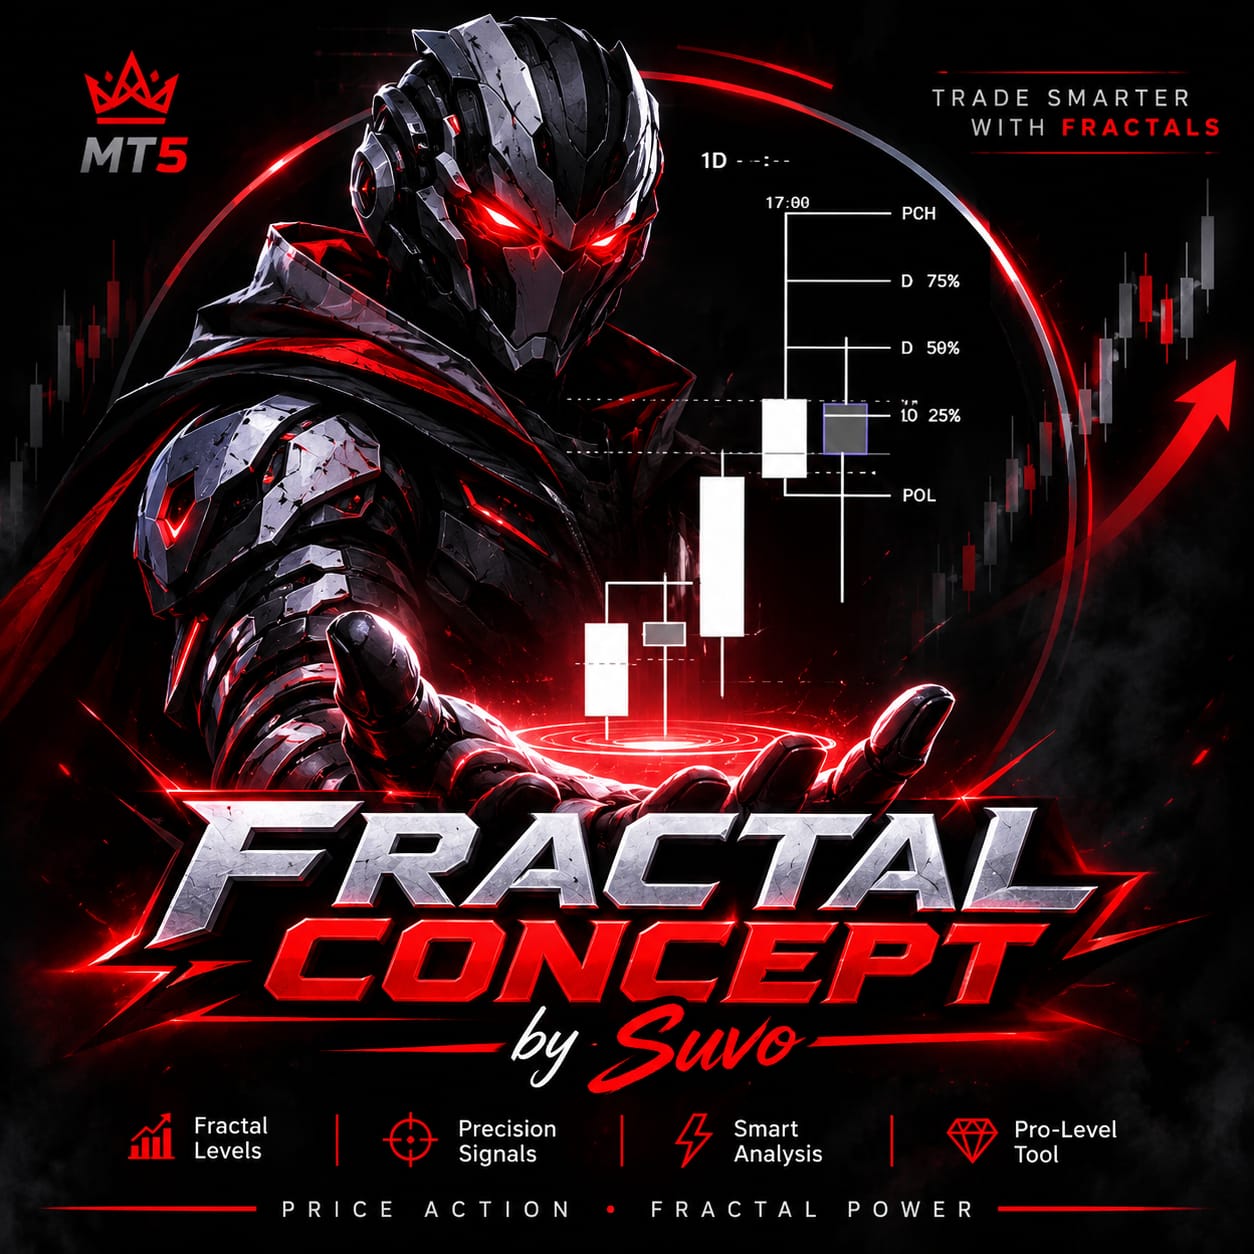
Fractal Concept by SUVO

Short description (one line)

Volumetric liquidity zones, CISD, HTF candles with timers, HTF FVG, SMT divergence and candle sweeps in one auto-theme dashboard.

Full description

Fractal Concept by SUVO is a multi-tool price action and liquidity indicator for MetaTrader 5. It places the key levels and signals of a Smart Money / ICT style workflow on one clean chart, with a built-in dashboard. It works on any symbol and timeframe, and adapts automatically to white and black chart backgrounds.

What you get

1. Volumetric Liquidity Zones (Order Block style)

Zones are built from confirmed swing highs and lows (adjustable pivot length).
Each zone shows buy/sell volume split, delta volume and delta %, and a mid line.
A liquidity rating (High / Medium / Low / Very Low) is based on a 20-day average volume reference.
Mitigation by candle close or wick. Swept zones can be kept as “breakers”.
Overlap filter, max zones per side, and fixed / chart / infinite extension modes.

2. CISD (Change in State of Delivery)

Detects the run of opposing candles and confirms with a close back through the origin level.
Size filter, confirmation window, failed-CISD display, and 0.5 level.
Standard deviation levels: 1.27, 1.68, 2.27, 3 and 4.

3. HTF Candle Block

Higher-timeframe candles drawn beside live price, auto-selected for your chart timeframe.
Live countdown to the HTF candle close.
Previous high/low (PDH/PDL, PWH/PWL, PMH/PML), previous range 25/50/75%, candle midpoints.
HTF sweeps, high/low times, HTF open and previous candle EQ.

4. HTF Fair Value Gaps

FVGs read on the HTF timeframe once its candle closes. Removed when price closes through the far side.
Choose how many of the newest gaps stay on the chart.

5. SMT Divergence

Compares your chart symbol with up to 4 correlated symbols (inverse option included).
Timeframes: 15m, 30m, 1H, 4H, 6H, 1D.
Draws the divergence line, reference dot and asset label. Clean filtering removes duplicate signals across timeframes.

6. Candle Timer and Candle Sweep

Candle countdown beside price and in the dashboard.
Sweeps are marked on the chart when a candle takes the previous high/low and closes back inside it.

7. Dashboard

Symbol and timeframe, candle timers, sweep status, last sweep, HTF sweep, active buy/sell zone count, last CISD, current theme.
Choose any of the four corners and set the text size.

8. Auto Theme

Detects a light or dark chart and adjusts all colors, or force Dark / Light manually.
Setup notes
SMT symbols: type your broker’s exact symbol names for the correlated assets in the inputs (for example your broker’s US500 and US30 names) and make sure they are in Market Watch. If a symbol is not available, SMT for that asset is simply skipped.
New York time labels: set the “Hours to add to broker time to get New York time” input to match your broker’s server time.
Volume: tick volume is used by default (spot Forex/CFDs). Enable “Use real volume” where your broker provides it.
The indicator draws with chart objects and refreshes on new bars and once per second for timers. It does not use DLLs and does not place trades.
Chart shift is enabled by default to leave room for the HTF block. Turn it off in the inputs if you prefer.
Recommended use

Best used as a confluence tool: for example HTF bias from HTF candles and FVG, liquidity zones and sweeps for areas, and CISD or SMT for confirmation. Test on a demo account first.

Disclaimer

This is an analysis tool and not financial advice. It does not generate trade signals or guarantee profit. Trading involves risk, and past behavior of any pattern does not guarantee future results.
///////////////////////////////////////////////////////////////////////////////////////////////////////////////////////////////
////////////////////////////////////////////////////////////////////////////////////////////////////////////////////////////////

हिन्दी (Hindi)
प्रोडक्ट का नाम

Fractal Concept by SUVO

छोटा विवरण

वॉल्यूमेट्रिक लिक्विडिटी ज़ोन, CISD, टाइमर वाली HTF कैंडल, HTF FVG, SMT डाइवर्जेंस और कैंडल स्वीप, सब एक ऑटो-थीम डैशबोर्ड में।

पूरा विवरण

Fractal Concept by SUVO MetaTrader 5 के लिए एक मल्टी-टूल प्राइस एक्शन और लिक्विडिटी इंडिकेटर है। यह Smart Money / ICT शैली के ज़रूरी लेवल और सिग्नल एक साफ़ चार्ट पर, बिल्ट-इन डैशबोर्ड के साथ दिखाता है। यह किसी भी सिम्बल और टाइमफ़्रेम पर चलता है और सफ़ेद व काले चार्ट बैकग्राउंड के अनुसार अपने आप ढल जाता है।

इसमें क्या मिलता है

1. वॉल्यूमेट्रिक लिक्विडिटी ज़ोन (ऑर्डर ब्लॉक स्टाइल)

ज़ोन कन्फ़र्म्ड स्विंग हाई/लो से बनते हैं (पिवट लंबाई बदली जा सकती है)।
हर ज़ोन में बाय/सेल वॉल्यूम का अनुपात, डेल्टा वॉल्यूम, डेल्टा % और मिड लाइन दिखती है।
20 दिन के औसत वॉल्यूम के आधार पर लिक्विडिटी रेटिंग (High / Medium / Low / Very Low)।
कैंडल क्लोज़ या विक से मिटिगेशन। स्वीप हुए ज़ोन "ब्रेकर" के रूप में रखे जा सकते हैं।
ओवरलैप फ़िल्टर, प्रति साइड अधिकतम ज़ोन, और फ़िक्स्ड / चार्ट / इनफ़िनिट एक्सटेंशन मोड।

2. CISD (Change in State of Delivery)

उलटी दिशा की कैंडल की श्रृंखला पहचानता है और ऑरिजिन लेवल के पार क्लोज़ होने पर कन्फ़र्म करता है।
साइज़ फ़िल्टर, कन्फ़र्मेशन विंडो, फ़ेल हुआ CISD दिखाने का विकल्प और 0.5 लेवल।
स्टैंडर्ड डेविएशन लेवल: 1.27, 1.68, 2.27, 3 और 4।

3. HTF कैंडल ब्लॉक

हायर टाइमफ़्रेम की कैंडल लाइव प्राइस के बगल में, आपके चार्ट टाइमफ़्रेम के हिसाब से ऑटो चुनी जाती हैं।
HTF कैंडल बंद होने तक लाइव काउंटडाउन।
पिछला हाई/लो (PDH/PDL, PWH/PWL, PMH/PML), पिछली रेंज का 25/50/75%, कैंडल मिडपॉइंट।
HTF स्वीप, हाई/लो का समय, HTF ओपन और पिछली कैंडल का EQ।

4. HTF फ़ेयर वैल्यू गैप

HTF कैंडल बंद होने पर FVG पढ़े जाते हैं। प्राइस दूसरी ओर क्लोज़ करे तो हट जाते हैं।
सबसे नए कितने गैप रखने हैं, यह चुन सकते हैं।

5. SMT डाइवर्जेंस

आपके चार्ट सिम्बल की तुलना 4 तक संबंधित सिम्बलों से (इनवर्स विकल्प सहित)।
टाइमफ़्रेम: 15m, 30m, 1H, 4H, 6H, 1D।
डाइवर्जेंस लाइन, रेफ़रेंस डॉट और एसेट लेबल बनाता है। Clean फ़िल्टर अलग-अलग टाइमफ़्रेम के दोहराए गए सिग्नल हटाता है।

6. कैंडल टाइमर और कैंडल स्वीप

प्राइस के बगल में और डैशबोर्ड में कैंडल काउंटडाउन।
जब कोई कैंडल पिछला हाई/लो लेकर वापस अंदर क्लोज़ करे तो चार्ट पर स्वीप मार्क होता है।

7. डैशबोर्ड

सिम्बल व टाइमफ़्रेम, कैंडल टाइमर, स्वीप स्टेटस, पिछला स्वीप, HTF स्वीप, सक्रिय बाय/सेल ज़ोन की गिनती, पिछला CISD, मौजूदा थीम।
चारों कोनों में से कोई भी चुनें और टेक्स्ट साइज़ सेट करें।

8. ऑटो थीम

हल्का या गहरा चार्ट पहचानकर सभी रंग अपने आप बदलता है, या Dark / Light मैन्युअली चुनें।
सेटअप नोट्स
SMT सिम्बल: इनपुट में संबंधित एसेट के लिए अपने ब्रोकर के सटीक सिम्बल नाम लिखें और उन्हें Market Watch में रखें। सिम्बल उपलब्ध न हो तो उस एसेट का SMT छोड़ दिया जाता है।
न्यूयॉर्क समय लेबल: “Hours to add to broker time to get New York time” इनपुट अपने ब्रोकर के सर्वर टाइम के अनुसार सेट करें।
वॉल्यूम: डिफ़ॉल्ट रूप से टिक वॉल्यूम (स्पॉट Forex/CFD)। जहाँ ब्रोकर रियल वॉल्यूम देता है वहाँ “Use real volume” चालू करें।
इंडिकेटर चार्ट ऑब्जेक्ट से ड्रॉ करता है, नई बार पर और टाइमर के लिए हर सेकंड रिफ़्रेश होता है। DLL नहीं चाहिए और यह ट्रेड नहीं करता।
HTF ब्लॉक के लिए जगह बनाने हेतु चार्ट शिफ़्ट डिफ़ॉल्ट रूप से चालू है। चाहें तो इनपुट में बंद कर दें।
सुझाया गया उपयोग

कन्फ़्लुएंस टूल के रूप में उपयोग करें। जैसे HTF कैंडल और FVG से बायस, लिक्विडिटी ज़ोन और स्वीप से एरिया, और CISD या SMT से कन्फ़र्मेशन। पहले डेमो अकाउंट पर टेस्ट करें।

अस्वीकरण

यह एक विश्लेषण टूल है, वित्तीय सलाह नहीं। यह ट्रेड सिग्नल नहीं देता और मुनाफ़े की गारंटी नहीं देता। ट्रेडिंग में जोखिम है, और किसी पैटर्न का पिछला व्यवहार भविष्य के नतीजों की गारंटी नहीं है।

/////////////////////////////////////////////////////////////////////////////////////////////////////
/////////////////////////////////////////////////////////////////////////////////////////////////////

বাংলা (Bengali)
প্রোডাক্টের নাম

Fractal Concept by SUVO

সংক্ষিপ্ত বিবরণ

ভলিউমেট্রিক লিকুইডিটি জোন, CISD, টাইমারসহ HTF ক্যান্ডেল, HTF FVG, SMT ডাইভারজেন্স এবং ক্যান্ডেল সুইপ, সব একটি অটো-থিম ড্যাশবোর্ডে।

সম্পূর্ণ বিবরণ

Fractal Concept by SUVO MetaTrader 5-এর জন্য একটি মাল্টি-টুল প্রাইস অ্যাকশন ও লিকুইডিটি ইন্ডিকেটর। এটি Smart Money / ICT ধাঁচের গুরুত্বপূর্ণ লেভেল ও সিগনাল একটি পরিষ্কার চার্টে, বিল্ট-ইন ড্যাশবোর্ডসহ দেখায়। যেকোনো সিম্বল ও টাইমফ্রেমে কাজ করে এবং সাদা ও কালো চার্ট ব্যাকগ্রাউন্ড অনুযায়ী নিজে থেকেই মানিয়ে নেয়।

কী কী পাবেন

১. ভলিউমেট্রিক লিকুইডিটি জোন (অর্ডার ব্লক স্টাইল)

কনফার্মড সুইং হাই/লো থেকে জোন তৈরি হয় (পিভট দৈর্ঘ্য পরিবর্তনযোগ্য)।
প্রতিটি জোনে বাই/সেল ভলিউমের অনুপাত, ডেল্টা ভলিউম, ডেল্টা % ও মিড লাইন দেখায়।
২০ দিনের গড় ভলিউমের ভিত্তিতে লিকুইডিটি রেটিং (High / Medium / Low / Very Low)।
ক্যান্ডেল ক্লোজ বা উইক দিয়ে মিটিগেশন। সুইপ হওয়া জোন "ব্রেকার" হিসেবে রাখা যায়।
ওভারল্যাপ ফিল্টার, প্রতি সাইডে সর্বোচ্চ জোন, এবং ফিক্সড / চার্ট / ইনফিনিট এক্সটেনশন মোড।

২. CISD (Change in State of Delivery)

বিপরীত দিকের ক্যান্ডেলের সিরিজ চিনে নেয় এবং অরিজিন লেভেলের ওপারে ক্লোজ হলে কনফার্ম করে।
সাইজ ফিল্টার, কনফার্মেশন উইন্ডো, ফেইল হওয়া CISD দেখানোর অপশন এবং 0.5 লেভেল।
স্ট্যান্ডার্ড ডেভিয়েশন লেভেল: 1.27, 1.68, 2.27, 3 ও 4।

৩. HTF ক্যান্ডেল ব্লক

হায়ার টাইমফ্রেমের ক্যান্ডেল লাইভ প্রাইসের পাশে, আপনার চার্ট টাইমফ্রেম অনুযায়ী অটো বাছাই হয়।
HTF ক্যান্ডেল ক্লোজ হওয়া পর্যন্ত লাইভ কাউন্টডাউন।
আগের হাই/লো (PDH/PDL, PWH/PWL, PMH/PML), আগের রেঞ্জের 25/50/75%, ক্যান্ডেল মিডপয়েন্ট।
HTF সুইপ, হাই/লো-এর সময়, HTF ওপেন ও আগের ক্যান্ডেলের EQ।

৪. HTF ফেয়ার ভ্যালু গ্যাপ

HTF ক্যান্ডেল ক্লোজ হলে FVG পড়া হয়। প্রাইস অপর প্রান্ত দিয়ে ক্লোজ করলে মুছে যায়।
সবচেয়ে নতুন কতগুলো গ্যাপ রাখবেন তা বেছে নেওয়া যায়।

৫. SMT ডাইভারজেন্স

আপনার চার্ট সিম্বলকে সর্বোচ্চ ৪টি সম্পর্কিত সিম্বলের সঙ্গে তুলনা (ইনভার্স অপশনসহ)।
টাইমফ্রেম: 15m, 30m, 1H, 4H, 6H, 1D।
ডাইভারজেন্স লাইন, রেফারেন্স ডট ও অ্যাসেট লেবেল আঁকে। Clean ফিল্টার বিভিন্ন টাইমফ্রেমের পুনরাবৃত্ত সিগনাল সরিয়ে দেয়।

৬. ক্যান্ডেল টাইমার ও ক্যান্ডেল সুইপ

প্রাইসের পাশে ও ড্যাশবোর্ডে ক্যান্ডেল কাউন্টডাউন।
কোনো ক্যান্ডেল আগের হাই/লো নিয়ে আবার ভেতরে ক্লোজ করলে চার্টে সুইপ মার্ক হয়।

৭. ড্যাশবোর্ড

সিম্বল ও টাইমফ্রেম, ক্যান্ডেল টাইমার, সুইপ স্ট্যাটাস, শেষ সুইপ, HTF সুইপ, সক্রিয় বাই/সেল জোনের সংখ্যা, শেষ CISD, বর্তমান থিম।
চার কোণের যেকোনোটি বেছে নিন এবং টেক্সট সাইজ ঠিক করুন।

৮. অটো থিম

হালকা বা গাঢ় চার্ট চিনে সব রং নিজে থেকে বদলায়, অথবা Dark / Light নিজে বেছে নিন।
সেটআপ নোট
SMT সিম্বল: ইনপুটে সম্পর্কিত অ্যাসেটের জন্য আপনার ব্রোকারের সঠিক সিম্বল নাম লিখুন এবং Market Watch-এ রাখুন। সিম্বল না থাকলে ওই অ্যাসেটের SMT বাদ যায়।
নিউ ইয়র্ক সময়ের লেবেল: “Hours to add to broker time to get New York time” ইনপুটটি আপনার ব্রোকারের সার্ভার টাইম অনুযায়ী ঠিক করুন।
ভলিউম: ডিফল্টভাবে টিক ভলিউম (স্পট Forex/CFD)। ব্রোকার রিয়েল ভলিউম দিলে “Use real volume” চালু করুন।
ইন্ডিকেটর চার্ট অবজেক্ট দিয়ে আঁকে, নতুন বারে এবং টাইমারের জন্য প্রতি সেকেন্ডে রিফ্রেশ হয়। DLL লাগে না এবং এটি ট্রেড করে না।
HTF ব্লকের জায়গা করতে চার্ট শিফট ডিফল্টভাবে চালু। চাইলে ইনপুটে বন্ধ করুন।
ব্যবহারের পরামর্শ

কনফ্লুয়েন্স টুল হিসেবে ব্যবহার করুন। যেমন HTF ক্যান্ডেল ও FVG দিয়ে বায়াস, লিকুইডিটি জোন ও সুইপ দিয়ে এরিয়া, আর CISD বা SMT দিয়ে কনফার্মেশন। আগে ডেমো অ্যাকাউন্টে টেস্ট করুন।

দায় অস্বীকার

এটি একটি বিশ্লেষণ টুল, আর্থিক পরামর্শ নয়। এটি ট্রেড সিগনাল দেয় না এবং মুনাফার নিশ্চয়তা দেয় না। ট্রেডিংয়ে ঝুঁকি আছে, কোনো প্যাটার্নের অতীত আচরণ ভবিষ্যতের ফলের নিশ্চয়তা নয়।

//////////////////////////////////////////////////////////////////////////////////////////////////////////////////////
////////////////////////////////////////////////////////////////////////////////////////////////////////////////////

简体中文 (Chinese)
产品名称

Fractal Concept by SUVO

简短说明

成交量流动性区域、CISD、带倒计时的高周期K线、高周期FVG、SMT背离和K线扫荡,集成在自动主题仪表盘中。

完整说明

Fractal Concept by SUVO 是适用于 MetaTrader 5 的多功能价格行为与流动性指标。它把 Smart Money / ICT 风格的关键位和信号集中在一张清晰的图表上,并内置仪表盘。适用于任何品种和周期,并能根据白色或黑色图表背景自动适配。

功能一览

1. 成交量流动性区域(订单块风格)

根据已确认的波段高低点生成区域(枢轴长度可调)。
每个区域显示买/卖成交量占比、Delta 成交量、Delta % 和中线。
基于20日平均成交量给出流动性评级(High / Medium / Low / Very Low)。
可按K线收盘或影线判断缓解。被扫荡的区域可保留为"Breaker"。
重叠过滤、每侧最大区域数,以及固定 / 跟随图表 / 无限延伸模式。

2. CISD(Change in State of Delivery)

识别反向K线序列,收盘回到起点位之外时确认。
大小过滤、确认窗口、可显示失败的 CISD,以及 0.5 位。
标准差水平:1.27、1.68、2.27、3 和 4。

3. 高周期(HTF)K线区块

在实时价格旁绘制更高周期的K线,根据当前图表周期自动选择。
实时倒计时至HTF K线收盘。
前高/前低(PDH/PDL、PWH/PWL、PMH/PML)、前一根K线区间的 25/50/75%、K线中点。
HTF 扫荡、高低点时间、HTF 开盘价和前一根K线的 EQ。

4. HTF 公允价值缺口(FVG)

HTF K线收盘后读取 FVG。当价格收盘穿过远端时自动移除。
可选择保留最新的几个缺口。

5. SMT 背离

将当前图表品种与最多4个相关品种比较(支持反向品种)。
周期:15m、30m、1H、4H、6H、1D。
绘制背离线、参考点和品种标签。Clean 过滤会去除不同周期的重复信号。

6. K线倒计时与K线扫荡

价格旁和仪表盘中显示K线倒计时。
当某根K线突破前高/前低后又收回区间内,图表上会标记扫荡。

7. 仪表盘

品种与周期、K线倒计时、扫荡状态、最近一次扫荡、HTF 扫荡、有效买/卖区域数量、最近一次 CISD、当前主题。
可选四个角落之一,并设置文字大小。

8. 自动主题

自动识别浅色或深色图表并调整所有颜色,也可手动选择 Dark / Light。
设置说明
SMT 品种: 请在输入参数中填写您经纪商的准确品种名称,并确保它们已加入市场报价(Market Watch)。若品种不可用,该品种的 SMT 会被跳过。
纽约时间标签: 请根据经纪商服务器时间设置"Hours to add to broker time to get New York time"。
成交量: 默认使用跳动量(现货外汇/CFD)。若经纪商提供真实成交量,请开启"Use real volume"。
指标使用图表对象绘制,在新K线时刷新,倒计时每秒刷新。不需要 DLL,也不会自动下单。
为给 HTF 区块留出空间,默认开启图表右移。如不需要,可在输入中关闭。
使用建议

建议作为共振(confluence)工具使用。例如:用 HTF K线和 FVG 判断偏向,用流动性区域和扫荡确定区域,用 CISD 或 SMT 作为确认。请先在模拟账户中测试。

免责声明

本产品是分析工具,不构成投资建议。它不会产生交易信号,也不保证盈利。交易有风险,任何形态的历史表现都不代表未来结果。
Subrata Das 출시돈 제품

Product name Fractal Concept by SUVO Short description (one line) Volumetric liquidity zones, CISD, HTF candles with timers, HTF FVG, SMT divergence and candle sweeps in one auto-theme dashboard. Full description Fractal Concept by SUVO is a multi-tool price action and liquidity indicator for MetaTrader 5. It places the key levels and signals of a Smart Money / ICT style workflow on one clean chart, with a built-in dashboard. It works on any symbol and timeframe, and adapts automatically to

Subrata Das 출시돈 제품

Product name Liquidity Zones Volumetric Delta Automatic buy-side and sell-side liquidity zones with volumetric buy/sell bars, delta strip and liquidity . Full description Liquidity Zones Volumetric Delta detects swing-based liquidity zones and shows how much buying and selling volume was behind each one, directly on your chart. What it does Finds swing highs and swing lows using adjustable left/right pivot lengths.. Builds a zone around each pivot. Zone thickness is based on ATR, so it adapts to

Subrata Das 출시돈 제품

All-in-one Smart Money toolkit: Fair Value Gaps & Breakers, BOS/CHoCH market structure with liquidity sweeps, CISD, and Volumetric Order Blocks with B/S/Delta — in one clean indicator. PriceAction Concept by Suvo is a complete Smart Money / price action toolkit built for traders who read structure, liquidity and imbalance. Everything runs in one indicator, so your chart stays clean. 5) ALERTS • Popup and push notifications for Bullish/Bearish BOS and CHoCH. ★ HOW TO USE 1. Attach the

Subrata Das
Subrata Das
XAUUSD:-
1.Liquidity Sweep
2.Wait for ifvg
3.Cheak high volume candle (Volume should be higher then tha Previous Candle)
4.entry
5.Terget for next liquidity
Subrata Das
Subrata Das
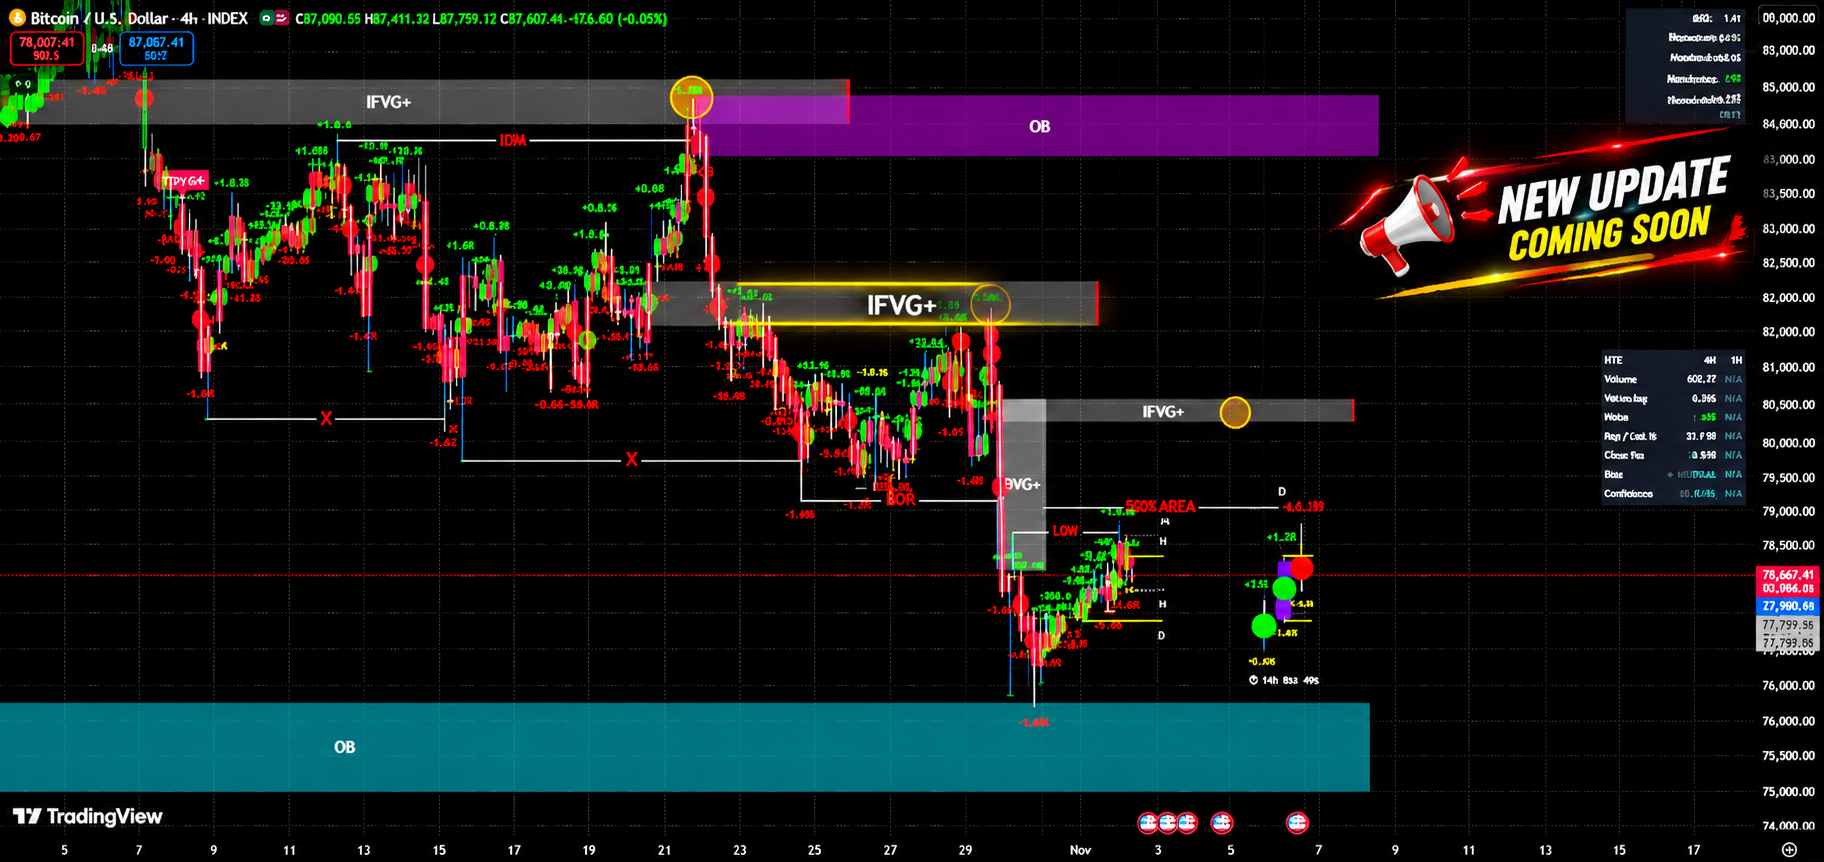
NEW UPDATE COMING SOON WITH PRICEACTION
Subrata Das
Subrata Das
NEW UPDATE COMING SOON:-
Subrata Das
Subrata Das
WITH-VOLUME FOOTPRINT
12