Michaeltakaba Tsukasa
  • 정보
no
경험
1
제품
0
데모 버전
0
작업
0
거래 신호
0
구독자
친구

프로필 또는 사용자 검색을 통해 친구를 추가하면 친구가 온라인 상태인지 확인할 수 있습니다

Michaeltakaba Tsukasa
FX Strategy Lab - Setup Alerts, Sessions & Data Export

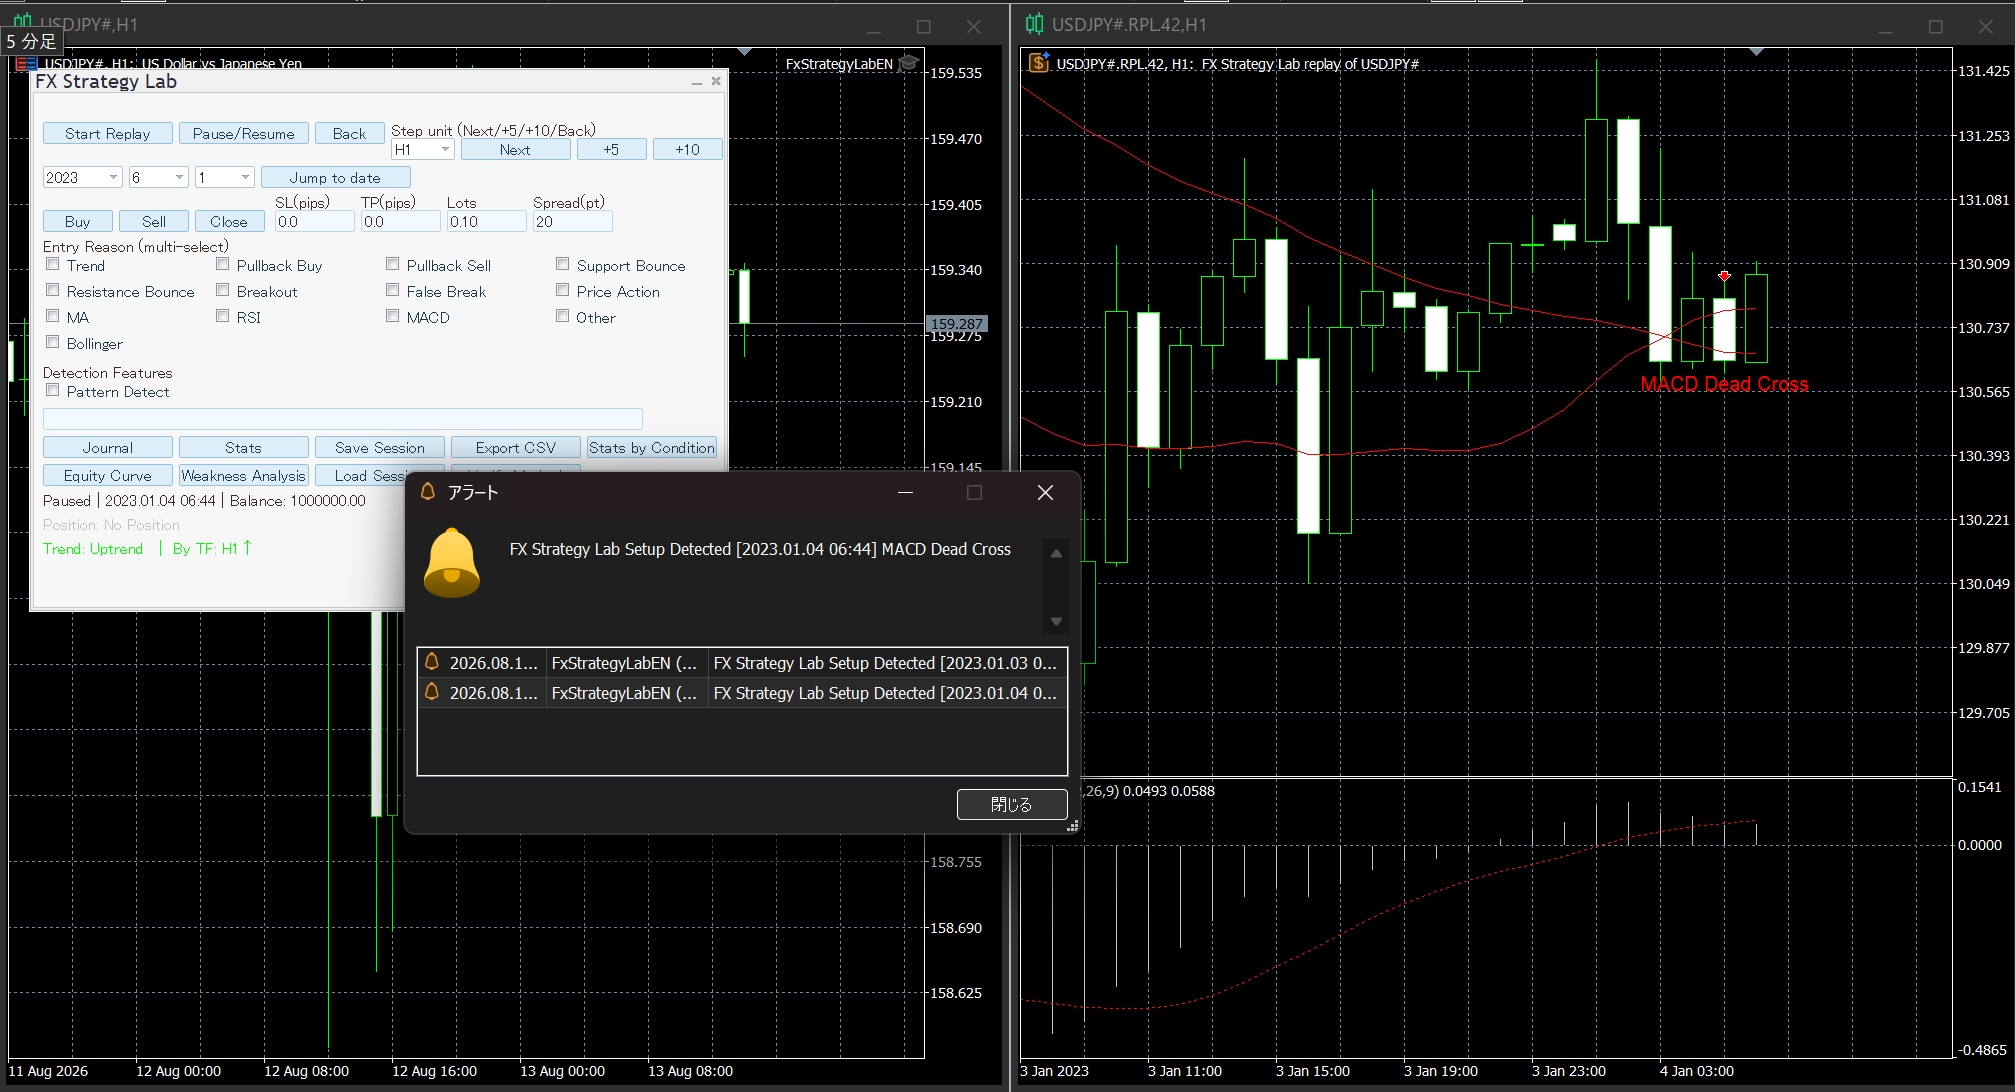
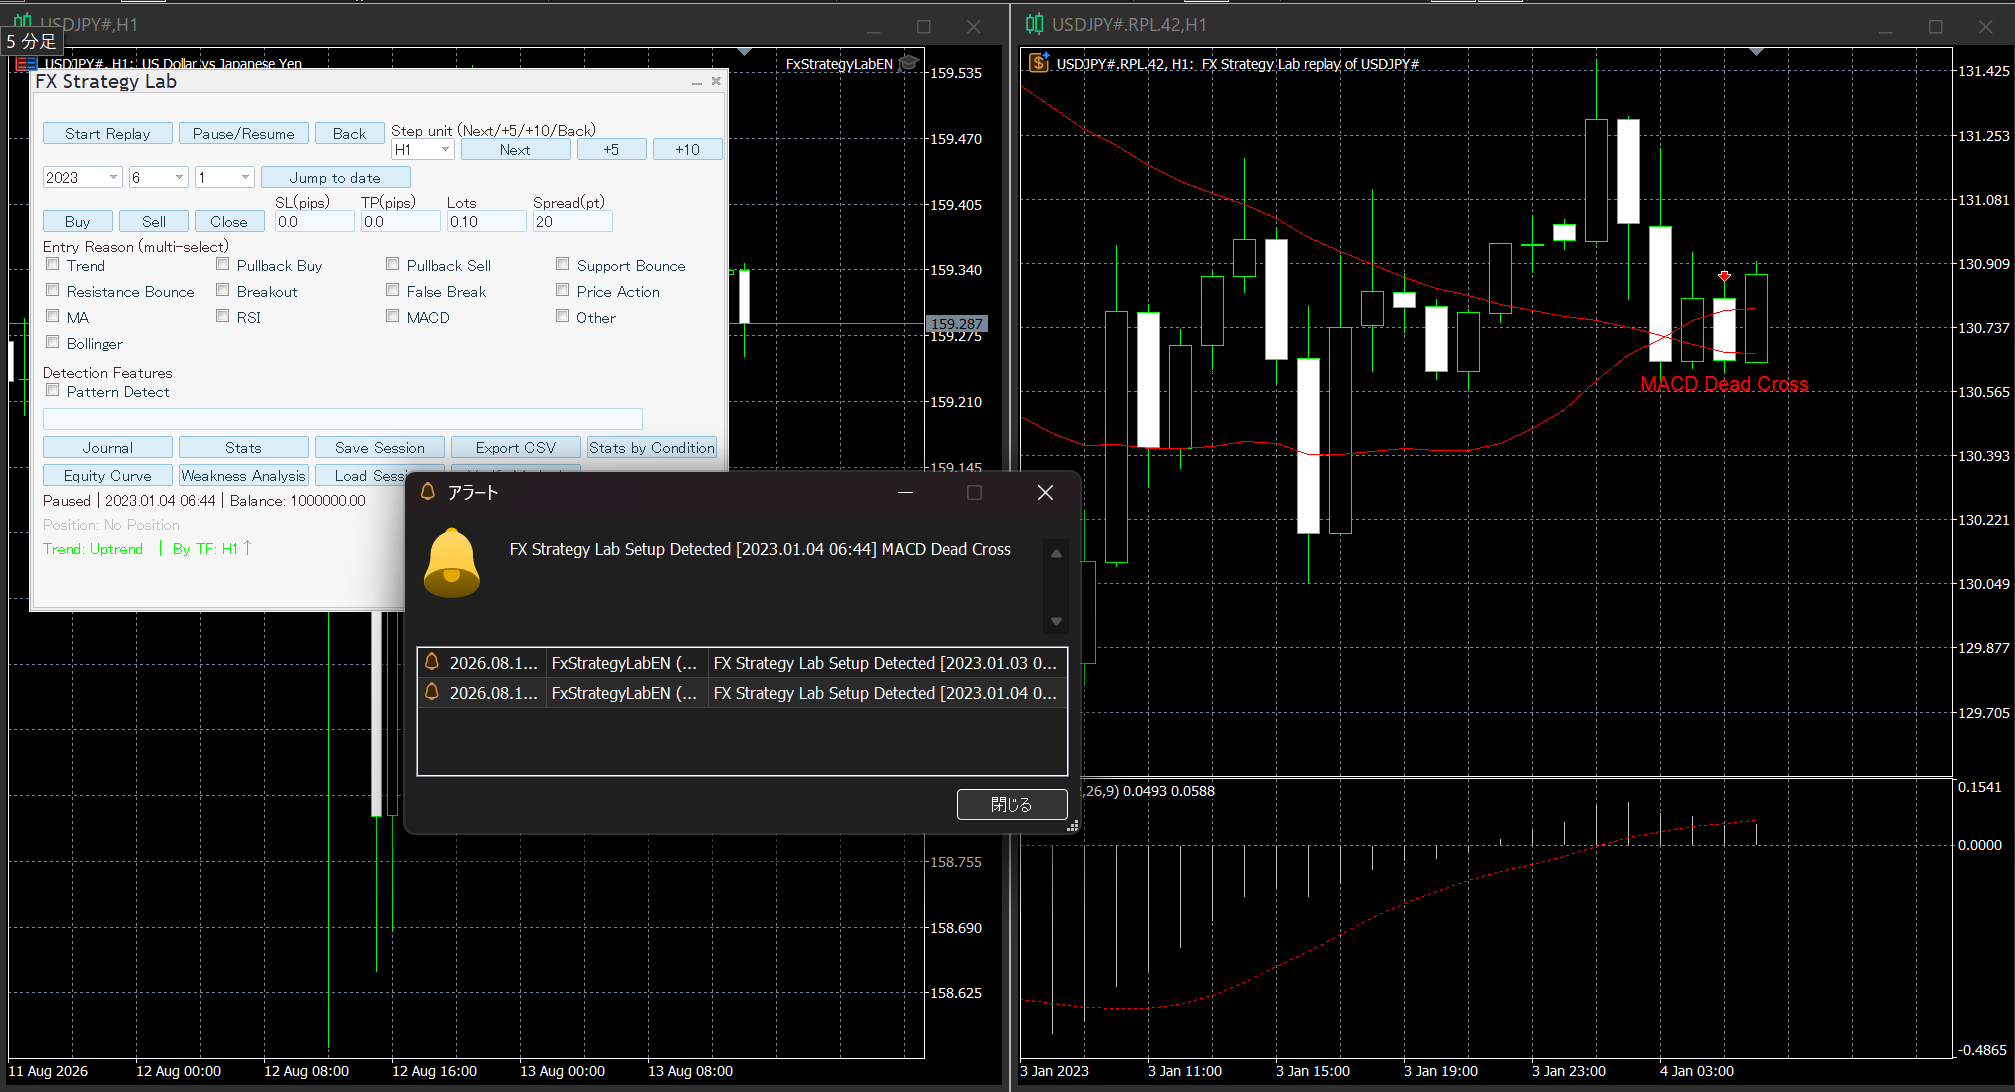
Setup Alerts fire a popup and a sound the moment a signal forms. Turn on whichever trigger(s) you want:
- 051 Pattern detection
- 052 Divergence
- 020 MACD cross / 022 MACD zero-line cross / 026 MACD divergence
- 030 RSI level / 037 Stochastic level / 039 Stochastic cross / 041 Stochastic divergence
- 044 Ichimoku Tenkan/Kijun cross / 046 Ichimoku cloud breakout / 048 Ichimoku cloud twist / 050 Ichimoku Chikou cross
- 057 S/R breakout / 058 BOS/CHoCH
- 068 Bollinger Band signal

Optional filters: 053 only during an uptrend, 054 only during a downtrend, 055-056 only near S/R (with distance), 059 play a sound.

Save Session (no input needed - it's a panel button) stores your symbol, timeframe, verification period, initial balance, full trade history, and the exact bar the replay was paused at. Load Session (before starting a new replay) rebuilds the same replay and automatically fast-forwards back to that paused point.

Trade history and Method Verification results both export straight to CSV, so you can open them in Excel or any spreadsheet tool.

That's the full toolkit. A full step-by-step manual covering every one of the 121 input parameters is also linked from the product page.
Michaeltakaba Tsukasa
FX Strategy Lab - Journal, Statistics & Automated Method Verification

The Journal, Statistics, Stats by Condition, Weakness Analysis, and Equity Curve buttons don't need any input turned on - they work directly off whatever trades you've placed. Two inputs control how the journal displays:
- 118 Journal filter (all / wins only / losses only)
- 119 Journal sort order (default: newest first)

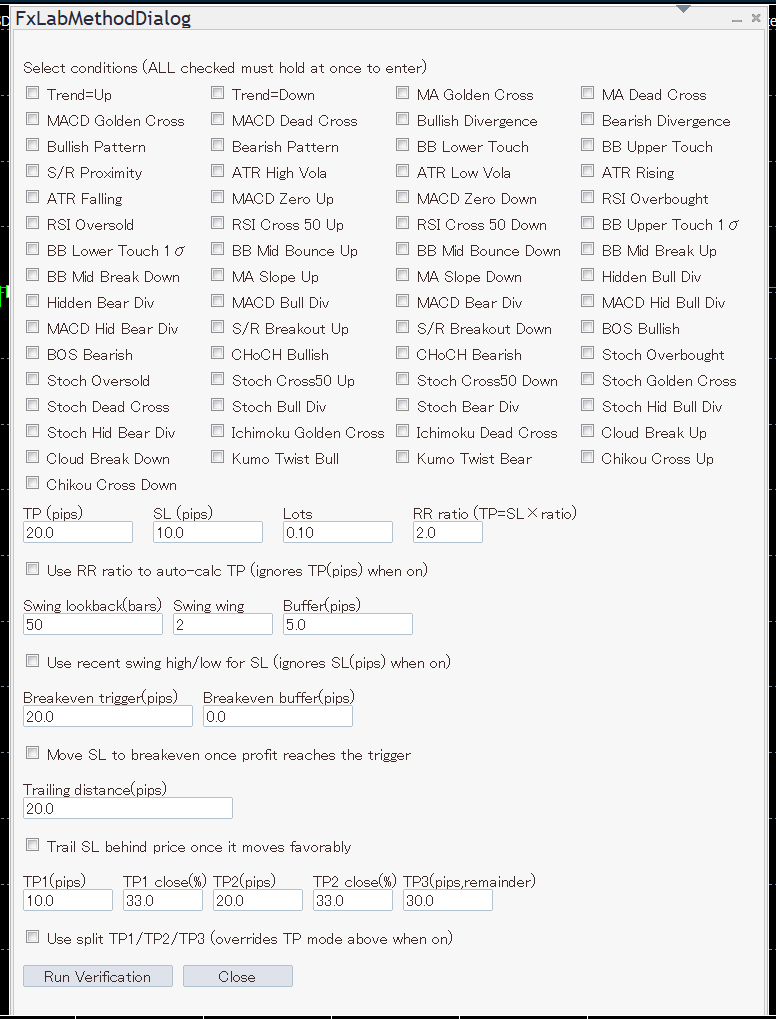
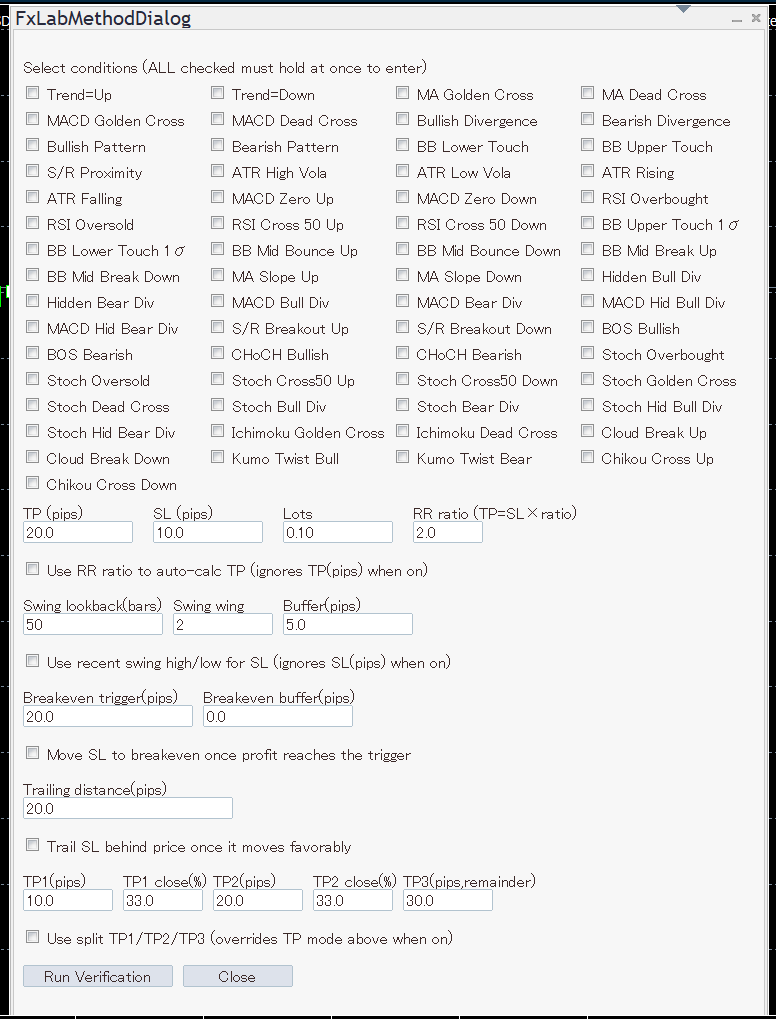
Method Verification (its own button, opens a dialog) lets you select any combination of built-in conditions - trend, MACD, RSI, Stochastic, Bollinger, Ichimoku, S/R breakout, market structure, ATR, candlestick patterns, divergence, and more - combine them with AND logic, set your TP/SL/lot rules (or any of the risk-management options from the previous post), and get win rate, profit factor, expectancy, and drawdown over your full available history in seconds. Every run is logged to CSV so you can compare methods side by side later.
Michaeltakaba Tsukasa
FX Strategy Lab - Risk Management Tools

Every option below works identically in live replay trading and inside the automated Method Verification engine.

- 079 Use an RR ratio for TP (080 sets the ratio, e.g. 2.0 = TP twice as far as SL)
- 076 Use ATR multiples for SL/TP (077-078 set the multipliers)
- 081 Use a recent swing high/low for SL (082-084 tune the lookback, fractal wing size, and buffer)
- 085 Move SL to breakeven once profit reaches a trigger distance (086-087 set the trigger and buffer)
- 088 Trail SL behind price (089 sets the trailing distance)
- 090 Use split TP1/TP2/TP3 (091-095 set each level's distance and percent to close)

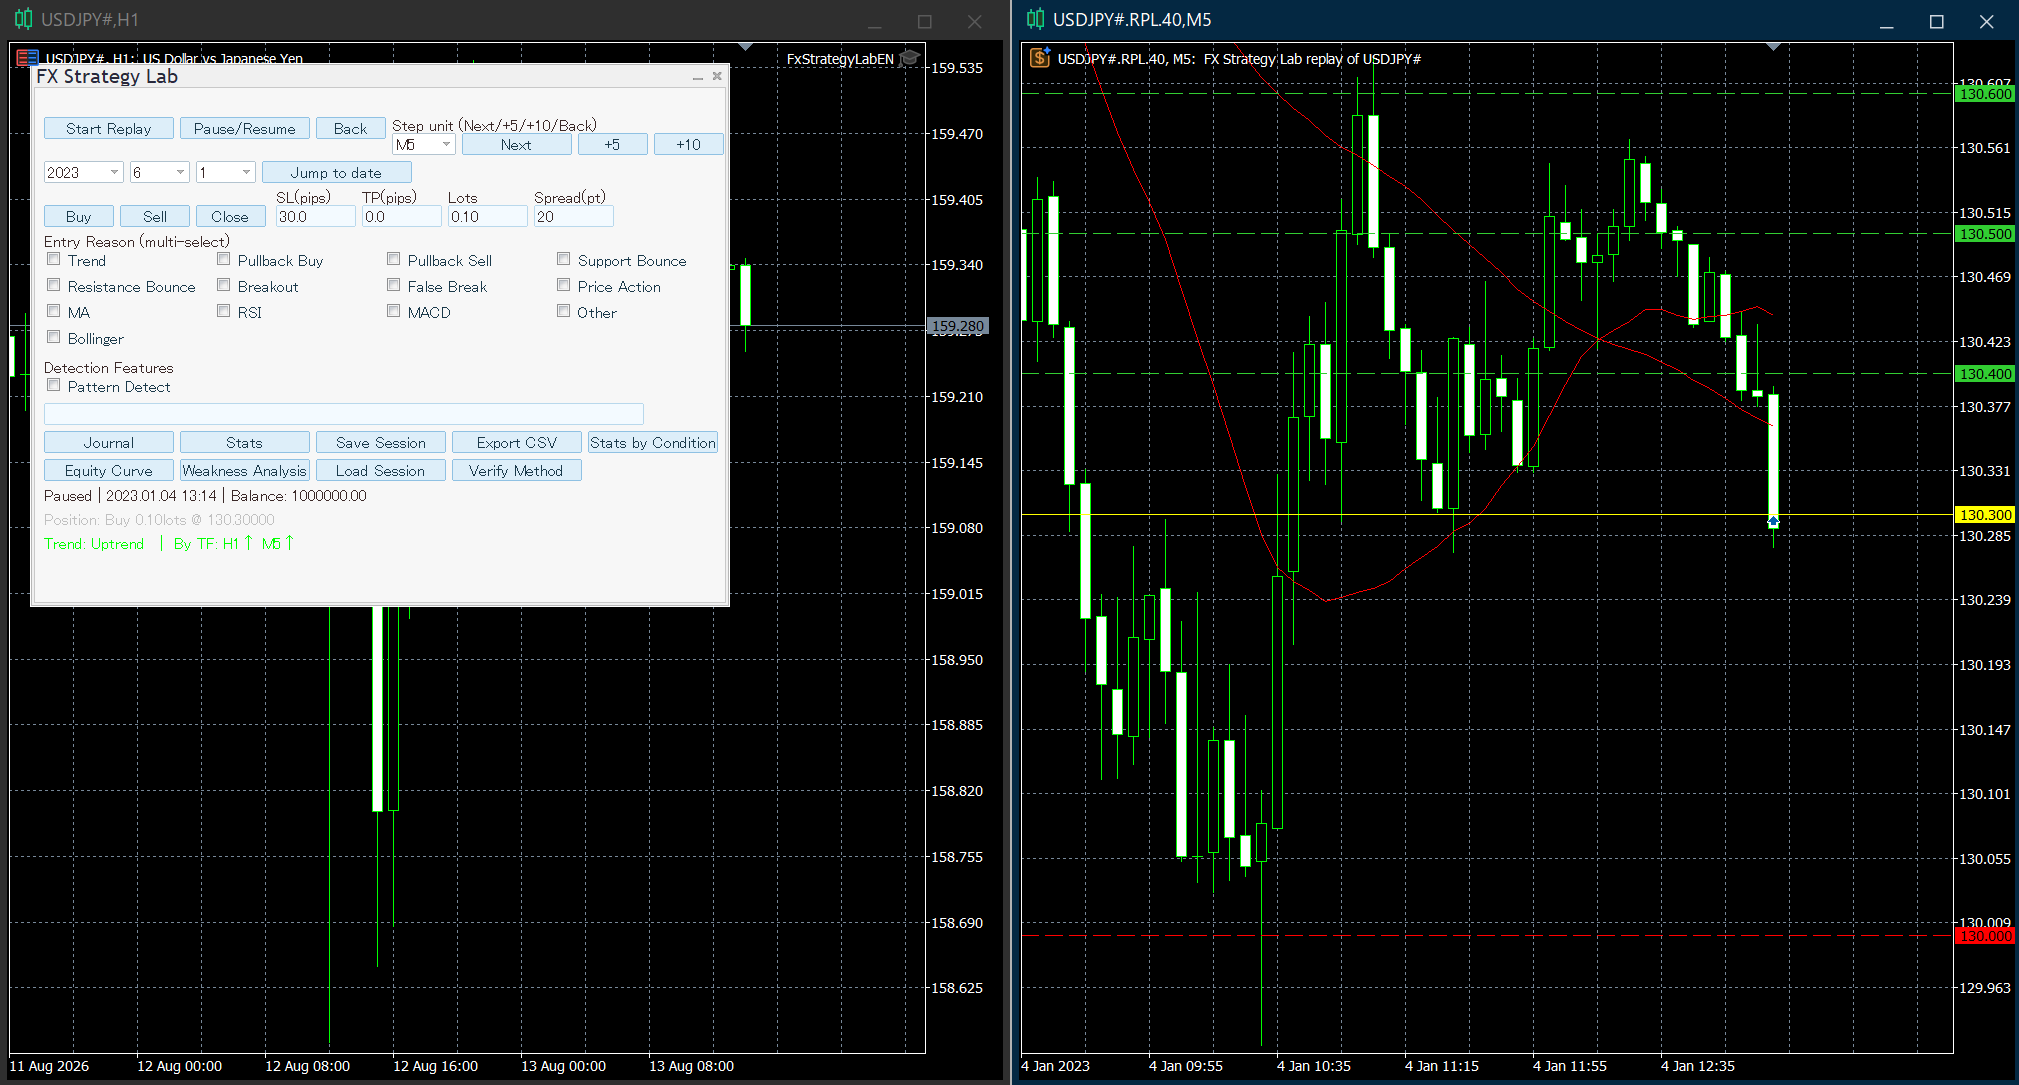
While a position is open, a solid line marks your entry, a dashed red line your SL, and a dashed green line your TP, right on the chart - no input needed, it's automatic.
Michaeltakaba Tsukasa
FX Strategy Lab - Support/Resistance & Market Structure

- 096 Show swing-cluster S/R levels
- 102 Detect S/R breakout (requires 096 on) - fires the instant a candle's CLOSE crosses the level, not on a wick-only touch, since a wick-only breach is often a false break
- 103 Show previous-day pivot points
- 104 Show previous day's high/low
- 105 Show previous week's high/low
- 106 Show previous month's high/low
- 108 Show Asian session high/low (109-110 set the session hours)
- 111 Show round-number levels (112-113 set the interval and count each side)
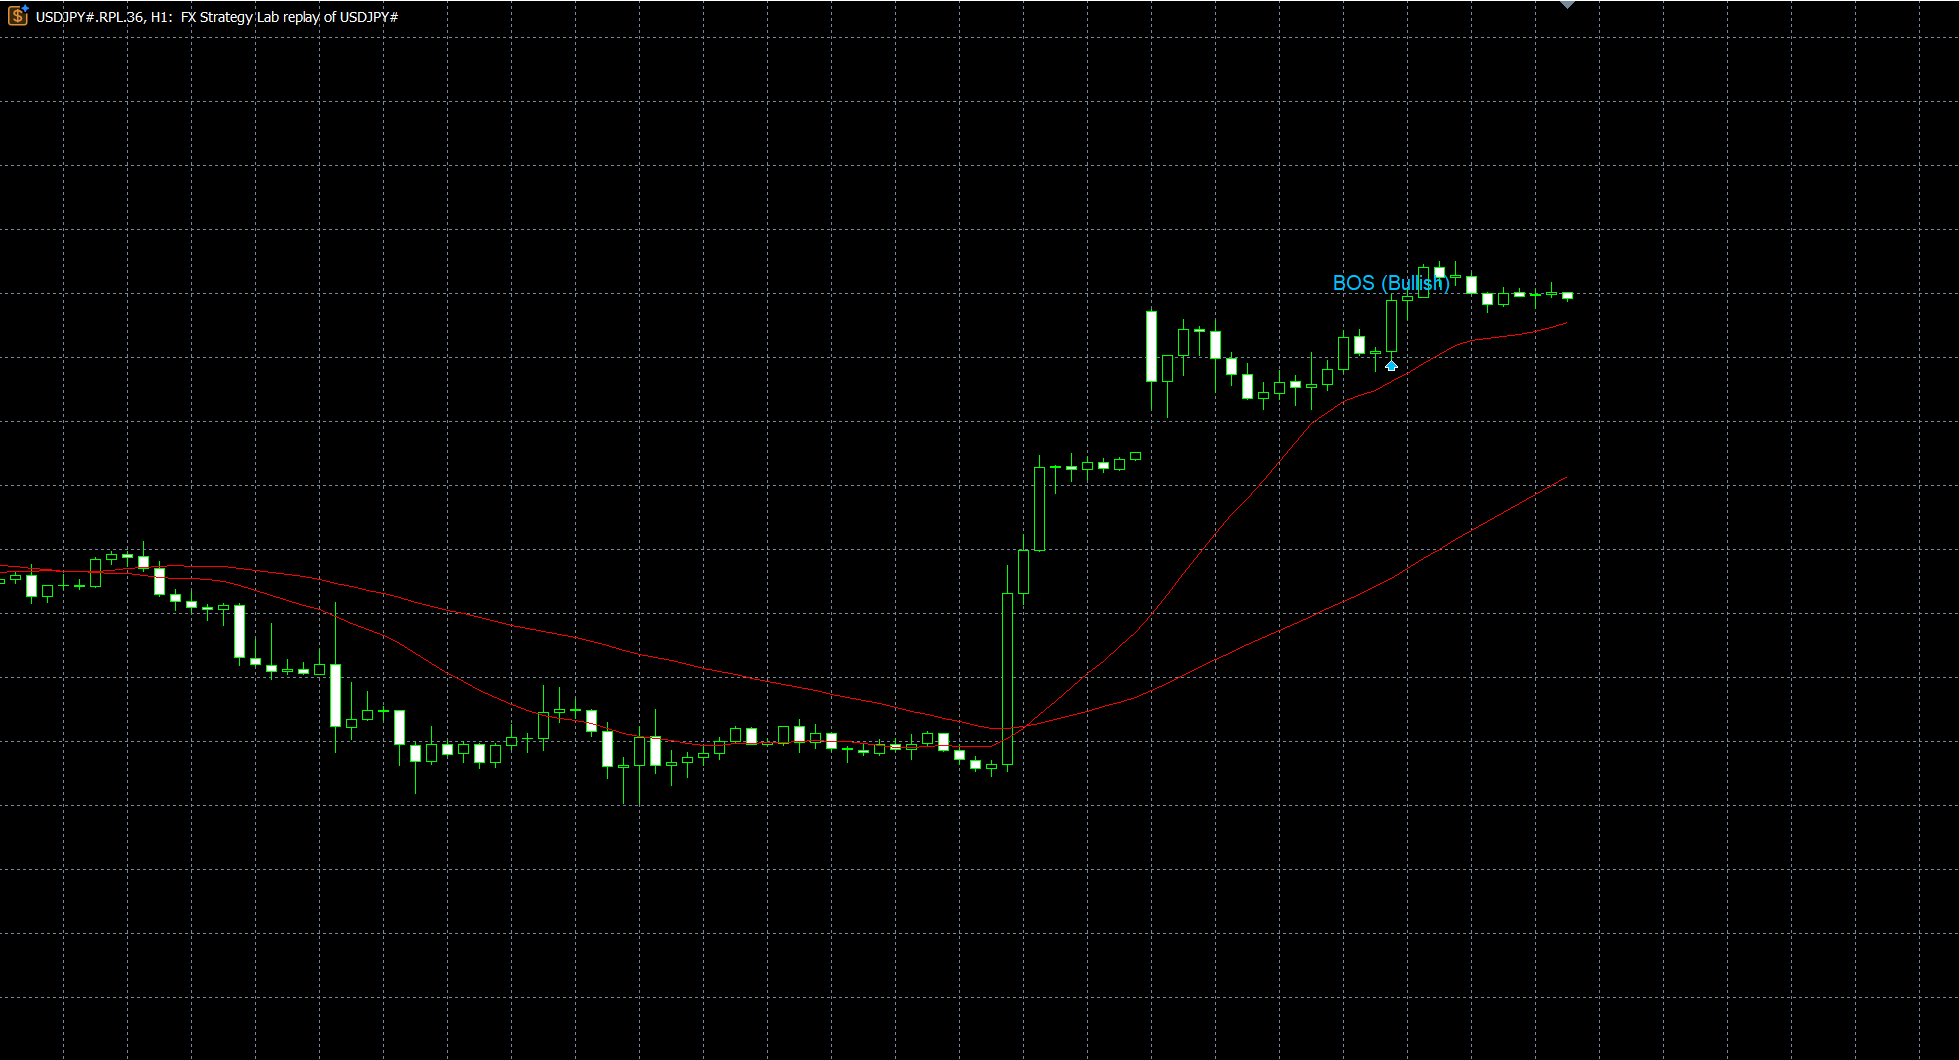
- 017 Detect BOS/CHoCH (market structure break)

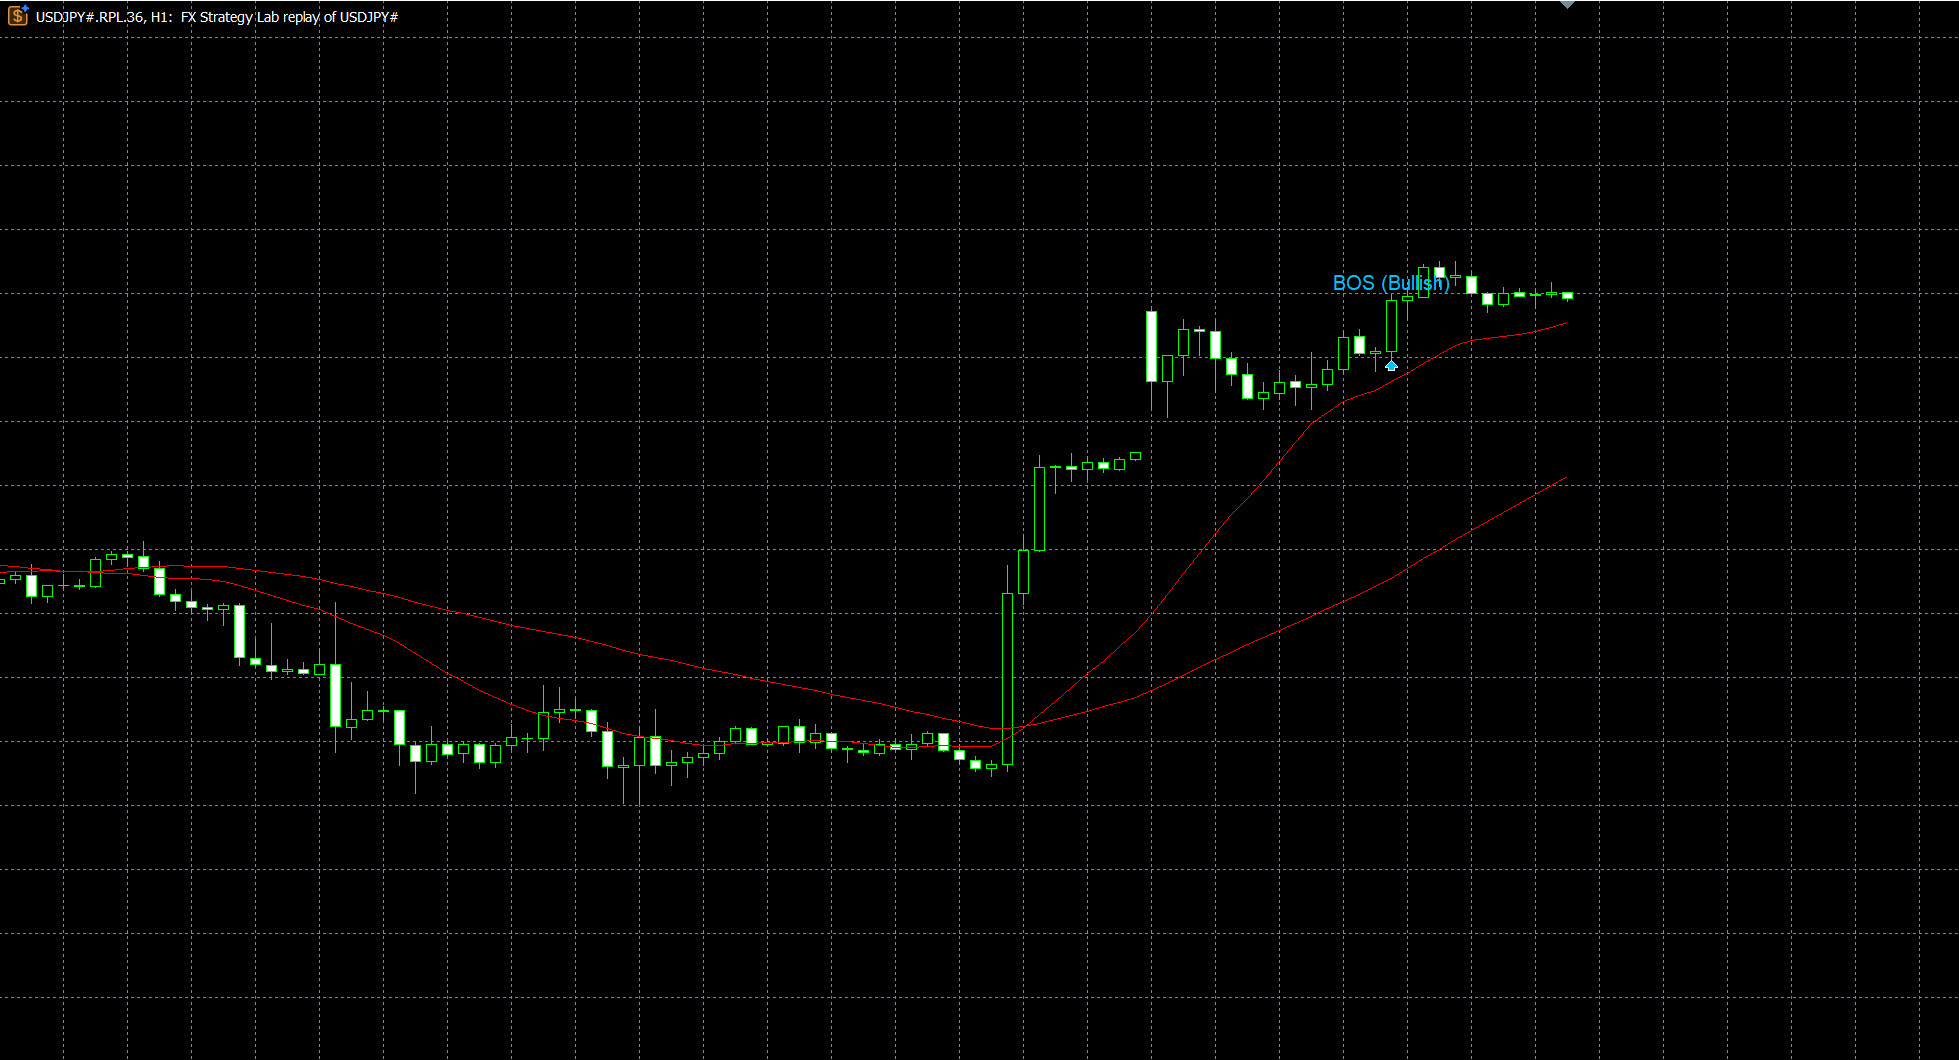
Market structure: Break of Structure (BOS) fires when price breaks a swing level in the direction of the existing trend (continuation). Change of Character (CHoCH) fires when price breaks against the existing trend (possible reversal).
Michaeltakaba Tsukasa
FX Strategy Lab - Indicator Signals

Every indicator below is controlled by a "Show" switch plus its own signal-detection switches. Turn on only what you want to see - here's exactly which input number does what.

MACD:
- 018 Show MACD
- 019 Detect MACD golden/dead cross
- 021 Detect MACD zero-line cross
- 025 Show MACD divergence detection

RSI:
- 023 Show RSI
- 027 Detect RSI overbought/oversold + 50-line cross
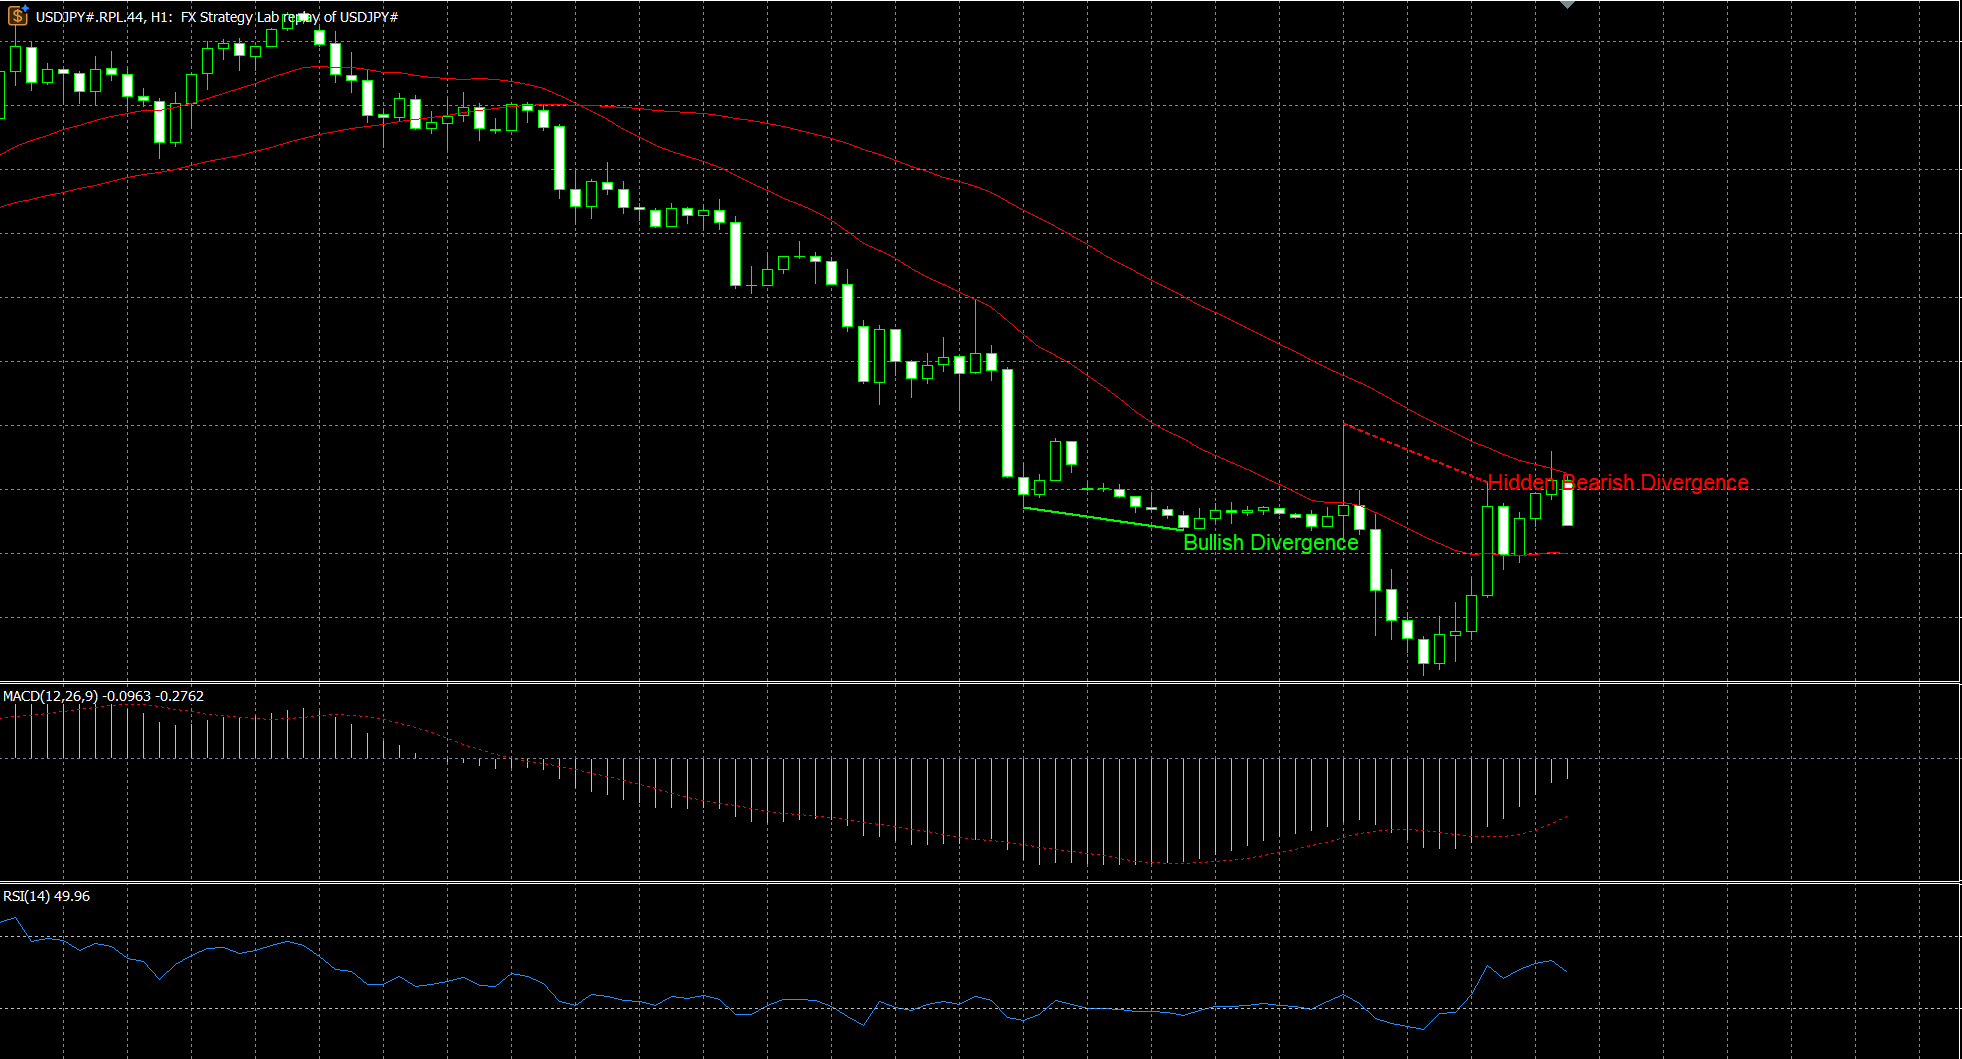
- 024 Show RSI divergence detection (solid line = regular, dotted = hidden)

Stochastic (same depth as RSI):
- 033 Show Stochastic
- 034 Detect Stochastic overbought/oversold + 50-line cross
- 038 Detect Stochastic %K/%D cross
- 040 Show Stochastic divergence detection

Bollinger Bands (1-sigma/2-sigma/3-sigma, individually color-coded):
- 060 Show Bollinger Bands - this single switch also enables touch, squeeze, band-walk, and mid-line bounce/break detection

Ichimoku Kinko Hyo:
- 042 Show Ichimoku
- 043 Detect Tenkan/Kijun cross
- 045 Detect cloud (Kumo) breakout
- 047 Detect cloud twist
- 049 Detect Chikou span cross

All of these can also drive a Setup Alert and become a condition in the automated Method Verification engine - more on that in later posts.
Michaeltakaba Tsukasa
FX Strategy Lab - Getting Started

Before you begin: FX Strategy Lab replays the price history already stored in your MT5 terminal. Open View > History Center (F2), select your symbol and timeframe, and click Download to pull the full history your broker has available. Note the earliest date shown - that's the earliest start date you can use for a verification period (input 004).

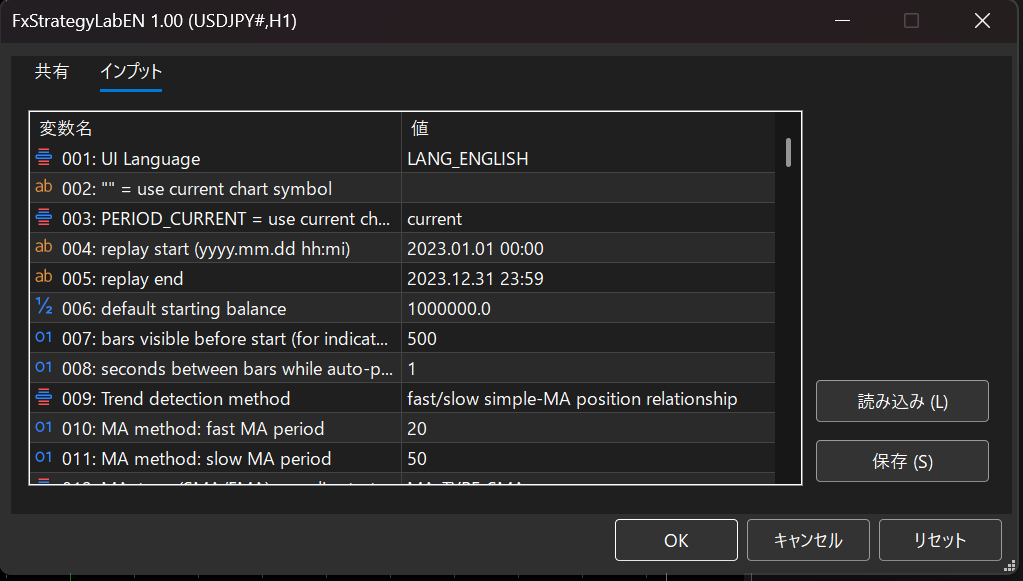
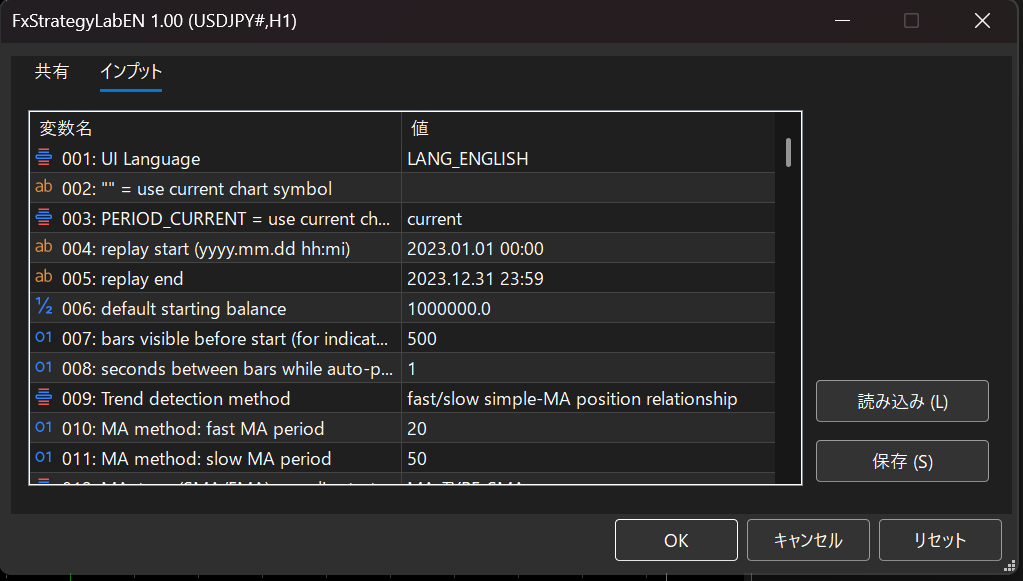
To attach the EA, drag "FxStrategyLabEN" from the Navigator onto any chart, check "Allow Algo Trading", and click OK. Every input has a 3-digit number in its comment (e.g. "023: Show RSI"), so you can jump straight to any setting using the Inputs tab's search box. Key basics:
- 001 UI Language
- 002 Symbol ("" = current chart symbol)
- 003 Timeframe (PERIOD_CURRENT = current chart timeframe)
- 004-005 Verification start/end date
- 006 Initial balance
- 009 Trend detection method (moving average or swing structure)
- 012 MA type (SMA/EMA)

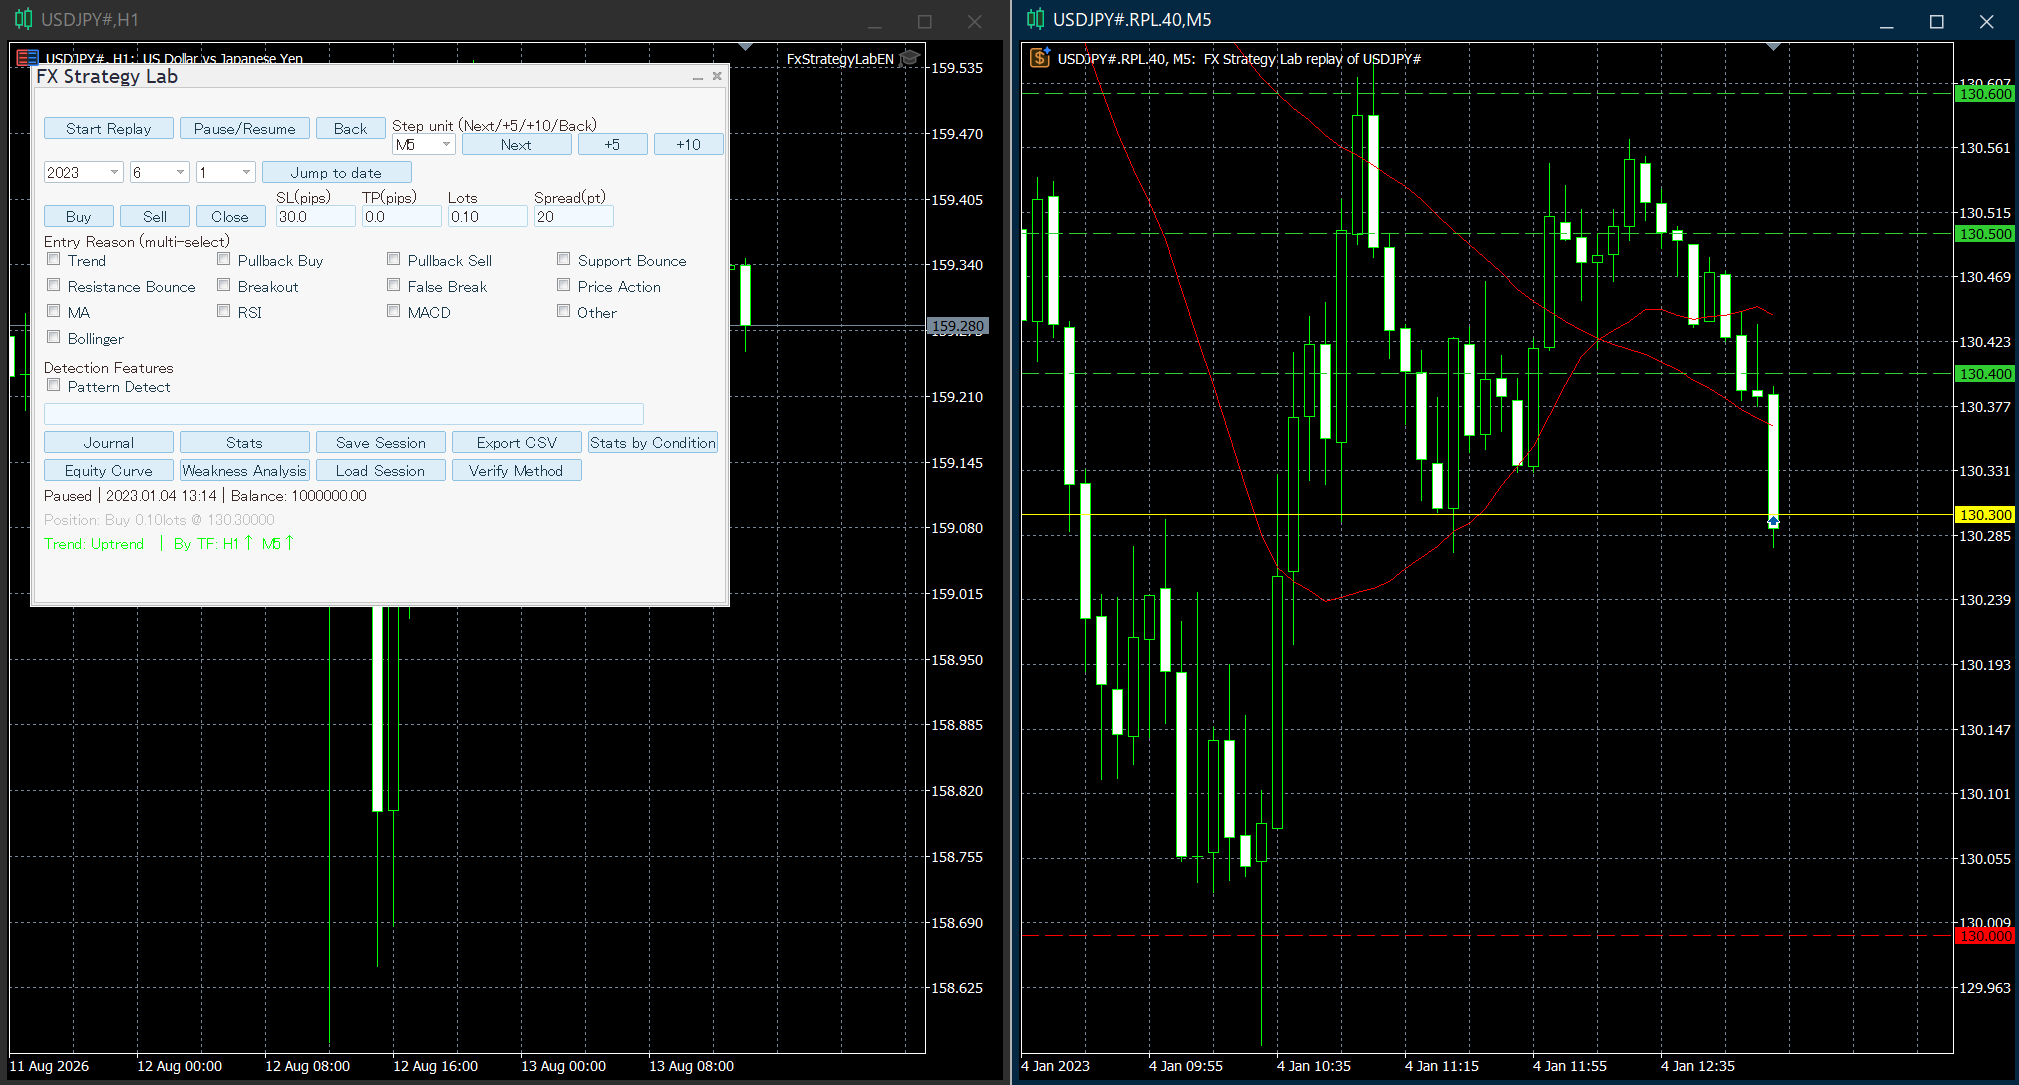
Once attached, the control panel gives you Start Replay, Pause/Resume, Back, Next, +5, +10, and Jump to date. Step through history bar by bar and trade it live-style: Buy or Sell with your own SL/TP in pips and lot size, tag the entry with a reason, and add a free-text comment. Every entry and exit is marked directly on the chart and saved to a searchable trade journal.
Michaeltakaba Tsukasa
FX Strategy Lab - Setup Alerts, Sessions & Data Export

Setup Alerts fire a popup and a sound the moment a signal forms, with your choice of trigger - pattern, divergence, MACD/MACD-zero cross, RSI/Stochastic level or cross, Bollinger signal, S/R breakout, structure break, Ichimoku signal, and more. You can also require an uptrend/downtrend, or proximity to support/resistance, before the alert is allowed to fire.

Save Session stores your symbol, timeframe, verification period, initial balance, full trade history, and the exact bar the replay was paused at. Load Session (before starting a new replay) rebuilds the same replay and automatically fast-forwards back to that paused point, so you can pick up a verification run exactly where you left off instead of starting over from the beginning of the period.

Trade history and Method Verification results both export straight to CSV, so you can open them in Excel or any spreadsheet tool to dig deeper or keep a longer-term record.

That's the full toolkit. A full step-by-step manual covering every input parameter and screen will also be linked from the product page.
Michaeltakaba Tsukasa
FX Strategy Lab - Journal, Statistics & Automated Method Verification

Every trade you place in the replay is saved to a full trade journal - entry/exit price, P/L in money and pips, R-multiple, your entry-reason tags, and comments. Statistics break it down further: win rate, profit factor, expectancy(R), win/loss streaks, and drawdown, by trend state and trading session.

Stats by Condition lets you filter your history by trend, session, Bollinger state, and ATR state (all multi-select) to see performance under any specific combination. Weakness Analysis goes a step further and automatically surfaces which conditions your own trade history is weak or strong in, based on your actual results.

For a different kind of testing, Method Verification lets you select any combination of built-in conditions - trend, MACD, RSI, Stochastic, Bollinger, Ichimoku, S/R breakout, market structure, ATR, candlestick patterns, divergence, and more - combine them with AND logic, set your TP/SL/lot rules (or RR ratio, ATR sizing, breakeven, trailing, split TP), and get win rate, profit factor, expectancy, and drawdown over your full available history in seconds. Every run is logged to CSV so you can compare methods side by side later.

Most backtesting tools stop at a single equity curve. Most trade journals only track trades you've already placed. FX Strategy Lab combines both, so you can go from "practice this method by hand" to "verify it automatically across years of history" without leaving the same EA.
Michaeltakaba Tsukasa
FX Strategy Lab - Risk Management Tools

Getting the entry right is only half the job - FX Strategy Lab also lets you practice a full risk-management toolkit, and every option below works identically in live replay trading and inside the automated Method Verification engine, so what you test is what you'd actually trade.

TP/SL can be fixed pips, an RR-ratio-based TP (e.g. RR = 2.0 means TP is twice as far as SL), or ATR-multiple-based sizing tied to current volatility. You can also place your SL behind the most recent swing high/low instead of a fixed distance.

Move to breakeven automatically shifts your SL to entry price (plus an optional buffer) once open profit reaches your trigger. A trailing stop keeps your SL following price as it moves in your favor.

Split TP1/TP2/TP3 closes part of your position at each of three targets instead of all at once - each TP line disappears from the chart the moment it's hit, leaving the remaining targets and SL visible, so you can see exactly how a partial-exit plan plays out.

While a position is open, a solid white line marks your entry, a dashed red line your SL, and a dashed green line your TP, right on the chart.
Michaeltakaba Tsukasa
FX Strategy Lab - Support/Resistance & Market Structure

Beyond indicators, FX Strategy Lab tracks the price levels traders actually watch.

Swing-cluster support/resistance levels are detected automatically from recent swing highs/lows, with a confirmed-close breakout signal: it fires the instant a candle's CLOSE crosses the level - a wick that only touches or briefly pierces the line does not trigger it, since a wick-only breach is often a false break (a rejection) rather than a real one.

Also included: previous-day pivot points, previous day/week high-low, previous month high-low, round-number levels, and the Asian session range - all drawn with automatic overlap avoidance so the labels stay readable even when several lines are close together.

Market structure gets its own detector: Break of Structure (BOS) when price breaks a swing level in the direction of the existing trend (a continuation signal), and Change of Character (CHoCH) when price breaks against the existing trend (a possible reversal signal) - both bullish and bearish.
Michaeltakaba Tsukasa
FX Strategy Lab - Indicator Signals

FX Strategy Lab ships with a deep library of built-in signal detection, all running directly on your replay chart in real time.

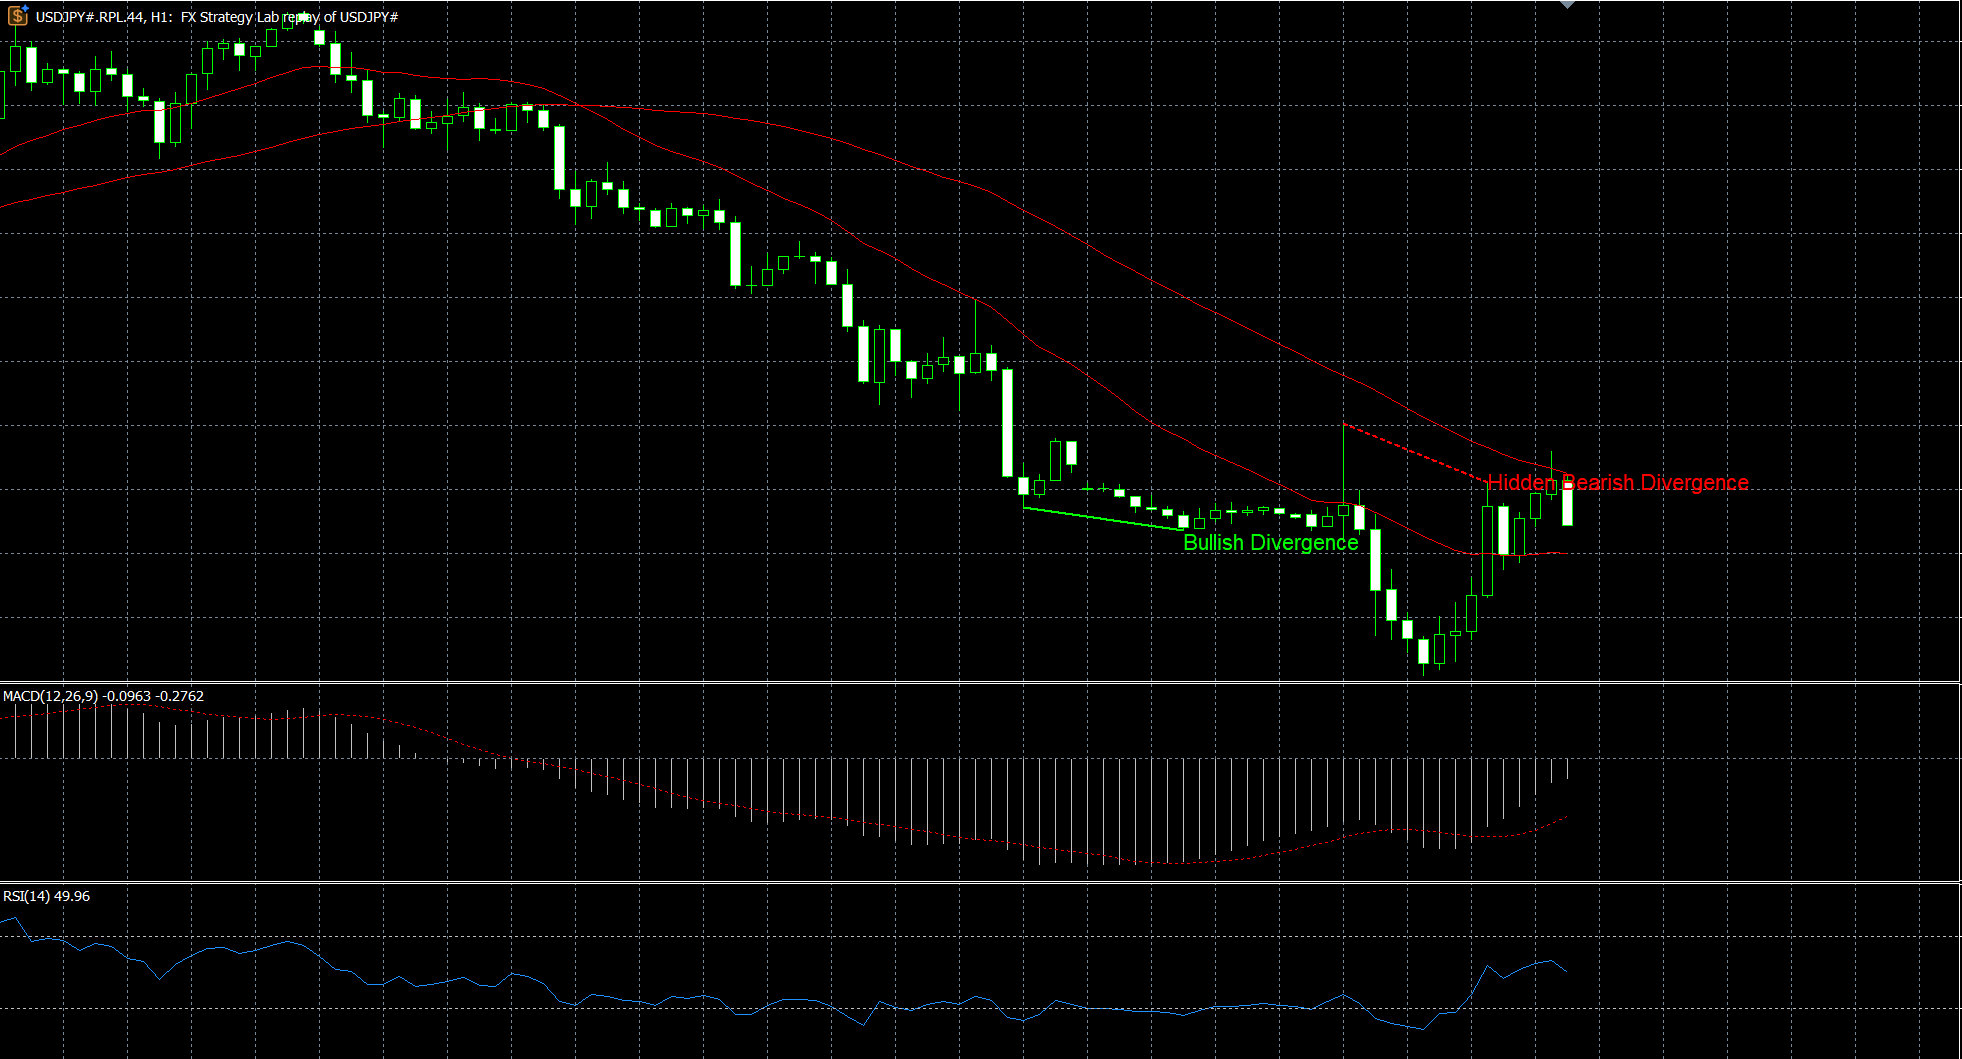
MACD gets golden/dead cross detection, a separate zero-line cross signal, and regular divergence - drawn with its own color pair and a "MACD" label prefix so it's never confused with RSI divergence on the same chart.

RSI covers overbought/oversold crosses, a 50-line cross, and both regular and hidden divergence (solid line vs dotted line, so you can tell them apart at a glance).

Stochastic gets the same depth of coverage as RSI: overbought/oversold, 50-line cross, %K/%D golden/dead cross, and regular/hidden divergence.

Bollinger Bands are drawn three at once - 1-sigma, 2-sigma, and 3-sigma, each individually color-coded - with touch detection, squeeze detection, band walk, and mid-line bounce/break as separate signal types.

Ichimoku Kinko Hyo is fully supported: Tenkan-sen/Kijun-sen cross, cloud (Kumo) breakout, cloud twist, and Chikou Span cross.

All of these can also drive a Setup Alert (popup + sound) and become a condition in the automated Method Verification engine - more on that in a later post.
Michaeltakaba Tsukasa
FX Strategy Lab - Getting Started

Before you begin: FX Strategy Lab replays the price history already stored in your MT5 terminal. Open View > History Center (F2), select your symbol and timeframe, and click Download to pull the full history your broker has available. Note the earliest date shown - that's the earliest start date you can use for a verification period.

To attach the EA, drag "FxStrategyLabEN" from the Navigator onto any chart, check "Allow Algo Trading", and click OK. In the Inputs tab, choose your symbol, timeframe, verification period (start/end date), and initial balance - this period also defines the range used by the automated Method Verification feature later on. Every input's comment is prefixed with a 3-digit number (e.g. "023: Show RSI"), so you can jump straight to any setting using the Inputs tab's search box.

Once attached, the control panel gives you Start Replay, Pause/Resume, Back, Next, +5, +10, and Jump to date. Step through history bar by bar and trade it live-style: Buy or Sell with your own SL/TP in pips and lot size, tag the entry with a reason (trend, pullback, breakout, support/resistance, and more), and add a free-text comment. Every entry and exit is marked directly on the chart and saved to a searchable trade journal.

Two trend-judgment methods are built in: a moving-average method (SMA or EMA, with the fast/slow lines color-coded so they're always easy to tell apart) and a swing-structure method. Both come with a multi-timeframe trend summary right on the panel.
Michaeltakaba Tsukasa 출시돈 제품

Replay historical price action bar by bar, log your entries with reasons, and automatically verify whether your trading method has a real statistical edge. Most traders backtest a method that looks perfect on a finished chart, then watch it fall apart the moment they trade it live. The problem is rarely the strategy - it is that reading a chart AFTER the fact is a completely different skill from reading it bar by bar, in real time, without knowing what happens next. FX Strategy Lab is a

Michaeltakaba Tsukasa
MQL5.커뮤니티에 등록됨