제품 게시
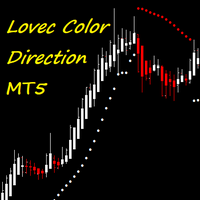
An indicator for better perception and recognition of the current trend direction, the beginning and end of corrections. It is recommended for manual trading, but it is possible to integrate it into an Expert Advisor for automated trading. The dots around the price indicate the current trend direction, the color of the candles themselves indicates the presence or absence of a correction. It is recommended to enter a position in the direction of the current trend after the end of corrections.
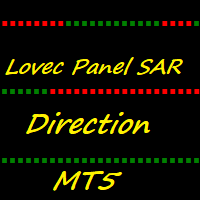
Multi-timeframe Parabolic SAR panel for a better visual perception of the market situation and assessment of the trend, trend reversals. Used exclusively!!! on the daily timeframe. The panel indicates the direction of SAR movement on the current (daily), as well as on the weekly (medium-term) and monthly (long-term) timeframes. It is possible to customize the display colors for each individual timeframe. General Step and Maximum settings for the entire panel.