Kevin Peter Abate
Kevin Peter Abate
1 (1)
  • 정보
2 년도
경험
8
제품
1
데몬 버전
0
작업
0
거래 신호
0
구독자
Kevin Peter Abate
Kevin Peter Abate
So I guess this project has entered a dimension that I really wasn't expecting. I started working on an expert advisor that I will be releasing as Velvet Sea. As far as being a completely hands free piece of software, I'm not entirely sure just yet. I thought that I could at least wait a minute before releasing it. It detects the close of each bar in every time frame up to a day. So then you can look and see what actions the close of the bar will trigger.


Then I don't have to do any more guess work with ticklish bars that are still floating. Trash your demo account with open/close/open/close and then tell me how to tease out a useful strategy. I thought Velvet Sea was going to be a completely different product. I'll have to test it out.


Definitely maybe is better than absolutely not.
Kevin Peter Abate
Kevin Peter Abate
I noticed a glitch in Velvet where ordering with MACD doesn't work. I've been dicking around a little too much one could say to notice that my software could easily plateau and if I plateau on this project, then it will just as soon be concluded. I'm not going to let that happen. Right now, I've been making a bit of a blitz-like effort to get as many indicators supported as I can, and this is what I've found--- ADX and ADXW. And this is a bit of a challenge, because you see, my friends, we have two different indicators. You implement the algorithm that Weilles Wilder wrote about and you don't see the same ADX as usual. I'm going to implement an ADX indicator and an ADXW indicator. Apparently MQL5 supports it natively, but I use MQL4.


So last night I got the ADXW, not knowing that it was ADXW. I knew it was something and I knew that I coded it right. Today I looked a little deeper to find out what the difference was and it looks like it's something to do with the way that the indicator data is smoothed. Weilles Wilder used SMMA and my built-in ADX uses EMA, an exponential moving average, instead to smooth its data. I can't stress how important it is to understand what the indicators measure in terms of price action. ADX gives you three lines --- the main line, the positive directional indicator (+DI) and the negative directional indicator (-DI). And both "flavors" of ADX, if you will, can give you viable signals for entering a trade. Wilder originally designed ADX for long term positions based on daily data from stocks and commodities. The main line is an indicator of volatility and then +DI and -DI are supposed to say something about directionality, and I know these are subjective terms, but very clearly there is a more complicated algorithm here than a simple moving average.


Here's the best link I could find for the description of ADXW:
https://school.stockcharts.com/doku.php?id=technical_indicators:average_directional_index_adx

The wikipedia page is garbage for "ADX", but I'm using it right now for the description of Exponential Moving Averages. Hopefully I'll get an indicator that I can verify against the internal iADX function before too late this afternoon.
Kevin Peter Abate
Kevin Peter Abate
I really need to get myself organized here.

There's a problem with the way I recoded order cancellations using cancel=[object], where it cancels the order when you enter the command in rather than when the order is filled. That's the next update.

I haven't been able to think about the project for the last couple of days. Sometimes it's hard to parse and figure out what the next steps need to be. I'm thinking about going in the direction of better supporting more graphical objects than just trendlines and labels, I'm also thinking about how few indicators are ACTUALLY supported by velvet and yet I wanted to make files so that I could save the state of a chart (or all the charts) and reload it somewhere else.

You can save a CSV file and that's the chart. But that doesn't include the lines you drew, the orders that Velvet stores or command labels that might be holding an equity limit that you've decided to use in your account. So then I make a file to save all the objects and where they are, I don't know which indicator is which anymore or where those objects were, unless I'm using velvet and I had those objects saved according to the handle that's created after the indicator is verified as being Velvet. I hated those things, because when you run Velvet, it's supposed to delete all of them. Somehow, they'll get through the filter and break the damn thing, like if you've ever vacuumed up a paper clip and it jammed up the belt and whole thing either burned up and snapped and/or caught on fire. I think it happens when you have two charts open that are the same symbol and timeframe, that the routine that's used to figure out which chart and symbol you're using, will glitch, because it goes back to the record of all the handles created for the entire session, rather than what the user is actually doing in the local context.


I don't know if that makes any sense, but I'm trying to work through the structure of the program, because there's an object loop that acts within a loop that iterates through each chart and each indicator sub window. That's what I really wanted to do was open up the data displayed in those indicators to the programmer, so that if I wanted to do something based on a graphical object placed on the indicator, I didn't have to go back and re-derive all the different parameters, because that data should already be available to the program. However, there are no "IndicatorGet..." functions implemented. And therefore, I still have purpose. Files will make it more easy to debug this nonsense. Because otherwise you could get yourself quite tangled up in a complicated and unwieldy situation that could take a significant amount of time to deleverage from. I DO NOT recommend looped ordering. Velvet supports looped ordering, but latency can become a problem when you have to clear several hundred orders from the balance sheet. Enough is enough. You have to be decisive, because in that closing process, your equity level could slip significantly.
Kevin Peter Abate
Kevin Peter Abate
I got the new version out today, but there are still a couple of things on my mind. I got the trigger command working again after I'd found a bug. Which is good, but still I need to get organized on how these commands handle each signal, and that's had to be part of the main ordering layer. I know the potential to use chained "triggers" to implement deeper logic, but the problem was that there was no mechanism for indicators to trigger logic deeper than simply opening a position to buy or sell. That is a problem for me. The other problem that I have is that I needed to write a walkthrough for each command, and probably each indicator, too. It'd be a good chance for me to take inventory on how much my software can accomplish vs. how much it does accomplish. Notwithstanding the issue with how to handle indicator signals ( default signals from built-in indicators, NOT signal subscriptions ) I needed to have a better mechanism for logic that could detect simple signal crosses and implement the deeper logic required to handle Ichimoku. Because Ichimoku, unlike the indicators I already support, is drawn out on the main chart window and there's a lot of logic involved that I had to look up to determine when Ichimoku is sending a "buy" signal or a "sell" signal. I do apologize for the lack of capability to back test, but when you use a "bare" indicator then I'm certain you'll end up with mixed results, because you'll have to look for some condition to stop out without losing too much equity, and then you'd also have to have some criteria for closing out profitable trades as well.

There's always work to be done.
Kevin Peter Abate
Kevin Peter Abate
So far, it looks like I'll be testing the new version (2.35) of "velvet" tomorrow. No new indicators. Sorry bout that one guys. I know y'all want me to get to it and program ordering signals for Ichimoku already, but there's gonna be a little cleanup as far as the compiled headers for each indicator, before that happens, seeing as there's a lot of behavior that could be unique to each one. It's not like every single one is gonna be as easy as RSI to decide it's behavior --- that one is either above a trendline or below a trendline. Then, I did add the functionality for RVI and MACD signal orders to be contingent upon the position of the signal cross whether above or below the trendline the command is placed within. I thought that if "velvet" only looked in trendlines and labels for its commands that I'd be able focus development on the command API and verifying its intended functionality before adding any more complexity, whether or not it's unnecessary.

Hopefully I can knock out another solid version before Monday. That's what I said Thursday was probably this weekend it'd be ready. The "debug" and "account" functions were already done this morning and I just coded the "order" functions earlier. I got everything to compile, but it's not tested yet. Maybe do some of that with a little light weekend crypto-trading in my demo.

Cheers Velveteers.
Kevin Peter Abate
Kevin Peter Abate
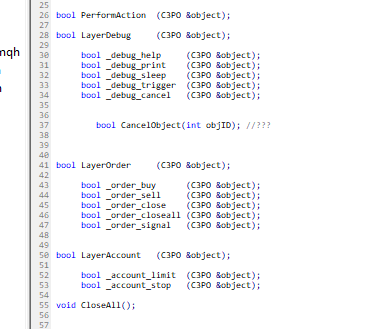
I'm getting myself organized for the next release. It's gonna be pretty fresh. I'm going to offer support for bundled order triggering and cancellation, debug strings and execution delays. So my estimate is that it would be possible to place a running order after a certain time interval until a certain condition is met that will cancel the running order. The thing about it is that I like the concept of an expert advisor. I really do, but once you've installed it into your session it's impossible to remove. Maybe that alienates a lot of people from wanting to use my software, but if they wanted it to place nice with magic numbers, before they were willing to really put it into practice, let alone even test it out on a demo, I had to take that into consideration. But right now, I'm celebrating a small victory in that I got a bundled object trigger to work. I think this next version is already a significant improvement in terms of execution efficiency, less cranky repetitive error messages and overall organization of the code. Version 2.35--- it should be available maybe over the weekend. We'll just have to see how much progress I make this week. I don't think I should be charging for it yet. No... not at all, until I have at minimum a more complete understanding of how exactly Ichimoku works. That step is definitely going to be one of the final stages of development. However, the underlying layer where everything is really contained by trendlines and labels, is coming along nicely. I have a mechanism for replacing the equity monitor. Labels with a code work better, because you can change that parameter more easily in the object editor. Object editor is your friend when you use velvet. This is an environment that I'm coding for coders tired of recompiling advisors that are impossible to debug. Not that this is going to be any easier (This is going to be easier to debug and trace for sure) However, I'm trusting users to understand that they gotta use those indicators, understand how they work and how to implement strategies with the various utilities available. This is what the layout of the API looks like right now, but nothing is set in stone just yet.
Kevin Peter Abate 출시돈 제품

Velvet MACD is intended for use with the Velvet advanced ordering layer.  It is a modified version of the MACD indicator provided by Metaquotes and all of the data it displays is accurate and verified, when it is detected by the ordering layer.  In order to place orders with the Velvet MACD indicator, the ordering layer must be installed and running.  Ordering from the Velvet MACD indicator requires that "Velvet Ordering Layer" ( found here ), version 2.0 or higher, be installed

Kevin Peter Abate 출시돈 제품

Velvet RVI is intended for use with the Velvet advanced ordering layer.  It is based on the algorithm for the Relative Vigor Index, provided by Investopedia here . All of the data it displays is accurate and verified against the internal API function iRVI, when it is detected by the ordering layer.  In order to place orders with the Velvet RVI indicator, the ordering layer must be installed and running.  Ordering from the Velvet RVI indicator requires that "Velvet Ordering

Kevin Peter Abate
Kevin Peter Abate
There's a syntax to the new version where I have it configured as

[layer].[action]([parameters]); [constants]; // [comment]

so if you change the description of a trendline to the most simple statement in "C3PO", you type in

order.buy(0.01, above);

And then you're waiting for a price break out above the trendline you drew to trigger the order. Velvet changes the name of the line on a price chart or a supported indicator. Currently trendlines are only supported on the velvet compatible version of RSI. Velvet indicators aren't any better than the regular indicators, except that they had cool looking computery code that's otherwise useless for a title. But after I updated velvet to better support that type of string formatting, I knew immediately that I had to do something else with it. I mean, MQL4 is a bit sandboxed from reality, but it handles arrays so much better than regular C++. So I took it a step further and use statements like that to control the ordering system.

Dare I call it an object-oriented ordering system, but that's sort of what it is. There are clearly refinements that I can make to the code, but I think that this is really ready for prime time and I wouldn't be bragging about it if I wasn't really ready to be charging for it. You can set orders to cancel orders. That looks like this:

order.buy(0.01, below); cancel=N;

where N is the OBJECT number of the order you want to cancel. The parameters in order.buy and order.sell are the same. It's the volume of the order (EagleFX uses 0.01 for its volume step), and then either the word "above" or "below". These are case-sensitive statements that only use lowercase letters. order.close is exactly the same, but only takes the parameter "above" or "below". However, you had to specify either one object=N; or one ticket=N in the constants region, so it would look like this:

order.close(above); ticket=XYZ; or

order.close(above); object=ABC;

where XYZ is the order number for an open position listed in the trade table, or if you wanted to close a position that either will be or has been triggered by a certain trendline order that has been detected, ABC is the object number -- the N from velvet.object=N .

Don't delete the handles that display "Velvet Enabled." or "Velvet Disabled." Those are tagged on by the program according to which chart, window and time frame the indicator is displayed for. Some indicators show different data for different time frames, and I had to track that as well to make sure that the order was being triggered by the correct data.

This version includes, finally, support for placing orders based on signal behavior. So you enter "order.signal(0.01);" and wait a second; the program adds a few constants, but don't be too intimidated. That let's you know the ordering system has found your order. Use any appropriate volume and this will wait for the signal to come before selling if the red signal crosses above the main line or buying if the red signal crosses below the main line. That's how MACD and RVI work. And if you use my software you have to have my indicators to place orders using those statements.
Kevin Peter Abate
Kevin Peter Abate
RVI is detected and verified, but I haven't coded any actions based on labels, so labels don't do anything. I spent the better part of tonight coding the indicator over again. It runs and it's close, so the values are verified to eight digits of accuracy and only four are displayed, so it's insignificant. But I liked two word commands. "Wait Sell" and "Wait Buy" will enter a position the next time the specified crossover event occurs only if it appears on the chart and hasn't been cancelled or deactivated. I don't think I'm trading from a trend line with the Relative Vigor Index. It looks like it works "sometimes" and it kinda works "a lot", but those are very subjective terms at this point, because I'm a bit tired and I should be better about sleeping on a more regular schedule. Argh.

That's another thing that will affect the quality of your trades---not sleeping.
Kevin Peter Abate
Kevin Peter Abate
Next update to velvet will be two new product listings and one update to the ordering layer that will support placing single orders at crossover events in MACD and RVI. This is my priority right now to narrow the places that users look for returns, without forcing them to commit to using a signal that may or may not work all the time. However, the virtue of looking to technical indicators should be understood. They move the market when people aren't eyeballing them intentionally, and then there are a lot of algorithmic trading systems that move the market when "algo"'s are. And sometimes those indicators can be indecisive. If RSI is around 50, maybe steer clear. If RVI is near 0, you maybe think momentum, but I don't want to get in too late and be on the wrong side of indecision. You lose money, it's because you're buying indecision and shitting your pants when the market goes against you. Don't shit your pants when the market goes against you. You think you know where it's going in the end. Fine, get out and get back in later. Don't wait for your broker to write off your position, before you're out 10,000 rupees. Know your limits and live to fight another day.

Happy trading, happier code.
Kevin Peter Abate 출시돈 제품

Velvet RSI is intended for use with the Velvet advanced ordering layer.  It is a modified version of the RSI indicator provided by Metaquotes and all of the data it displays is accurate and verified, when it is detected by the ordering layer.  In order to place orders with the Velvet RSI indicator, the ordering layer must be installed and running.  Ordering from the Velvet RSI indicator requires that "Velvet Ordering Layer" ( found here ), version 1.0 or higher, be installed and

Kevin Peter Abate 출시돈 제품

velvet is an advanced ordering layer designed with MQL4 for use on a virtual private server to allow users to place orders with graphical objects placed onto compatible indicator charts displayed in the user session.  The current version of  velvet  supports ordering from trendlines placed on price charts and ordering from trendlines on the compatible version of the RSI indicator found here .  For compatible indicators to function they must be installed to the "velvet"

Kevin Peter Abate
Kevin Peter Abate
I may have a workable solution. I don't think I'm going to do anything towards replacing the buttons for buying and selling at the market rate for symbols at this time, but "Velvet" is at least smart enough to monitor all the pending orders and trendline orders for a condition where the initial equity cost incurred by the spread of that symbol at that volume will trigger an immediate position stop or equity stop. Those orders will be deleted and orders placed via trendlines on those symbols will be marked as cancelled. I had to write the description, but the new product will be called "Velvet" and then I will also be uploading a Velvet compliant RSI indicator. Then going forward I'm only going to update "Velvet" as needed when I add support for new indicators and order types and upload those compliant versions as well. Like oscillators---I definitely want users to be able to place labels to indicate that they want to place an appropriate market order when the oscillator shows a "cross". I also thought I needed to add OCOs to trendlines, particularly if I can get trendline OCOs that can act on each other between two different charts.


I digress.
Kevin Peter Abate
Kevin Peter Abate
I have a working prototype for the velvet ordering layer that is compatible with placing orders with trendlines on price charts that supports RSI if you install the velvet compliant version of the indicator. However, I'm not going to release it, until I'm able to fix the problem with the equity monitor where it will close a position immediately when it's opened if the price of the spread exceeds equity stop enforced for each position. This is no small task. You'd think it'd be straightforward and simple to program, but this is not so. You get an account denominated in BIT and want to determine what the initial cost of the spread for something like, say XAUEUR is going to be, and you get the spread price in EUR. Which is fine, until you realize that there's no rate feed for BITEUR. Or supposing your account is denominated in JPY, then the program had to detect USDJPY and know that JPYUSD is not in the symbol subscription list. Again, it's not as straightforward as you think, but I'm going to prioritize this issue and the next release will reject your order if opening a position will cause the equity monitor to immediately close it.
Kevin Peter Abate
Kevin Peter Abate
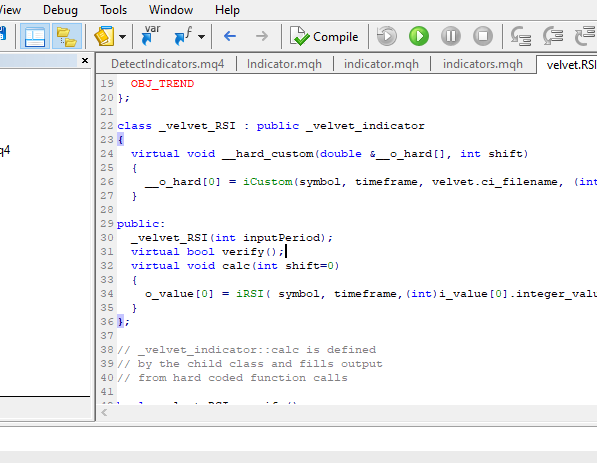
The child class used by the detection layer to access the indicator. The function "verify" checks the data between the velvet indicator that will display the entire debug string and the values provided by the internal function call probabilistically.
Kevin Peter Abate
Kevin Peter Abate
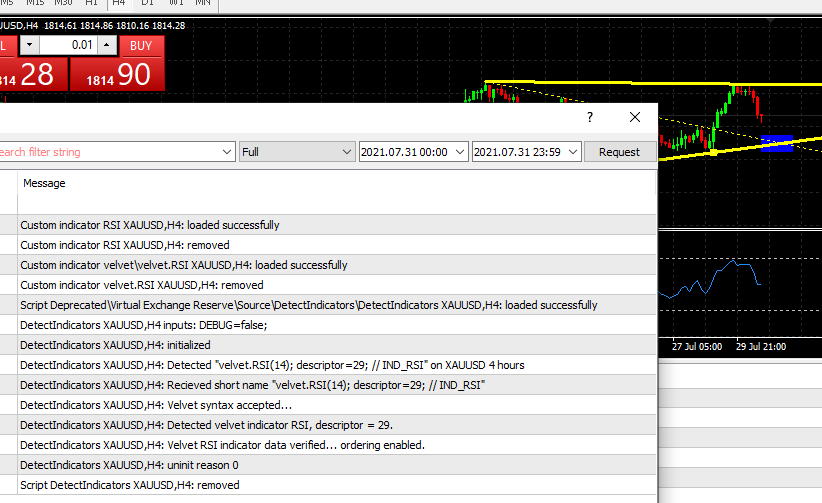
I had a breakthrough today in that I finished customizations on the code for the RSI indicator and got the script for MetaTrader Terminal to detect the modified code, extract the parameters, and verify the data from the modified code against that produced by the internal functions. It displays a debugging string that looks like C-code. It exposes the hidden parameter data and it's now going to be a separate part of the next release, that you would have to download on it's own after updating, which is okay, because the packages are tiny. But yeah, it looks like "all systems are go" for this project.


Velvet is a layer for entering orders for trades manually based on indicator data. I see expert advisors that don't require the same degree of maintenance, but I think I've got something legit here. I don't see anyone offering this or anything like this, at least not on here. It's become much more sophisticated and powerful now that the first customized indicator has been detected. All the data displayed is the same. But there are gonna be a lot more listings under my name in the market. Most of them are going to be redundancies with code provided by Metaquotes, that was maybe only modified to display a different short name and accept the applied price parameter. The indicators in the "Oscillator" set accept input through a dialog box and not the same tabbed confirmation window that's displayed for a script, but with output like that, I'm really happy with my progress this weekend.
Kevin Peter Abate
Kevin Peter Abate
I decided that if I was really gonna take out my goal for this project, I'd have to replace all of the indicators with modified ones that ran a compatibility mode. I'm definitely making progress, but with each update, I think, to the Trendline Ordering Layer that I already have available, that users will have to download the compatibility indicators individually to use them for trading. And I don't really want to endorse positions here, either, but it does look like XAUUSD is in no man's land for the spot markets until the RVI crosses over again--it's already above trend, but hasn't crossed down yet. You could look and see for yourself that it's more indecisive on the short term charts, but that still backstops long term against the 4 hour chart which is still, it looks like, long for now.

But yeah, that's what it's gonna take for me to be able to trigger an order from a graphical object placed onto an indicator sub window attached to a chart. The program had to do some data checking to make sure that the indicator is not being spoofed, either, but then once it passes that check, I'll start with the regular trendline and see what I can do with other objects later---and which objects can trigger a market order and open a position will vary with each indicator, but I'll get there when I get there. Likely, for oscillators like RVI and MACD, you'll put a label or a text object to "wait" on either a buy or a sell signal when either the lines cross or the line crosses the histogram.

In economics they call it the opportunity cost. If you want to sit on Expert Advisor XYZ to place automated trades for you and you have it calibrated properly and you turn a profit consistently, great. Go make money. I make software.
Kevin Peter Abate
Kevin Peter Abate
It's rare you have an epiphany, and I feel like I'm beginning to understand the markets a bit better, because working on this project has forced me to crawl the indicators the way simply trashing a demo account couldn't. I thought we could dump the psuedobureaucratic bullshit and just call it velvet. This is gold post-GDP, and you'd look at RSI and think that you were getting into position for a short, but I'd wait on that and watch the RVI, the "Relative Vigor Index". If you Google it, the search page shows Relative Strength Index, but they're two different indicators here. This is one I'll be able to detect natively, though I wouldn't recommend actually placing an order on it with a trend line. Maybe for this one, just hypothetically, I wanted to put a label object with the text "Wait Sell" on the indicator to wait for a sell signal before shorting. I don't want to be short gold in the spot market right now at all. Solid coin or bullion is where you want to be, for now, otherwise you're probably in for a bumpy ride no matter which position you take if you're not already in. I'm just saying if you go long, you better buckle your seat belt.
Kevin Peter Abate
Kevin Peter Abate
I was trying to find how to access the data from the "indicator sub windows", but all of my attempts have been stymied. I'm frustrated that the result I wanted is going to be much more round about and involved to accomplish. But it remains my position that if I respect the power of the platform and make my best effort, that I will be able to continue to make software extensions that people will eventually find worthwhile to use. The problem of accessing the indicators, is the problem that there is no functionality in the API to access that data. The "ChartIndicator..." functions are limited in scope, so you have to make a call either to the indicator function itself after a lengthy detection procedure, or make calls to "iCustom". Some indicators are better about making their parameters visible than others. A thought I had toyed with was releasing individually modified indicators that would be compatible with Virtual Exchange Layer software, so that once a user was using one of those indicators it could be detected and then it would be possible to place orders with a trendline on indicators modified to run in a compatibility mode. I feel like the lack of direct access to indicator data from scripts makes this project sound a little hokey. If I was one of their actual software engineers I'd have a better understanding of why this capability appears to have been "overlooked", but I'm only me. And I have to do the best I can with what I've got even if I don't have the best latency. EX4's are deeply sandboxed as well. So being blind to the parameters means I kinda have to roll my own layer for object oriented manual ordering. I don't think anyone on here is offering manual ordering from indicator trends. You see people offer expert advisors and signal subscriptions, but I don't think anyone's implemented the kind of manual ordering layer that I want to offer on this market space. However, MQL4 is already showing its age and my code isn't that advanced. Equity limits are a very basic thing to code and important to use so that your broker doesn't man handle your equity and leave you in the lurch with a big correction, after a modest gain. There are better implementations of what I'm trying to offer out there, I'm fairly certain of that. It would make sense if financial institutions had access to special editions that did what I'm trying to do, out of the box, without having to rely on necessarily bloated VM code. I don't want to complain about it. Free software is free. But we can at least try to level the playing field here.
123