Matthew Thomas Paranac / 판매자
제품 게시

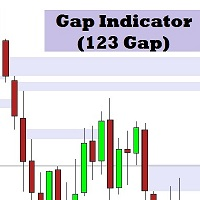
갭 지표 (123 갭): 잠재적 가격 목표를 식별하는 정밀 도구 갭 지표 (123 갭)는 시장 구조를 기반으로 높은 확률의 가격 목표를 식별하도록 설계된 강력한 도구입니다. 연속된 3개의 캔들 세트를 분석하여 이 지표는 종종 가격 움직임의 자석 역할을 하는 중요한 갭을 찾아냅니다. 작동 방식 지속적 분석 : 차트의 모든 연속 3개 캔들 세트를 스캔합니다. 갭 식별 : 각 세트의 첫 번째와 세 번째 캔들 사이의 갭을 계산합니다. 시각적 표현 : 식별된 갭은 쉽게 해석할 수 있도록 색상 코드화되어 차트에 표시됩니다. 주요 이점 잠재적 반전 예측 : 트렌드 반전 후 가격이 돌아올 수 있는 영역을 강조 표시합니다. 리트레이스먼트 목표 식별 : 리트레이스먼트 중 가격이 일시 정지할 수 있는 수준을 지적합니다. 거래 진입 및 퇴출 개선 : 갭 수준을 사용하여 진입 및 퇴출 지점을 정교화합니다. 실제 예시 하락 트렌드 시나리오에서: 첫 번째 캔들의 저가: 1.0000 세 번째 캔들의 고가: 0.

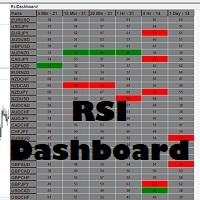
Never miss when a pair is being oversold or overbought again!! This RSI dashboard allows you to monitor RSI levels on 6 different time frames for up to 30 different currency pairs. This dashboard is packed with features including: 1. Monitoring of 6 customizable time frames (M1, M5, M15, M30, H1, H4, D1, W1, M1) 2. You can set the overbought/oversold levels you want for EACH time frame and they will be highlighted in the dashboard when a pair gets to that level
3. You can also set the RSI period